DOI:
10.1039/D3RA00786C
(Paper)
RSC Adv., 2023,
13, 11055-11061
Modulation of chiral spectral deflection by van der Waals force-induced molecular electropolarization in catenane oligomers†
Received
6th February 2023
, Accepted 31st March 2023
First published on 6th April 2023
Abstract
The striking chiral optical properties of carbon nanostructures are closely related to the precise three-dimensional spatial arrangement (interaction) of carbon atoms. This work investigated the chiral optical properties of three different structures of all-benzene catenane and trefoil knot regulated by van der Waals (vdW) forces using density functional theory (DFT) calculations and wave function analysis. We systematically illustrate how molecular electrical polarization modulates the chiral optical deflection of alkane oligomers under the induction of van der Waals forces. In this work, the UV-vis spectra, transition density matrices (TDM), and electron–hole density diagrams of three molecules have been studied. Combined with a visualization method to represent the effect of molecular polarization on transition electric/magnetic dipole moments (TEDMs\TMDMs), the results show that vdW interactions can induce chirality deflection in polymers. This mechanism provides a clear direction for designing polymers with specific chirality: by modifying the structure, vdW interactions can be generated in specific regions, and then the chirality of the molecule can be precisely regulated. This will help us to establish a strategy for precisely-oriented design of chiral optical materials, and provide guidance for the application and development of optoelectronic materials in specific fields.
1 Introduction
In 2019, Itami et al. successfully synthesized for the first time three cycloparaphenylene (CPP) molecules with different structures composed of para-phenyl rings through a traceless synthesis method.1 They are carbon nanomolecules composed of sidewall segment structures of carbon nanotubes, with alkane and trefoil junction topologies. Geometrically, trefoil knots belong to the class of torus knots. They retain the high symmetry and radial π-conjugation mode characteristic of CPPs, but also exhibit unique intramolecular electron interactions and dynamic motions. Nowadays, more and more chain molecules with mechanically interlocked structures are being prepared,2–4 and the synthetic basis for the preparation of more complex structures has been laid.5–7 This novel synthetic method will generate a wider range of topological molecular nanocarbons and open the door to the field of nanocarbon scientific research.
A chiral molecule refers to a molecule with a certain configuration or conformation that is different from its mirror image and cannot overlap with each other. The enantiomers of chiral molecules generally have similar chemical structures and physical properties,8 but they often show completely different effects in organisms.9–11 Chiral structures have a very wide range of applications in optics,12–15 and chirality regulation plays a very important role.16–18 Nonlinear effects, such as second harmonic generation (SHG), serve as extremely sensitive probes of structural symmetry,19 allowing us to distinguish between chirality and anisotropy effect.20 This chiral molecule has a unique molecular electric field. Under the influence of weak interactions and van der Waals (vdW) forces on molecules, strong repulsion occurs when two atoms are in close proximity to each other and the electron clouds overlap each other. The fluctuation of the atomic electron cloud makes the atom have an instantaneous electric dipole moment, which induces the electric dipole moment of the nearby atoms. The result is a mutually attractive inter-dipole interaction that forms this special structure and generates charge transfer, which can reasonably explain that molecular chirality can also be regulated by intermolecular interactions.
In this work, the energy composition of the two structures 1 and 2 is studied through an independent gradient model based on Hirshfeld partition (IGMH), indicating that the dispersive interaction of these two structures plays a major contribution to the intermolecular binding. Secondly, by examining the vdW potential, we know where the molecules tend to bind to the system through the action of vdW. It has important implications for understanding vdW interactions between chemical systems and the external environment. On this basis, in order to clarify the difference of the polarities among the three systems, we comprehensively displayed the first hyperpolarizability through the unit sphere representation, so as to intuitively examine the degree of change of the molecular dipole moment. Finally, the UV-vis spectra, transition density matrices (TDM) and electron–hole density diagrams of three molecules are studied. And the nature of the three structural chirality is understood by analyzing the densities of TEDMs\TMDMs in different directions.
2 Calculation method
In this work, the molecular structure was optimized by Gaussian software21 based on the density functional theory (DFT),22 B3LYP functional23 and the 6-31g(d) basis set24 combined with DFT-D3 dispersion correction.25 Electron excitation spectra was calculated by the CAM-B3LYP functional26 and the 6-31g(d) basis set. D3 correction only calculates the correction energy based on the geometric structure, independent of the electronic state, and only changes the energy without affecting the wave function of the system. The geometric structures used to calculate different electronic states are the same, so the addition of D3 does not affect the calculation results. The three structures used in this article do not have virtual frequencies, and the infrared (IR) spectroscopy is provided in the ESI (Fig. S1).† The wave function analysis including electron–hole density,27 transition electric/magnetic dipole moments (TEDMs/TMDMs),28,29 vdW potential,30 IGMH31 and electronic circular dichroism (ECD) were done by the Multiwfn program.32 All 3D maps in this work were drawn by the VMD program.33
3 Results and discussion
Carbon nanomolecules have shown excellent applications in optoelectronics due to their strong charge mobility, and the modulation of chirality is of great significance.34–37 In 2019, Itami et al. successfully synthesized three cycloparaphenylenes (CPP) molecules with different structures composed of para-phenyl rings through a traceless synthesis method for the first time.1 They nested different numbers of CPPs together in different ways to form diverse interlocking structures. This shows that a variety of intermolecular interaction structures with different strengths can be synthesized by adjusting the size and interlocking mode of CPP, and then its chirality can be adjusted purposefully. Fig. 1(a–c) are schematic diagrams of the three structures, respectively. Among them, molecule 1 is formed by two [12]CPP molecules nested in each other, and the angle between the planes where the two chains are located is 40.58°. Molecule 2 consists of a [9]CPP and a [12]CPP molecule nested with each other, and the angle between the planes where the two chains lie is 74.55°. Molecule 3 consists of 24 para-phenyl rings connected to form a unique trefoil knot structure.
 |
| | Fig. 1 Schematic diagram of the geometric structure of molecules 1 (a), 2 (b) and 3 (c). | |
3.1 Weak intermolecular and intramolecular interactions
In this section, the weak intermolecular interactions of two systems 1 and 2 and the weak intramolecular interactions of 3 are studied using IGMH and the energy decomposition analysis based on forcefield (EDA-FF) method.38 IGMH is an important way to graphically represent custom inter- and intra-fragment interactions. IGMH is defined as:| | |
δg(r) = gIGM(r) − g(r)
| (1) |
| |
 | (2) |
| |
 | (3) |
where r is the coordinate vector, ∇ is the vector differential operator, ρi represents the electron density of the i atom. δg shows the interactions between all atoms in the current system. In order to reflect the inter- and intra-fragment interactions, δginter and δgintra are defined:| | |
δginter(r) = gIGM, inter(r) − ginter(r)
| (4) |
| |
 | (5) |
| |
 | (6) |
| | |
δgintra(r) = δg(r) − δginter(r)
| (7) |
EDA-FF is a method to decompose the total interaction energy between fragments into energy terms with physical meaning, which is beneficial to investigate the nature of the interaction. EDA-FF is defined as:
| |
 | (8) |
| | |
EvdWAB = ErepAB + EdispAB
| (9) |
| |
 | (10) |
| |
 | (11) |
where
A and
B are atom numbers,
q is the atomic charge,
r is the distance between atoms,
ε is the vdW action potential well depth,
R0 is the non-bonding distance between atoms. The interatomic vdW action energy is exactly equal to the potential well depth when
r =
R0.
From Fig. 2(a), it can be clearly seen that the isosurfaces of the intermolecular interactions of 1 and 2 and the intramolecular interactions of 3 appear green, which indicates that the dispersive interaction plays a major contribution to the intermolecular binding. Intermolecular (intra) interactions are typical vdW interactions. Compared with 2, the isosurface area of structure 1 is larger, indicating that it has a larger interaction and a larger binding energy, which also indicates that its molecular stability is stronger. The energy decomposition results of 1 and 2 are shown in Fig. 2(b). Among them, electrostatic interaction and dispersive interaction contribute to the attraction between molecules, while exchange interaction is not conducive to the attraction of molecules. Compared to dispersive interactions, electrostatic interactions are completely negligible. It can be seen that the total interaction energy of the two systems is quite different, which is mainly caused by the difference in dispersion interaction. This is also consistent with the IGMH analysis results.
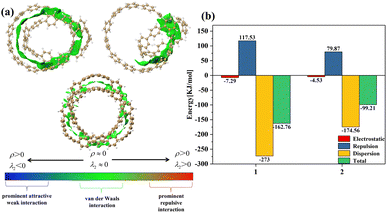 |
| | Fig. 2 (a) The IGMH diagram of three structures. The green area is the interaction isosurface. (b) The energy possessed by different physical components. | |
3.2 vdW potential
Through the analysis of the different energy components of structures 1 and 2 in the previous section, the strong dispersion interaction reveals the essence of the formation of this relatively stable structure. And this phenomenon will lead to the particularity of vdW potential. In this section, we investigate the vdW potential, which helps us understand where small molecules tend to bind to this system through vdW interaction, which can easily reveal the vdW interaction between the chemical system and the external environment. Since the electrostatic interactions are completely negligible when noble gas atoms are used as probe atoms, we choose He as the probe atom. Typically, only the negative region of the vdW potential is of chemical interest, since the dispersive attractive effects outweigh the exchange repulsive effects in this region. In order to facilitate the observation of the negative region of the vdW potential, we hide the region of the positive isosurface during the drawing process.
In Fig. 3, most of the regions with negative vdW potential isosurfaces of structure 1 and structure 2 are distributed inside the system, and only a small part of the region is outside the system, while the negative parts of the vdW potential isosurface of structure 3 are completely distributed within the system. The red ball in the Fig. 3 is the minimum point, which is the position of the global most negative point that we need to focus on. It can be found that the positions of the minimum points are all ravines in the system, and are also the positions with the most surrounding atoms. Atoms in the region near the red ball can feel the strongest vdW gravity, mainly because they can be attracted to many atoms near the region at the same time. Since dispersive attraction is essentially a short-range interaction, we can see from the Fig. 3 that the vdW potential of other parts decays with the increase of the interaction distance. In summary, non-polar molecules tend to be adsorbed at the ravines of the system.
 |
| | Fig. 3 The vdW potential isosurface plots for the three structures with He as the probe atom (isosurface is −0.85). The red ball is the lowest point of vdW potential. | |
3.3 Visualization of the first hyperpolarizability
Through the study of intermolecular interaction, it is revealed that the main interaction between molecules in the chemical system is vdW interaction, and the vdW interaction of different strengths will cause the molecules to produce different degrees of polarization. In this section, the unit spherical representation39 is used to visualize the first hyperpolarizability40 to reflect the degree of structure 1, 2 and 3 polarization. This method can intuitively and comprehensively investigate the characteristics of β tensor, thus showing the anisotropy of the system. In order to clearly show the direction of the two electric fields applied to the molecule, and the coupling of the electric fields will cause the dipole moment of the molecule to change in what direction and to what extent, the unit sphere representation defines the β vector:| | |
βeff(θ,ϕ) = β × e(θ,ϕ) × e(θ,ϕ)
| (12) |
where e(θ,ϕ) is the unit vector from the origin towards the spherical polar coordinate (θ,ϕ). The βeff(θ,ϕ) vector calculated based on beta (−2ω,ω,ω) reflects the direction and magnitude of the dipole moment oscillating at a frequency of 2ω caused by the combined action of two electric fields with a changing frequency of w in the (θ,ϕ) direction. Calculate the β vector for each point on a sphere of a certain radius, draw arrows and color them according to the direction and size of the vector, and get the image corresponding to the unit sphere representation.
Fig. 4(a–c) are the static first hyperpolarizability tensor of three structures. Fig. 4(d–f) show the dynamic first hyperpolarizability of three structures when the external field is 1064 nm. The arrows on the spherical surface in the figure represent the change of the dipole moment of the molecule when the center of the molecule applies an external electric field of the same strength in all directions. Overall, the static and dynamic first hyperpolarizability of 1 and 3 are very small and completely negligible. This is due to its centrosymmetric structure. But this does not mean that the first hyperpolarizability is negligible anywhere in the system. The unit sphere can perfectly reflect the polarizability of different positions in the system. It can be seen from Fig. 4(a–c) that the static β of 1, 2 and 3 becomes larger in turn. When an external field of 1064 nm is applied to the three structures, the polarizability of the three is enhanced to different degrees. It can be seen from Fig. 4(b and e) that a large number of arrows (red arrows) representing the magnitude of polarizability point downward, leading to the general trend of polarizability (green arrows) downward, indicating that structure 2 is in the direction perpendicular to the [9]CPP. The polarizability is large in the direction parallel to the [9]CPP, while the polarizability is small in the direction parallel to the [9]CPP.
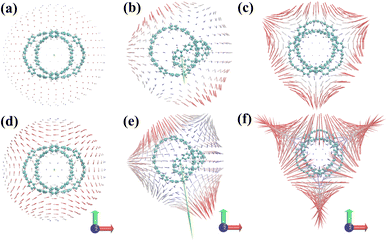 |
| | Fig. 4 (a–c) Unit sphere representation of static first hyperpolarizability tensor of three structures, (d–f) dynamic first hyperpolarizability when the external field is 1064 nm of three structures. The blue-white-red colors represent the first hyperpolarizability from small to large. The green arrow is the general trend of the first hyperpolarizability of the system. | |
3.4 UV-vis, ECD spectra and transition electric\magnetic dipole moment
Fig. 5 is the UV-vis spectrum of three structures, each of which has only one absorption peak between 250–350 nm. The absorption peak positions of molecule 1 and molecule 2 are the same, but the absorption intensity is significantly different. The absorption peak intensity of molecule 1 is higher than that of molecule 2.
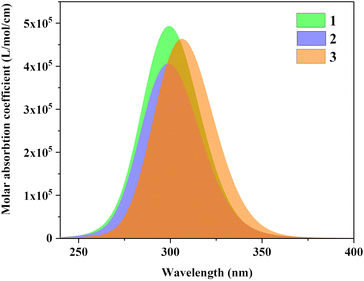 |
| | Fig. 5 UV-vis spectrum of three structures. | |
Fig. 6 describes the TDM diagram and electron–hole density diagram of the excited states that make a major contribution to the excitation process. From the TDM diagrams of the three structures, it can be seen that the transition density only exists at the diagonal, indicating that the excitation process is local excitation.
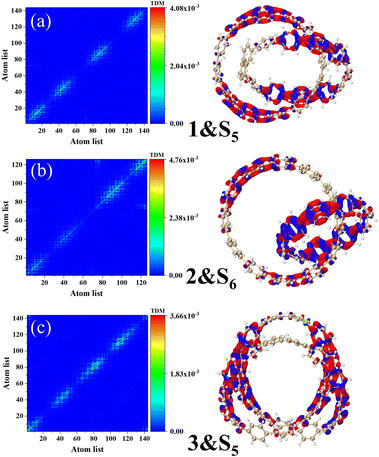 |
| | Fig. 6 Electron hole density diagrams and TDM for molecules 1&S5 (a), structures 2&S6 (b), and structures 3&S5 (c). The red and blue isosurfaces represent electrons and holes, respectively. | |
Fig. 7(a) shows the ECD spectrum of three structures, and the ordinate is the average molar absorptivity. Each of the three structures has a positive peak and a negative peak in the range of 250–400 nm. The positions of the wave peaks of 1 and 2 are very close, but the rotor strength of 1 is significantly stronger than that of 2 and 3. The peak of 3 is significantly red-shifted relative to 1 and 2. The ECDs of the fragments involved in molecule 1 and molecule 2 are shown in Fig. S2.† The calculation results show that the individual [12]CPP and [9]CPP fragments have almost no chirality. When the rings are nested to form a new structure, the van der Waals interaction will induce the generation of chirality. Combined with the negative chirality peak intensities of the three structures in Fig. 7(b), it shows that the chirality intensity can be adjusted by changing the size of the nested [n]CPPs.
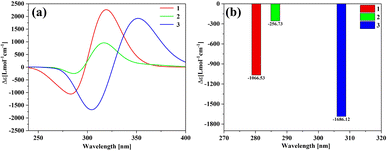 |
| | Fig. 7 The ECD spectrum (a) and negative chiral peak intensities (b) of the three structures. | |
The asymmetric electromagnetic interaction mechanism between molecules and light is the source of molecular ECD. The molecular polarization will affect the molecular chirality by affecting the TEDMs\TMDMs. In this section, we explain the formation mechanism of molecular chirality by visualizing TEDMs\TMDMs. The intensity of ECD can be expressed as:
| | |
I ∝ 〈φj|μe|φi〉〈φj|μm|φi〉B
| (13) |
where
μe is the transition electric dipole moment, and
μm is the transition magnetic dipole moment.
φ is the orbital wave function,
i and
j are the occupied orbital number.
B is the magnetic induction intensity. ECD is the asymmetric response of a molecule to electromagnetic interactions. The ECD intensity can be represented by the tensor product of TEDM and TMDM. TEDM can be expressed as:
| |
 | (14) |
where

is the transition density matrix.
Cμi and
Cνj are linear combination coefficients of molecular orbitals.
μ is the sequence number of the basis function
χμ. TMDM can be expressed as:
| |
 | (15) |
Next, the nature of the three structural chirality is understood by analyzing the densities of TEDMs\TMDMs in different directions. As shown in Fig. 8 in structure 1, the rotor strengths of S4 and S5 are positive, and S6 is negative. The TEDM densities of the three excited states decrease sequentially in the x, y, and z directions (Fig. 8 and S3a and b†). The TMDM density is relatively average in the three directions. But the TMDM in the z direction is obviously different from that in the x and y directions. The positive and negative regions of the TMDM in the z direction have been completely separated. This shows that the molecular polarization has a great influence on the TMDM of the system. Among them, the TEDM\TMDM distributions of S4 and S6 are similar, and the positive and negative TMDM densities in the z-direction are different. This indicates that the chiral effects of S4 and S6 are very similar in nature. In structure 2, S3 and S6 rotor strengths are positive, and S5 is negative. The TEDM densities of the three excited states also decrease sequentially in the x, y, and z directions (Fig. 8 and S4a and b†). The TEDM\TMDM densities of S3 and S5 are mainly distributed on [12]CPP, which also indicates that the chiral center of S3 is on [12]CPP. And S6 also has a larger TEDM\TMDM density on [9]CPP, such as TEDM in the z direction. This indicates that the chirality of S6 is jointly determined by [12]CPP and [9]CPP. In structure 3, the rotor strength of S1 is positive, and the rotor strengths of S2 and S5 are negative. The TEDM density of the three excited states decreases sequentially in the x, y, and z directions, while the TMDM density increases sequentially in the x, y and z directions (Fig. 8 and S5a and b†). But the regions of TEDM\TMDM density of the three excited states are different, which also reflects different chiral centers. In conclusion, molecular polarization has a strong regulatory effect on TMDM, thereby regulating molecular chirality. Finally, combined with TEDMs\TMDMs, the chiral mechanism of the three structures was quantitatively analyzed. The values of TEDM\TMDM of each excited state and the eigenvalues of the tensor product are shown in the Table 1. The results perfectly matched the intensity and orientation of the ECD spectrum. This also shows that the chiral mechanism can be confirmed by TEDM\TMDM analysis.
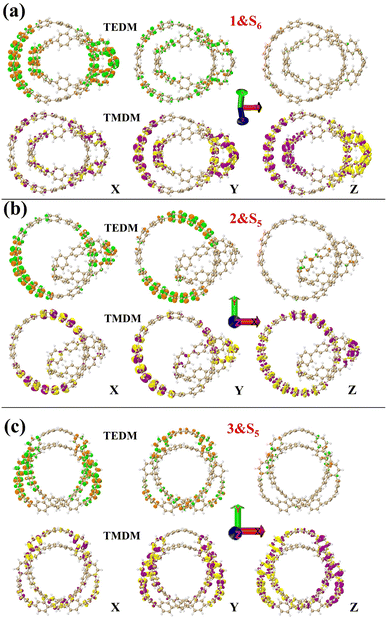 |
| | Fig. 8 1&S6 (a), 2&S5 (b) and 3&S5 (c) are TEDMs\TMDMs in different directions. The green (orange) isosurfaces represents the positive (negative) TEDM, and yellow (purple) isosurfaces represents the positive (negative) TMDM. | |
Table 1 The values of TEDMs\TMDMs and their eigenvalues of their tensor products
| |
1&S4 |
1&S5 |
1&S6 |
2&S3 |
2&S5 |
2&S6 |
3&S1 |
3&S2 |
3&S5 |
| TEDM |
X |
−0.0022 |
6.8277 |
0.0008 |
−0.1822 |
−3.1647 |
−5.4205 |
0.0000 |
0.0000 |
0.0000 |
| Y |
−0.0025 |
0.0007 |
−6.3978 |
−2.1148 |
3.9342 |
−2.9300 |
0.0000 |
−0.2927 |
−6.4194 |
| Z |
1.9716 |
0.0008 |
0.0000 |
1.3329 |
0.7161 |
−0.0234 |
−0.3794 |
0.0000 |
0.0000 |
| TMDM |
X |
0.0011 |
−1.0448 |
0.0002 |
0.9179 |
0.3895 |
−0.1221 |
0.0003 |
0.0000 |
0.0000 |
| Y |
−0.0065 |
−0.0048 |
−1.8996 |
−0.8864 |
1.4387 |
0.8092 |
0.0000 |
−7.2666 |
−0.2809 |
| Z |
−4.0603 |
−0.0027 |
−0.0086 |
−7.0465 |
3.5654 |
−0.4323 |
22.8003 |
0.0000 |
0.0000 |
| Eigenvalue |
8.0054 |
7.1342 |
−12.1536 |
7.6852 |
−6.9811 |
1.6991 |
8.6519 |
−2.1273 |
−1.8033 |
4 Conclusion
In this paper, three different structures of all-benzene catenane and trefoil knot are introduced, and the mechanism of vdW force-induced molecular electric polarization to modulate molecular chiral optics is studied in detail. Firstly, the weak interactions inter-and intra-fragment in the three systems were decomposed by energy. The results show that the weak interactions in the three structures are vdW interactions dominated by dispersive interactions. The vdW potentials of the three systems were visualized, and the binding sites of the systems and the external environment through dispersive interactions were identified. The degree of polarization of the first hyperpolarizability beta tensor of the three systems was visualized by unit sphere representation, and it was found that 1 and 3 with an overall β of zero have locally larger polarizabilities. In essence, the x component of molecule 1 is relatively large and the density is the highest. Therefore, the molecular chirality is caused by the anisotropy of molecular TEDMs\TMDMs, and these anisotropies are actually synchronized with the change of VDW interaction. Finally, combining the TDM and the electron hole density diagram, it can be seen that the excitation process is localized excitation. The anisotropy of TEDMs\TMDMs is consistent with the vdW force change, thus confirming that the vdW interaction is the main reason for the induced chirality inversion. Therefore, we can use specific modification methods in the design of molecules to precisely generate vdW forces to control the chiral optical properties of materials. This work will provide us with a strategy for the precise directional synthesis of chiral materials, and provide necessary guidance for the development and application of optoelectronic materials in special fields.
Conflicts of interest
There are no conflicts to declare.
Acknowledgements
This research was funded by the Natural Science Foundation of Liaoning Province (No. 2022-MS-363); the basic scientific research level project of the Education Department of Liaoning Province (No. LJKMZ20220735) and Research Foundation of Liaoning Petrochemical University (Grant No.: 2021XJJL-010).
Notes and references
- Y. Segawa, M. Kuwayama, Y. Hijikata, M. Fushimi, T. Nishihara, J. Pirillo, J. Shirasaki, N. Kubota and K. Itami, Science, 2019, 365, 272–276 CrossRef CAS PubMed.
- S. Mena-Hernando and E. Pérez, Chem. Soc. Rev., 2019, 48, 5016–5032 RSC.
- N. Pérez and J. Lewis, Org. Biomol. Chem., 2020, 18, 6757–6780 RSC.
- Y. Kim and J.-M. Nam, Nat. Synth., 2022, 1, 649–657 CrossRef.
- J. H. May, J. M. Van Raden, R. L. Maust, L. N. Zakharov and R. Jasti, Nat. Chem., 2023, 15, 170–176 CrossRef CAS PubMed.
- V. Aucagne, K. D. Hanni, D. A. Leigh, P. J. Lusby and D. B. Walker, J. Am. Chem. Soc., 2006, 128, 2186–2187 CrossRef CAS PubMed.
- M. Denis and S. M. Goldup, Nat. Rev. Chem., 2017, 1, 0061 CrossRef CAS.
- Q. Cheng, H. Pei, Q. Ma, R. Guo, N. Liu and Z. Mo, Chem. Eng. J., 2023, 452, 139499 CrossRef CAS.
- J. Millecam, T. van Bergen, S. Schauvliege, G. Antonissen, A. Martens, K. Chiers, R. Gehring, E. Gasthuys, J. Vande Walle, S. Croubels and M. Devreese, Front. pharmacol., 2019, 10, 505 CrossRef CAS PubMed.
- A. Mannschreck, R. Kiesswetter and E. von Angerer, J. Chem. Educ., 2007, 84, 2012 CrossRef CAS.
- E. Thall, J. Chem. Educ., 1996, 73, 481 CrossRef CAS.
- Z. Li, M. Mutlu and E. Ozbay, Int. J. Opt., 2013, 15, 3001 Search PubMed.
- Z. Wang, F. Cheng, T. Winsor and Y. Liu, Nanotechnology, 2016, 27, 412001 CrossRef PubMed.
- X. Mu, L. Hu, Y. Cheng, Y. Fang and M. Sun, Nanoscale, 2021, 13, 581–601 RSC.
- C. Tian, Y. Zhang, X. Mu, J. Quan and M. Sun, Spectrochim. Acta, Part A, 2020, 242, 118780 CrossRef CAS PubMed.
- C. Guo, C. Putzke, S. Konyzheva, X. Huang, M. Gutierrez-Amigo, I. Errea, D. Chen, M. G. Vergniory, C. Felser, M. H. Fischer, T. Neupert and P. J. W. Moll, Nature, 2022, 611, 461–466 CrossRef CAS PubMed.
- S. Zhu and M. Sun, Appl. Spectrosc. Rev., 2020, 1–35 Search PubMed.
- L. Sun, Y. Chen, M. Sun and Y. Zheng, J. Phys. Chem. C, 2022, 126, 12845–12859 CrossRef CAS.
- Y. Chen, Y. Cheng and M. Sun, Nanoscale, 2022, 14, 7269–7279 RSC.
- G. J. Simpson, ChemPhysChem, 2004, 5, 1301–1310 CrossRef CAS PubMed.
- M. J. Frisch and G. W. Trucks, et al., Gaussian 16 Revision A.03, 2016 Search PubMed.
- W. Kohn and L. J. Sham, Phys. Rev., 1965, 140, A1133 CrossRef.
- A. D. Becke, J. Chem. Phys, 1996, 104, 1040–1046 CrossRef CAS.
- A. D. Becke, Phys. Rev. A, 1988, 38, 3098–3100 CrossRef CAS PubMed.
- S. Grimme, Wiley Interdiscip. Rev. Comput. Mol. Sci., 2011, 1, 211–228 CrossRef CAS.
- T. Yanai, D. P. Tew and N. C. Handy, Chem. Phys. Lett., 2004, 393, 51–57 CrossRef CAS.
- Z. Liu, T. Lu and Q. Chen, Carbon, 2020, 165, 461–467 CrossRef CAS.
- X. Mu, X. Chen, J. Wang and M. Sun, J. Phys. Chem. A, 2019, 123, 8071–8081 CrossRef CAS PubMed.
- X. Mu and M. Sun, Mater. Today Phys., 2020, 14, 100222 CrossRef.
- T. Lu and Q. Chen, J. Mol. Model., 2020, 26, 315 CrossRef CAS PubMed.
- T. Lu and Q. Chen, J. Comput. Chem., 2022, 43, 539–555 CrossRef CAS PubMed.
- T. Lu and F. Chen, J. Comput. Chem., 2012, 33, 580–592 CrossRef CAS PubMed.
- W. Humphrey, A. Dalke and K. Schulten, J. Mol. Graph., 1996, 14, 33–38 CrossRef CAS PubMed.
- J. Wang, W. Bo, Y. Ding, X. Wang and X. Mu, Mater. Today Phys., 2020, 14, 100238 CrossRef.
- J. Song, Z. Zhang, N. Feng and J. Wang, Nanomaterials, 2021, 11, 2433 CrossRef CAS PubMed.
- J. Wang, X. Mu, L. Wang and M. Sun, Mater. Today Phys., 2019, 9, 100099 CrossRef.
- J. Wang, X. Mu, M. Sun and T. Mu, Appl. Mater. Today, 2019, 16, 1–20 CrossRef.
- T. Lu, Z. Liu and Q. Chen, Mater. Sci. Eng., B, 2021, 273, 115425 CrossRef CAS.
- A. Tuer, S. Krouglov, R. Cisek, D. Tokarz and V. Barzda, J. Comput. Chem., 2011, 32, 1128–1134 CrossRef CAS PubMed.
- Z. Liu, T. Lu, A. Yuan, X. Wang, Q. Chen and X. Yan, Chem.–Asian J., 2021, 16, 2267–2271 CrossRef CAS PubMed.
|
| This journal is © The Royal Society of Chemistry 2023 |
Click here to see how this site uses Cookies. View our privacy policy here.  Open Access Article
 *
*


 is the transition density matrix. Cμi and Cνj are linear combination coefficients of molecular orbitals. μ is the sequence number of the basis function χμ. TMDM can be expressed as:


