 Open Access Article
AuPt nanoalloy with dual functionalities for sensitive detection of HPV16 DNA†
Qingcai Yu,
Lisheng Qian,
Wanwei Qiu,
Yongmei Miao,
Jing Zhang and
Yan Wang *
*
School of Life and Health Science, Anhui Science and Technology University, Fengyang 233100, China. E-mail: yanwang0129@126.com
First published on 9th May 2023
Abstract
Human papillomavirus type 16 (HPV16), one of the high-risk types, is responsible for 53% of cervical cancers. The development of an early diagnostic approach with high sensitivity, low-cost, point-of-care testing (POCT) for HPV16 is urgent. In our work, a novel dual-functional AuPt nanoalloy-based lateral flow nucleic acid biosensor (AuPt nanoalloy-based LFNAB) was established with excellent sensitivity for detecting HPV16 DNA for the first time. The AuPt nanoalloy particles were prepared by a one-step reduction method, which was simple, rapid, and green. The AuPt nanoalloy particles retained the performance of initial Au nanoparticles owing to the catalytic activity enabled by Pt. Such dual-functionalities offered two kinds of detection alternatives (i.e., normal mode and amplification mode, respectively). The former is produced just by the black color from the AuPt nanoalloy material itself, and the latter is more color sensitive from its superior catalytic activity. The optimized AuPt nanoalloy-based LFNAB exhibited satisfactory quantitative ability in detecting the target HPV16 DNA in the range of 5–200 pM with a LOD of 0.8 pM at the “amplification mode”. The proposed dual-functional AuPt nanoalloy-based LFNAB displayed great potential and promising opportunity in POCT clinical diagnostics.
Introduction
Cervical cancer is one of the most common malignant tumors in women around the world.1 According to the 2018 Global Cancer Statistics Report, the number of cervical cancer patients is continuously increasing at the level of about 570![[thin space (1/6-em)]](https://www.rsc.org/images/entities/char_2009.gif) 000 in women and causes 311
000 in women and causes 311![[thin space (1/6-em)]](https://www.rsc.org/images/entities/char_2009.gif) 000 deaths per year.2 It is currently recognized that human papillomavirus (HPV) is the main inducement to cause cervical cancer. To date, HPV16 has been widely considered one of the high-risk types, contributing to about 53% of cervical cancers.3,4 However, persistent infection with high-risk HPV would increase the risk of cervical cancer.5–7 Generally, the associated symptoms of cervical cancer are not emerging until the advanced stage, while cervical cancer is well-treated at the early stage. Therefore, early detection for HPV diagnosis is a real challenge. Thus, developing a new diagnostic approach with high sensitivity, low-cost, and rapid onsite test for the early detection of HPV is urgently needed.
000 deaths per year.2 It is currently recognized that human papillomavirus (HPV) is the main inducement to cause cervical cancer. To date, HPV16 has been widely considered one of the high-risk types, contributing to about 53% of cervical cancers.3,4 However, persistent infection with high-risk HPV would increase the risk of cervical cancer.5–7 Generally, the associated symptoms of cervical cancer are not emerging until the advanced stage, while cervical cancer is well-treated at the early stage. Therefore, early detection for HPV diagnosis is a real challenge. Thus, developing a new diagnostic approach with high sensitivity, low-cost, and rapid onsite test for the early detection of HPV is urgently needed.
Virtually, various molecular detection methods, such as Southern transfer hybridization (STH), hybrid capture (HC2) assays, and polymerase chain reaction (PCR)8 have emerged to detect HPV and cervical cancer in recent years. Because of its fine sensitivity and selectivity, real-time PCR has been applied in the clinical detection field. Unfortunately, these methods always suffer from complex operations and are instrumentation assisted and particularly cannot meet point-of-care testing (POCT). Thus, the existing disadvantages would limit the actual applications. Currently, methods belonging to POCT, such as the electrochemical DNA sensor,9 photothermal biosensor,10 surface-enhanced Raman scattering (SERS) sensor11 and interdigitated electrode (IDE) sensor,12 are widely studied. Lately, lateral flow biosensor (LFB) has attracted remarkable interest owing to its ascendancy of low cost, convenience, simplicity, flexibility, and exquisite sensitivity. It has been considered the most suitable POCT method for rapid screening and disease diagnosis. Particularly, the outstanding appliances of LFB in the field of detecting proteins, cancer biomarkers, and nucleic acid have displayed outstanding performance. Generally, the FLB belongs to a prefabricated strip combined with beacon nanomaterials as the signal carrier, which could influence the sensitivity and limit of detection. For example, Yang13 established a CuO-based lateral flow strip biosensor (CuO-based LFSB) for detecting HPV16 with a limit of detection of 1.0 nM. In light of these existing issues, LFB combining a new beacon nanomaterial was exploited for the HPV16 detection in our work.
In recent decades, gold-based nanomaterials, including gold nanoparticles (AuNP),14,15 gold nanorods16 and gold-platinum nanoflowers (AuPt NF),17,18 have been widely utilized in nucleic acid and protein biosensors. Among these nanomaterials, AuNP has been well-received by researchers in LFB because of its unique properties. However, the AuNP-based LFB suffers from low sensitivity due to the limited surface area of Au nanoparticles. In our previous work,17 we designed an AuPt NF as the colored label and as an enzyme mimic for detecting target rabbit IgG. In terms of biosensors, AuPt NF can be applied as a dual label for LFB to enhance signal amplification due to the outstanding catalytic ability of Pt nanomaterial, which is considered a nano-enzyme. In this work, a new lateral flow nucleic acid biosensor (LFNAB) for simple, time-saving, highly sensitive, and rapid detection of HPV16 was designed by combining AuPt nanoalloy for the first time. The black color of AuPt nanoalloy was utilized as a colored label to enhance the intensity of the test line. The well-dispersed AuPt nanoalloy particles were prepared by low energy consumption and a simple process under room temperature. Then, the prepared AuPt nanoalloy particles were coupled with capture DNA to form AuPt nanoalloy detection probes (AuPt-Det-DNA). In the assay process, under the capillary force, the capture probes could gradually transfer onto the absorbent pad with the target DNA of HPV16. Sandwich structure would be formed on the test line of LFNAB, and produce a characteristic black band in the presence of target analyte. The detection of target DNA can be realized only by the naked eye without using any tool. 20 pM HPV16 could be detected by the AuPt nanoalloy-based LFNAB in vision. Herein, it is worth mentioning that a high catalytic activity was realized with the Au![[thin space (1/6-em)]](https://www.rsc.org/images/entities/char_2009.gif) :
:![[thin space (1/6-em)]](https://www.rsc.org/images/entities/char_2009.gif) Pt molar ratio of 1
Pt molar ratio of 1![[thin space (1/6-em)]](https://www.rsc.org/images/entities/char_2009.gif) :
:![[thin space (1/6-em)]](https://www.rsc.org/images/entities/char_2009.gif) 3. Interestingly, after catalyzing 3-amino-9-ethylcarbazole (AEC), 5 pM could be further detected. The detection limit can be reached as 0.8 pM for HPV16 with a linear range from 5 pM to 200 pM. The promising results of AuPt nanoalloy-based LFNAB provide new insight into the early detection of HPV.
3. Interestingly, after catalyzing 3-amino-9-ethylcarbazole (AEC), 5 pM could be further detected. The detection limit can be reached as 0.8 pM for HPV16 with a linear range from 5 pM to 200 pM. The promising results of AuPt nanoalloy-based LFNAB provide new insight into the early detection of HPV.
Experimental
Apparatus
The morphology of AuPt nanoalloy was characterized by transmission electron microscope JEM-2100F (JEOL, Japan). X-Ray diffraction of AuPt nanoalloy was analyzed by X-ray powder diffractometer XD-3 (PERSEE, China). Inductively coupled plasma optical emission spectrometry (ICP-OES) analysis was performed at ICP-OES 720ES (Agilent, American). Pictures were captured by camera 1000D EOS (Canon, Japan). Strips were produced by dispensing platform XYZ3010 and programmable strip cutter CM3010 (Jiening, China).Reagents
Trichlorogold hydrate hydrochloride (HAuCl4·4H2O), potassium hexachloroplatinate (K2PtCl4), and cetyltrimethylammonium bromide (CTAB) were purchased from J&K Co. Ltd (Shanghai, China). Sodium borohydride (NaBH4), 20× SSC buffer, 3-amino-9-ethylcarbazole (AEC), H2O2, dATP, and oligonucleotides were supplied by Sangon Biotech. Co. Ltd (Shanghai, China). The sequence of oligonucleotides is given in Electronic Support Materials (ESM Table S1†). Ultrapure water (18.2 MΩ cm) was employed in this work for the solution preparation.Synthesis of AuPt nanoalloy
The synthesis of AuPt nanoalloy was performed referring to previous reports with minor modifications.19,20 The detailed process is described in ESI Materials.†Preparation of AuPt-Det-DNA conjugates
In a typical procedure, sulfhydryl modified DNA was connected to AuPt nanoalloy through the Au–S bond and Pt–S bond. 5 μL of CTAB (2 M) was added to 1.5 mL of AuPt nanoalloy colloidal liquid, centrifuged at 10![[thin space (1/6-em)]](https://www.rsc.org/images/entities/char_2009.gif) 000 rpm to remove the supernatant, and the precipitate was re-dispersed in 200 μL of water. 10 μL of dATP was added to the resulting dispersion with shaking at room temperature for 20 min. Then, 3 μL of 1% SDS was added to the mixture and incubated for 10 min. Then, 10 μL of 2 M NaCl solution and 20 μL of sulfhydryl modified DNA were directly added to the above resulting mixture. Finally, the as-prepared AuPt-Det-DNA mixture was allowed to stand at 60 °C for 3 h, centrifuged at 10
000 rpm to remove the supernatant, and the precipitate was re-dispersed in 200 μL of water. 10 μL of dATP was added to the resulting dispersion with shaking at room temperature for 20 min. Then, 3 μL of 1% SDS was added to the mixture and incubated for 10 min. Then, 10 μL of 2 M NaCl solution and 20 μL of sulfhydryl modified DNA were directly added to the above resulting mixture. Finally, the as-prepared AuPt-Det-DNA mixture was allowed to stand at 60 °C for 3 h, centrifuged at 10![[thin space (1/6-em)]](https://www.rsc.org/images/entities/char_2009.gif) 000 rpm to remove the supernatant, and washed repetitively with deionized water. The precipitate was re-dispersed in 200 μL of buffer (Na3PO4·12H2O, 5% BSA, 10% sucrose, and 0.25% Tween-20). The obtained AuPt-Det-DNA conjugates solution was stored at 4 °C.
000 rpm to remove the supernatant, and washed repetitively with deionized water. The precipitate was re-dispersed in 200 μL of buffer (Na3PO4·12H2O, 5% BSA, 10% sucrose, and 0.25% Tween-20). The obtained AuPt-Det-DNA conjugates solution was stored at 4 °C.
Fabrication of AuPt nanoalloy-based LFNAB sensor
In order to fix the capture probes and control probes on the nitrocellulose (NC) membrane, firstly, streptavidin is employed to react with corresponding biotinylated DNA probes, respectively. The same procedure was conducted to modify both probes with streptavidin. 100 μL of 2.0 mg mL−1 streptavidin solution was added to 200 μL of 0.25 mM streptavidin-modified capture probe, and the mixture was shaken for 1 h at 25 °C. The resulting mixture was transferred to a dialysis tube (cutoff 30![[thin space (1/6-em)]](https://www.rsc.org/images/entities/char_2009.gif) 000, Millipore) and centrifuged under 7000 rpm for 15 min. The intercepted product was rinsed twice with 500 μL PBS to remove the excess probe. Finally, the remaining mixture was diluted with PBS to 500 μL.
000, Millipore) and centrifuged under 7000 rpm for 15 min. The intercepted product was rinsed twice with 500 μL PBS to remove the excess probe. Finally, the remaining mixture was diluted with PBS to 500 μL.
The AuPt nanoalloy-based LFNAB sensor consisting of five parts (sample pad, conjugate pad, PVC backing, NC membrane, and absorbent pad) was prepared according to our previous reports.16,21 The sample pad was soaked in the buffer (0.05 M Tris–HCl, 0.15 mM NaCl, 2.5% Tween-20, and 0.25% Triton X-100) for 2 h, then dried at 37 °C for 8 h and stored at 4 °C for use. Meanwhile, streptavidin-modified capture probe and streptavidin-modified control probe were sprayed onto the NC membrane to form the test line (T-line) and control line (C-line), respectively. Then, the above resulting NC membrane was dried at 37 °C for 2 h. The above components (i.e., sample pad, conjugate pad, NC membrane and absorbent pad) were pasted on PVC backing in order with an overlap of 2 mm between each part. Then, the strip was cut into 3.5 mm widths using a paper cutter and stored at 4 °C.
Assay procedure
4 μL of AuPt-Det-DNA conjugates was dispensed onto a conjugate pad, followed by immersing the end of the sample pad into a running buffer (1/4 SSC) containing different concentrations of the target HPV16 DNA. The mixture solution migrated toward the absorbent pad. After 15 min, the formation of the C-line and T-line was observed with the naked eye, and the results were recorded by the camera. Then, the mixture of 9 μL AEC solution (1.2 mM diluted with 0.05 M sodium acetate buffer) and 1 μL H2O2 (30%) were added to the T-line, and the results were recorded 5 min later. For quantitative analysis, the gray value of the C-line and T-line was calculated by the software of ImageJ, respectively. The standard curve can be utilized to calculate the sample concentration.Results and discussion
The principle of AuPt nanoalloy-based LFNAB
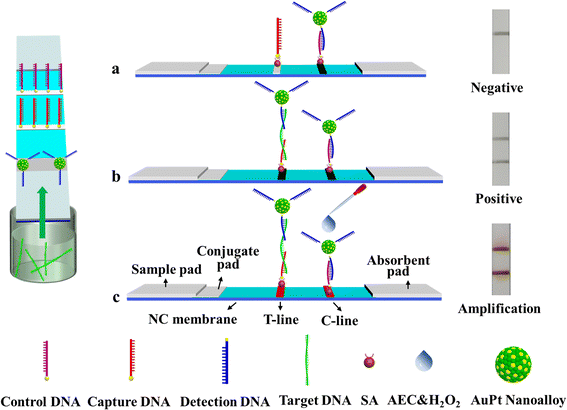
An amplified LFNAB was developed by coupling DNA sandwich detection with the high catalytic activity of AuPt nanoalloy. Fig. 1b illustrates the principle for the AuPt nanoalloy-based LFNAB method. The capture DNA probe was fixed on the T-line of the LFNAB, and the detection DNA probe was conjugated with AuPt nanoalloy, followed by dispensing on the conjugate pad. In general, the sample system containing the target DNA with desired concentrations was dripped onto the sample pad. Due to the inherent capillary action, the longitudinal flow was launched. When the target DNA conjugated with signal probe (namely, AuPt-Det-DNA conjugate) and reached the test line, a sandwich-type complex with the immobilized capture probe (namely, streptavidin-modified capture DNA) was formed under DNA hybridization reaction. Meanwhile, a visible black band appeared. As the solution migrated continually, the excess of AuPt-Det-DNA conjugate was directly trapped by the control probe (namely, streptavidin-modified control DNA) on the control line to form a black band, which was utilized to verify whether the LFNAB was working correctly. Certainly, AuPt-Det-DNA conjugate flowed past the test line without the target DNA and was only trapped by the control probe on the control line (Fig. 1a). Amplification mechanism is shown in Fig. 1c. Herein, the AuPt nanoalloy can amplify the signal by catalyzing the developer. With the addition of 3-amino-9-ethylcarbazole and H2O2 (i.e., AEC/H2O2), a catalytic reaction occurred to make the captured probe more ‘detectable’. The trace amount of AuPt nanoalloy on the T-line could catalyze the hydrogen peroxide and further oxidize the AEC to produce a large amount of red insolubles,22 thereby amplifying the strength of the T-line. As a result, a much lower concentration of the target DNA could be detected without sophisticated instrumentation.Synthesis and characterization of AuPt nanoalloy
In a typical preparation of AuPt nanoalloy particles, a certain percentage of HAuCl4 as a precursor to Au and K2PtCl4 as a precursor to Pt was dissolved in water along with tri-sodium citrate as a surface stabilizer and NaBH4 as a reductant. By changing the molar ratio of HAuCl4 and K2PtCl4, AuPt nanoalloy particles with different ratios (Au![[thin space (1/6-em)]](https://www.rsc.org/images/entities/char_2009.gif) :
:![[thin space (1/6-em)]](https://www.rsc.org/images/entities/char_2009.gif) Pt = 2
Pt = 2![[thin space (1/6-em)]](https://www.rsc.org/images/entities/char_2009.gif) :
:![[thin space (1/6-em)]](https://www.rsc.org/images/entities/char_2009.gif) 1, 1
1, 1![[thin space (1/6-em)]](https://www.rsc.org/images/entities/char_2009.gif) :
:![[thin space (1/6-em)]](https://www.rsc.org/images/entities/char_2009.gif) 1, 1
1, 1![[thin space (1/6-em)]](https://www.rsc.org/images/entities/char_2009.gif) :
:![[thin space (1/6-em)]](https://www.rsc.org/images/entities/char_2009.gif) 2, 1
2, 1![[thin space (1/6-em)]](https://www.rsc.org/images/entities/char_2009.gif) :
:![[thin space (1/6-em)]](https://www.rsc.org/images/entities/char_2009.gif) 3, 1
3, 1![[thin space (1/6-em)]](https://www.rsc.org/images/entities/char_2009.gif) :
:![[thin space (1/6-em)]](https://www.rsc.org/images/entities/char_2009.gif) 4) and platinum nanoparticles were prepared. UV-vis spectra of AuPt nanoalloys with different proportions of Au and Pt are shown in ESM Fig. S1.† It was found that the characteristic absorption peak of Au nanoparticles (520 nm) decreases with the increase in the platinum ratio. Under the same catalytic conditions for AEC, the deepest red color was obtained by the alloy with a gold–platinum ratio of 1
4) and platinum nanoparticles were prepared. UV-vis spectra of AuPt nanoalloys with different proportions of Au and Pt are shown in ESM Fig. S1.† It was found that the characteristic absorption peak of Au nanoparticles (520 nm) decreases with the increase in the platinum ratio. Under the same catalytic conditions for AEC, the deepest red color was obtained by the alloy with a gold–platinum ratio of 1![[thin space (1/6-em)]](https://www.rsc.org/images/entities/char_2009.gif) :
:![[thin space (1/6-em)]](https://www.rsc.org/images/entities/char_2009.gif) 3 (see ESM Fig. S2†). The regularity of catalytic activity is consistent with the reference reported.23 The AuPt nanoalloy with the highest catalytic activity to AEC is conducive to the rapid appearance red band in the lateral strip. So, Au1Pt3 was used for labels in further assays. Moreover, the ICP-OES measured result suggested that the molar ratio between Au and Pt is 1
3 (see ESM Fig. S2†). The regularity of catalytic activity is consistent with the reference reported.23 The AuPt nanoalloy with the highest catalytic activity to AEC is conducive to the rapid appearance red band in the lateral strip. So, Au1Pt3 was used for labels in further assays. Moreover, the ICP-OES measured result suggested that the molar ratio between Au and Pt is 1![[thin space (1/6-em)]](https://www.rsc.org/images/entities/char_2009.gif) :
:![[thin space (1/6-em)]](https://www.rsc.org/images/entities/char_2009.gif) 2.9.
2.9.
The prepared AuPt nanoalloy particles displayed a uniform spherical shape, as shown by TEM in Fig. 2a. The average diameter was estimated to be around 3.9 nm, calculated from 100 random particles. HRTEM image revealed the lattice plane of AuPt nanoalloy, as shown in Fig. 2b. It showed that AuPt nanoalloy particles have obvious crystalline structures with well-defined lattice planes. Moreover, the calculated lattice spacing of AuPt nanoalloy (111) was 0.231 nm, which is located between that of the pure Pt plane (0.224 nm)24 and Au plane (0.235 nm).25 This intermediate lattice spacing indicated the successful formation of an AuPt nanoalloy structure.26
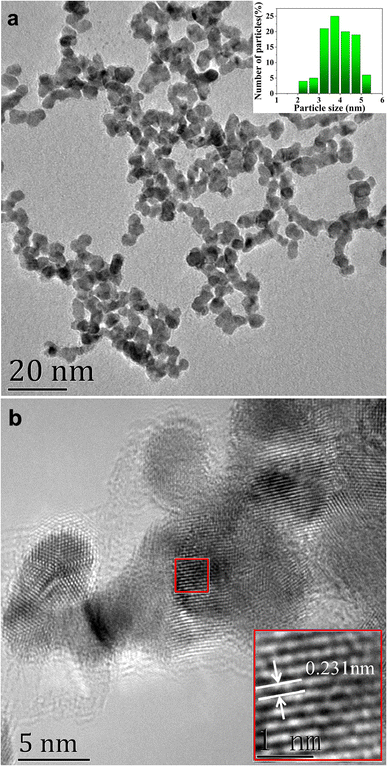 | ||
| Fig. 2 (a) TEM image of AuPt nanoalloy, inset shows the particle size and size distribution. (b) HRTEM image of AuPt nanoalloy. | ||
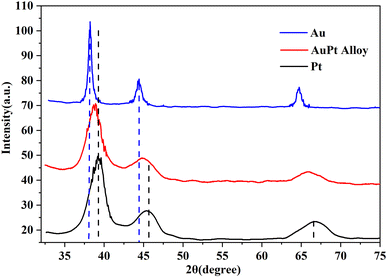
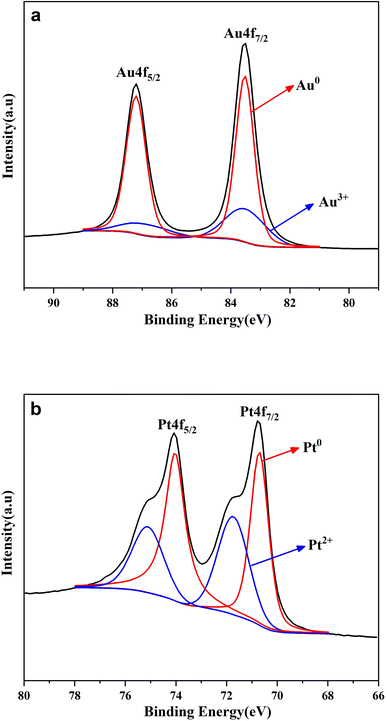
As is well-known, the lattice of two metals would be changed after the formation of alloy.27 Their diffraction patterns should be changed correspondingly. Therefore, XRD spectroscopy was further conducted to verify the effective formation of the AuPt nanoalloy, and the result is illustrated in Fig. 3. The diffraction peaks of AuPt nanoalloy, pure Au NPs, and pure Pt NPs manifested that all of them were face-centered cubic lattices. According to Fig. 3, the peaks at 2θ values of 38.7°, 44.8°, and 65.8° of AuPt nanoalloy were between the 2θ peaks of pure monometallic Au and Pt NPs. The appearance is consistent with a previous report.28 The high-resolution XPS analysis of Au 4f and Pt 4f regions in AuPt nanoalloy is displayed in Fig. 4. The results indicated the existence of two chemical states for Au and Pt, respectively. From their peak intensity, Au0 and Pt0 were the dominant species, respectively.
Optimization of detection conditions
To achieve the sensitive detection of HPV16 via the AuPt nanoalloy-based LFNAB, experimental parameters were optimized systematically. Variables of (i) the sprayed times of streptavidin-modified capture DNA probe on the T-line, (ii) the consumed amount of sulfhydryl-modified detection DNA for the preparation of signal Det-DNA conjugates dispensing on the conjugate pad, and (iii) the concentration of running buffer were considered in our optimization process. The ratio of the gray value of the T-line and C-line is used as a parameter to estimate the performance of the analysis. The best assay conditions were obtained as follows: (i) three sprayed times of the capture DNA probe, (ii) 10.0 μL of 0.5 OD per mL detection DNA for the preparation of AuPt-Det-DNA conjugate probe, (iii) 6.0 μL of AuPt-Det-DNA conjugate sprayed on the conjugate pad, and (iv) 1/4 SSC running buffer. Each experimental condition is discussed in detail and presented in the ESI Materials.†Sensitivity and specificity for detecting HPV16 DNA
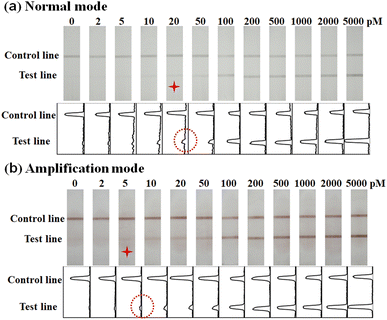
The performance of AuPt nanoalloy-based LFNAB for HPV16 detection was tested under optimized experimental conditions. Target DNA involving various concentrations was inspected in LFNAB assay, and a digital camera was adopted to record the monitored results after 15 min. Then, the results were subjected to quantification by the software of ImageJ. It is worth pointing out that the naked eye detection limit was 20 pM of HPV 16 in the “normal mode” (Fig. 5a). This observed result is even lower than the detection limit of the traditional colloidal gold testing nucleic acid (0.5 nM).14 This facile detection limit might be ascribed to the CTAB improvement in the dispersion stability of gold-platinum nanoalloy particles. The result indicates that AuPt nanoalloy can be used in the same mode as the customary AuNP without affecting performance. For AuPt nanoalloy-based LFNAB at the “amplification mode”, the procedure was also maintained the same except for an extra heightened treatment of AEC/H2O2. In the “amplification mode” AuPt nanoalloy-based LFNAB, the red line could be recognized applied with HPV16 DNA standard of concentration as low as 5 pM (Fig. 5b). This signal enhancement could be ascribed to the fact that AuPt nanoalloy particles possess superior catalytic activity. Fig. 6a compared the T-line intensity at the two LFNAB against the HPV16 DNA concentration. The ratio of T/C calculated with gray values of T-line and C-line measured through software was used to quantify the target DNA, which can effectively avoid non-specific signals.29 A linear relationship was observed for the “amplification mode” AuPt nanoalloy-based LFNAB in the range of 5–200 pM with the equation y = 0.00547x + 0.054 (R2 = 0.980) (Fig. 6b). The LOD was calculated to be 0.8 pM for HPV16 by 3SD blank/slope. It was worth noting that this detection limit was even lower compared with other analysis platforms for detecting HPV16 DNA (Table 1). Accordingly, AuPt nanoalloy-based LFNAB is suitable for application in a biosensor, expecting to provide reliable and sensitive tests. In addition, we also used Au nanoparticles with a diameter of 4 nm and previously reported AuPt NFs as labels to compare the performance for detecting HPV16 DNA. The results are shown in ESM Fig. S4 and S5,† respectively. The minimum detection concentration visible to the naked eye for both was 50 pM.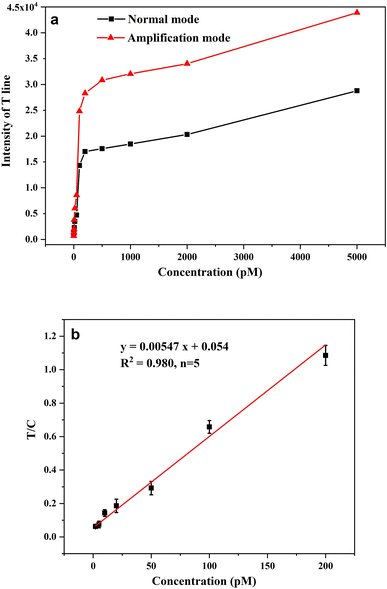 | ||
| Fig. 6 (a) Comparison of T-line intensity in normal mode and amplification mode with different target concentrations; (b) linear range of AuPt nanoalloy-based LFNAB at amplification mode. | ||
| Reference | Sensing system | Detection Limit |
|---|---|---|
| 30 | Zn-doped MoS2 QDs/DNA walker cycle amplification/electrochemiluminescence sensor | 30 pM |
| 31 | CRISPR-Cas12a (cpf1)/electrochemical biosensor | 0.5 nM |
| 32 | Gold magnetic particles/whole serum/fluorescence detection | 1.23 nM |
| 9 | Gold nanoparticle/screen-prints | 150 pM |
| Carbon electrode/electrochemical DNA sensors | ||
| 13 | CuO nanoparticles/lateral flow strip biosensor | 1.0 nM |
| 33 | Anthraquinone/screen-printed carbon electrode/electrochemical biosensor | 4 nM |
| 34 | Quantum dots/fluorescent and colorimetric assays | 1.03 nM |
| 35 | Anthraquinone/paper-based electrochemical biosensor | 2.3 nM |
| This work | AuPt nanoalloy/lateral flow nucleic acid biosensor | 0.8 pM |
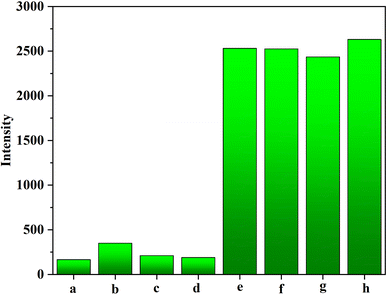
Interfering tests between HPV16 DNA and three non-complementary DNA (i.e., HPV11, HPV18, and HPV31) were subject to estimate the selectivity of AuPt nanoalloy-based LFNAB. The particular sequences of three non-complementary DNA (NC-DNA) are shown in Table S1.† In light of the obtained histogram in Fig. 7, the responses of three NC-DNA were feeble as the blank sample. The change of signal of target HPV16 was negligible after blending with 200 nM of the above-mentioned three non-complementary DNA, respectively. The result indicates that the influence of NC-DNA is extremely miniscule.
Determination of HPV16 DNA in biological matrix
To further test the potential clinical application of AuPt nanoalloy-based LFNAB, spiked recovery experiments were carried out to evaluate the practicability and reliability of the suggested scheme by detecting HPV16 in a biological matrix. Herein, 10% diluted human serum samples were spiked with HPV16 DNA at concentrations of 20–2000 pM. As shown in Table 2, the recoveries ranged from 90.0 to 105.1%. The determination results suggested the good accuracy, feasibility and distinct anti-interference ability of the AuPt nanoalloy-based LFNAB in analyzing DNA in the biological matrix environment.| Sample number | Spiked concentration (pM) | Measured concentration (pM) | Recovery (%) | Relative standard deviation (%, n = 6) |
|---|---|---|---|---|
| 1 | 20 | 18 | 90.0 | 5.6 |
| 2 | 200 | 187 | 93.1 | 6.3 |
| 3 | 2000 | 2102 | 105.1 | 5.4 |
Conclusions
In summary, a dual-functional AuPt nanoalloy-based LFNAB with substantially enhanced detection sensitivity for detecting HPV16 DNA was successfully proposed for the first time. A fine water-dispersible AuPt nanoalloy was prepared by a one-step reduction method in aqueous media. The synthetic procedure was simple, rapid, and green. The AuPt nanoalloy not only is a colored label but also possesses a potential amplified effect ascribing to its superior catalytic activity. In this work, the AuPt nanoalloy-based LFNAB exhibited satisfactory qualitative and quantitative ability in detecting the target HPV16 DNA with a LOD of 0.8 pM at the “amplification mode”. Such AuPt nanoalloy-based LFNAB was successfully employed for detecting HPV16 having excellent anti-interference capability in biological matrix. The proposed detection method takes only 20 min without intricate operation procedures, costly equipment, or highly qualified personnel. These merits endow the AuPt nanoalloy-based LFNAB with promising opportunities and potential to be applied as a point-of-care tool in clinical diagnostics.Conflicts of interest
There are no conflicts to declare.Acknowledgements
This research was supported by the Natural Science Research Foundation of the University in Anhui Province (Grant No. KJ2021A0884) and the Introducing Talents Project of Anhui Science and Technology University (No. SKYJ201601, SKYJ201903). The part work at conceptualization and project administration was also supported by Pf. Guodong Liu.References
- J. J. Trausch, M. Shank-Retzlaff and T. Verch, Anal. Chem., 2017, 89, 3554–3561 CrossRef CAS PubMed.
- R. L. Siegel, K. D. Miller and A. Jemal, CA Cancer J. Clin., 2020, 70, 7–30 CrossRef PubMed.
- X. Q. Ma, T. Lakshmipriya and S. C. B. Gopinath, J. Anal. Methods Chem., 2019, 2019, 9 Search PubMed.
- W. Yuan, S. Li, J. Jia, L. Wang, Y. Huang, M. Wang, F. Xie, J. Li and Y. Hao, J. Cancer Res. Clin. Oncol., 2022 DOI:10.1007/s00432-022-04322-5.
- Y. Yuan, Y. Y. Ma, L. Luo, Q. Wang, J. Huang, J. B. Liu, X. H. Yang and K. M. Wang, Microchim. Acta, 2019, 186, 6 CrossRef PubMed.
- A. H. Lovestad, A. Repesa, J. M. Costanzi, S. Lagstrom, I. K. Christiansen, T. B. Rounge and O. H. Ambur, Tumour Virus Res., 2022, 14, 200247 CrossRef PubMed.
- Z. Chen, H. Lin, J. Zheng, L. Cai, Z. Chen, J. Li and L. Yu, BMC Infect. Dis., 2022, 22, 893 CrossRef PubMed.
- A. Zaravinos, I. N. Mammas, G. Sourvinos and D. A. Spandidos, Int. J. Biol. Markers, 2009, 24, 215–222 CrossRef CAS PubMed.
- S. Jampasa, W. Siangproh, R. Laocharoensuk, P. Yanatatsaneejit, T. Vilaivan and O. Chailapakul, Sens. Actuators, B, 2018, 265, 514–521 CrossRef CAS.
- B. Yan, M. Li, F. Luo, X. Jin, B. Qiu and Z. Lin, Mikrochim. Acta, 2022, 189, 437 CrossRef CAS PubMed.
- C. F. Ning, Y. F. Tian, W. Zhou, B. C. Yin and B. C. Ye, Analyst, 2019, 144, 2929–2935 RSC.
- N. A. Parmin, U. Hashim, S. C. B. Gopinath, S. Nadzirah, Z. Rejali, A. Afzan, M. N. A. Uda, V. C. Hong and R. Rajapaksha, Microchim. Acta, 2019, 186, 9 CrossRef PubMed.
- Z. Yang, C. Yi, S. J. Lv, Y. H. Sheng, W. Wen, X. H. Zhang and S. F. Wang, Sens. Actuators, B, 2019, 285, 326–332 CrossRef CAS.
- X. Mao, Y. Ma, A. Zhang, L. Zhang, L. Zeng and G. Liu, Anal. Chem., 2009, 81, 1660–1668 CrossRef CAS PubMed.
- X. Gao, H. Xu, M. Baloda, A. S. Gurung, L. P. Xu, T. Wang, X. Zhang and G. Liu, Biosens. Bioelectron., 2014, 54, 578–584 CrossRef CAS PubMed.
- Q. Yu, J. Zhang, W. Qiu, K. Li, L. Qian, X. Zhang and G. Liu, Mikrochim. Acta, 2021, 188, 133 CrossRef CAS PubMed.
- J. Zhang, Q. Yu, W. Qiu, K. Li, L. Qian, X. Zhang and G. Liu, Mikrochim. Acta, 2019, 186, 357 CrossRef PubMed.
- Q. Fu, Z. Wu, J. Li, Z. Wu, H. Zhong, Q. Yang, Q. Liu, Z. Liu, L. Sheng, M. Xu, T. Li, Z. Yin and Y. Wu, J. Nanobiotechnol., 2019, 17, 67 CrossRef PubMed.
- E. R. Essinger-Hileman, D. DeCicco, J. F. Bondi and R. E. Schaak, J. Mater. Chem., 2011, 21, 11599–11604 RSC.
- N. Ilayaraja, N. Prabu, N. Lakshminarasimhan, P. Murugan and D. Jeyakumar, J. Mater. Chem. A, 2013, 1 Search PubMed.
- C. Parolo, A. de la Escosura-Muñiz and A. Merkoçi, Biosens. Bioelectron., 2013, 40, 412–416 CrossRef CAS PubMed.
- J. Zhang, L. Tang, Q. Yu, W. Qiu, K. Li, L. Cheng, T. Zhang, L. Qian, X. Zhang and G. Liu, Sens. Actuators, B, 2021, 344 CAS.
- C. Guo, M. Zhang, H. Tian, T. Wang and J. Hu, J. Electrochem. Soc., 2013, 160, F1187–F1191 CrossRef CAS.
- H. Huang, H. Chen, D. Sun and X. Wang, J. Power Sources, 2012, 204, 46–52 CrossRef CAS.
- P. Wang, Z.-G. Liu, X. Chen, F.-L. Meng, J.-H. Liu and X.-J. Huang, J. Mater. Chem. A, 2013, 1 Search PubMed.
- K. Bhunia, M. Chandra, S. Khilari and D. Pradhan, ACS Appl. Mater. Interfaces, 2019, 11, 478–488 CrossRef CAS PubMed.
- Q.-L. Zhang, K.-J. Ju, X.-Y. Huang, A.-J. Wang, J. Wei and J.-J. Feng, Electrochim. Acta, 2015, 182, 305–311 CrossRef CAS.
- L. Lu, L. Peng, L. Li, J. Li, X. Huang and Z. Wei, J. Energy Chem., 2020, 40, 52–56 CrossRef.
- L. Hao, J. Chen, X. Chen, T. Ma, X. Cai, H. Duan, Y. Leng, X. Huang and Y. Xiong, Food Chem., 2021, 336, 127710 CrossRef CAS PubMed.
- Y. Nie, X. Zhang, Q. Zhang, Z. Liang, Q. Ma and X. Su, Biosens. Bioelectron., 2020, 160, 112217 CrossRef CAS PubMed.
- Y. Dai, R. A. Somoza, L. Wang, J. F. Welter, Y. Li, A. I. Caplan and C. C. Liu, Angew. Chem., Int. Ed. Engl., 2019, 58, 17399–17405 CrossRef CAS PubMed.
- L. Chen, M. Liu, Y. Tang, C. Chen, X. Wang and Z. Hu, ACS Appl. Mater. Interfaces, 2019, 11, 18637–18644 CrossRef CAS PubMed.
- S. Jampasa, W. Wonsawat, N. Rodthongkum, W. Siangproh, P. Yanatatsaneejit, T. Vilaivan and O. Chailapakul, Biosens. Bioelectron., 2014, 54, 428–434 CrossRef CAS PubMed.
- P. Teengam, W. Siangproh, A. Tuantranont, T. Vilaivan, O. Chailapakul and C. S. Henry, Anal. Chem., 2017, 89, 5428–5435 CrossRef CAS PubMed.
- P. Teengam, W. Siangproh, A. Tuantranont, C. S. Henry, T. Vilaivan and O. Chailapakul, Anal. Chim. Acta, 2017, 952, 32–40 CrossRef CAS PubMed.
Footnote |
| † Electronic supplementary information (ESI) available. See DOI: https://doi.org/10.1039/d3ra00757j |
| This journal is © The Royal Society of Chemistry 2023 |

