 Open Access Article
Investigation of structural, morphological, and electrical conductivity study for understanding transport mechanisms of perovskite CH3NH3HgCl3
Imen Gharbi a,
Abderrazek Oueslati
 *a,
Ayten Atesd,
Abdelfattah Mahmoud
 b,
Mustapha Zaghriouic and
Mohamed Gargouria
aLaboratory of Spectroscopic Characterization and Optical Materials, Faculty of Sciences, University of Sfax, B.P. 1171, 3000 Sfax, Tunisia. E-mail: oueslatiabderrazek@yahoo.fr
bGREENMAT, CESAM, Institute of Chemistry B6, University of Liège, Liège 4000, Belgium
cUniversité François-Rabelais de Tours, Laboratoire GREMAN UMR-CNRS 7347, 15 rue de la Chocolaterie, IUT de Blois, 41029 Blois Cedex, France
dDepartment of Chemical Engineering, Engineering Faculty, Sivas Cumhuriyet University, 58140 Sivas, Turkey
First published on 29th March 2023
Abstract
Along with morphological and structural studies, the temperature and frequency dependence of the electrical and dielectric properties of the CH3NH3HgCl3 (MATM) compound was investigated and analyzed. SEM/EDS and XRPD analyses proved the purity, composition, and perovskite structure of the MATM. DSC analysis reveals the existence of an order–disorder phase transition of a first-order type at about 342 ± 2 K and 320 ± 1 K (heating and cooling, respectively), attributed to the disorder of [CH3NH3]+ ions. The overall results of the electrical study provide arguments for the ferroelectric nature of this compound and aim to broaden the current knowledge on the thermally activated conduction mechanisms of the studied compound via impedance spectroscopy. The electrical investigations have shown the dominant transport mechanisms in different frequency and temperature ranges, proposing the CBH model in the ferroelectric phase and the NSPT model in the paraelectric phase. The temperature dependence of the dielectric study reveals the classic ferroelectric nature of the MATM. As for the frequency dependence, it correlates the frequency-dispersive dielectric spectra with the conduction mechanisms and their relaxation processes.
1. Introduction
To meet the continuous demands of industrial needs, new functional materials with tunable properties were created primarily in organic–inorganic hybrids.1 These compounds present an emerging class of innovative and advanced new materials that hold significant promises.2 Their complex structure, based on a molecular-scale composite of organic and inorganic components, allows the combination of the properties of these two classes of materials to obtain a unique material. Organic compounds are mainly characterized by weak interactions, namely van der Waals and hydrogen bonding. They have high luminescence efficiency potential, polarizability, plastic mechanical properties, and conductive behavior in some cases.3 Inorganic compounds, typically characterized by covalent and ionic interactions, are known for their thermal stability and interesting properties such as electronic (high electrical mobility and wide range of band gap), magnetic, and dielectric properties.3In the early 21st century (precisely in 2009 by Kojima et al.4), the use of perovskite belonging to the hybrid organic–inorganic materials with the AMX3 (A = methylammonium, formamidinium, aziridinium, and methylhydrazinium,5–7 M = lead and tin, and X = Cl, Br, I)4–17 formula, in solar cells, leading the way in the photovoltaic industry.
They have become the domineering type of perovskites in the field of photovoltaics. In just a few years, the power conversion efficiency in solar cells, given by hybrid organic–inorganic perovskites, has rapidly increased by three times the initially promising value (9%).8 In addition to their outstanding performance, their simple and cost-effective fabrication, i.e., solution-processing techniques, make them one of the most desirable and most studied semiconductor materials in the photovoltaics field.9 Other than their application in the field of photovoltaics, these compounds have been widely used in lasers, light-emitting diodes, photodetectors, and thermoelectricity.10–14 Their extraordinary properties, including a direct bandgap, high carrier mobilities, a long lifetime of the carriers, low carrier recombination rates, long-range charge transport with low trap densities, efficient charge collection at the contacts, a high absorption factor, and a tunable spectral absorption range, are attributed to the unique electronic properties of these materials.9,16 Thanks to the scientific community's enormous interest, the hybrid organic–inorganic perovskites have quickly expanded in terms of types of materials by substituting one or more of the organic or inorganic ions in one of the most studied perovskites. Despite recent rapid advances in conversion efficiency, the understanding of the fundamental properties of AMX3 perovskites remains limited.
The “Methylammonium Trichloro-Mercurate CH3NH3HgCl3” (MATM) belonging to the perovskite-type AMX3, consists of MA![[double bond, length as m-dash]](https://www.rsc.org/images/entities/char_e001.gif) CH3NH3 and HgCl3 ions.2 The studies carried out by Seliger et al.17 suggest that the disorder of [CH3NH3]+ leads to the ferro–paraelectric phase transition that acquires at 333 K. At room temperature, the ferroelectric phase crystallizes in the trigonal symmetry with P32 space group (a = b = 7.817 Å, c = 9.826 Å, γ = 120°, and Z = 3; hexagonal cell). As for the paraelectric phase, which acquires above the temperature of phase transition, it crystallizes in the C2 space group of the monoclinic system.17–21 However, the lack of studies that provide an understanding of the electrical behaviors and the charge transport mechanism of the MATM, especially when it presents a ferroelectric nature at room temperature, stirs the need to carry out a study that unveils the physical behavior of the studied material. The challenges to a fundamental understanding of the MATM perovskite stem from its interesting chemical and physical properties and their interplay. In this context, the present paper aims to give an account of the physicochemical, dielectric, and electrical properties of the material MATM. For the physicochemical properties, we present here the results of X-ray powder diffraction, differential scanning calorimetry (DSC) analyses, as well as Raman spectroscopy and scanning electron microscope (SEM) coupled with energy-dispersive X-ray spectroscopy (EDS) results. Moreover, the dielectric and electrical properties are investigated in the current work through impedance spectroscopy measurements as a function of temperature.
CH3NH3 and HgCl3 ions.2 The studies carried out by Seliger et al.17 suggest that the disorder of [CH3NH3]+ leads to the ferro–paraelectric phase transition that acquires at 333 K. At room temperature, the ferroelectric phase crystallizes in the trigonal symmetry with P32 space group (a = b = 7.817 Å, c = 9.826 Å, γ = 120°, and Z = 3; hexagonal cell). As for the paraelectric phase, which acquires above the temperature of phase transition, it crystallizes in the C2 space group of the monoclinic system.17–21 However, the lack of studies that provide an understanding of the electrical behaviors and the charge transport mechanism of the MATM, especially when it presents a ferroelectric nature at room temperature, stirs the need to carry out a study that unveils the physical behavior of the studied material. The challenges to a fundamental understanding of the MATM perovskite stem from its interesting chemical and physical properties and their interplay. In this context, the present paper aims to give an account of the physicochemical, dielectric, and electrical properties of the material MATM. For the physicochemical properties, we present here the results of X-ray powder diffraction, differential scanning calorimetry (DSC) analyses, as well as Raman spectroscopy and scanning electron microscope (SEM) coupled with energy-dispersive X-ray spectroscopy (EDS) results. Moreover, the dielectric and electrical properties are investigated in the current work through impedance spectroscopy measurements as a function of temperature.
2. Experimental
The MATM crystals were prepared at room temperature through a slow solvent evaporation method. The MATM crystals were grown via methylamine hydrochloride CH5N·HCl (Sangon Biotech) and mercury(II) chloride HgCl2 (Fluka, 99.5%) dissolved in methanol. We mixed 2 g of CH5N·HCl and 8.0423 g of HgCl2 (with an equal molecular ratio of CH5N·HCl/HgCl2: n = 0.0296 mol). These precursors were mixed with methanol in a glass tube, where each of them dissolved immediately without heating. Finally, we mixed both of the solutions in the same tube, and in order to ensure the homogeneity of the resulting solution, the liquid was stirred for a few seconds and then placed in a Petri dish to facilitate the evaporation of the solvent. The Petri dish has been placed in a low-ventilated place, and after 4 days at room temperature without moving or stringing the solution and after the total evaporation of the solvent, colorless monocrystals of MATM were formed. This method is convenient for growing single crystals with high homogeneity and low cost.Analysis of the microstructure and chemical composition was carried out using scanning electron microscopy (SEM) and energy dispersive spectroscopy (EDS) (MIRA3 FEG microscope), coupled with an Oxford Instrument analyzer with different accelerating voltages.
X-ray powder diffraction (XRD) data were studied at room temperature using a Bruker D8 diffractometer (Cu Kα radiation; 10–90° 2θ range; 0.02° step size), to verify the homogeneity and purity of the MATM compound. The pattern's refinement was carried out by the Rietveld calculation method, using “Fullprof” software.22
DSC analysis was performed on a 15 mg sample using the PerkinElmer DSC-7 at temperatures ranging from 273 K to 373 K at an average heating rate of 10 K min−1 during the heating and cooling processes.
Raman spectra, performed on different crystals, were recorded at room temperature in the wavenumber range of 50–3500 cm−1 using a Renishaw Invia Reflex spectrometer. A 633 nm Ar/Kr laser line was used as the excitation source with a power of 1 mW. The incident light was focused by an ×50 lens with a spot size of around 24 μm in diameter on the surface. In the backscattering configuration, the scattered and emitted light was collected.
A small quantity of MATM crystals was ground in an agate mortar to obtain a fine powder, which was pressed into pellets (1.1 mm in thickness and 8 mm in diameter) under a 5-ton per cm2 press. Impedance spectroscopy measurements were performed using two electrode configurations. These measurements were performed using an impedance/gain-phase analyzer (Solartron SI-1260), coupled with a dielectric interface (Solartron 1296), and a temperature control system (Linkam LTS420). The data were collected at temperatures between 297 K and 393 K over a wide frequency range from 10−1 to 106 Hz.
3. Results and discussion
3.1. SEM/EDS analysis
The SEM analysis of the MATM compound was performed on crystals to check the surface morphology of the crystal. The obtained micrographs are represented in Fig. 1(a)–(c), with different magnitudes. The SEM images (a), (b), and (c) confirm the crystalline nature of the crystals of the title compound, and the flat surfaces of the crystals indicate their good quality.23 Indeed, for many different materials, it was shown that the flat (faceted) surface of the microcrystals is a robust indicator of excellent crystallinity.23–26 In combination with EDS analysis, which was investigated in different spots as well as for different crystals, the obtained results of the atomic percentage of elements (inset of the EDS (Fig. 2)) indicate that the compound consists of mercury and chloride. Quantitative analysis suggests a surface coverage with atomic ratios Hg/Cl of 27![[thin space (1/6-em)]](https://www.rsc.org/images/entities/char_2009.gif) :
:![[thin space (1/6-em)]](https://www.rsc.org/images/entities/char_2009.gif) 73 for MATM/perovskite. EDS mapping indicates that the observed ratios are very close to the value of 1
73 for MATM/perovskite. EDS mapping indicates that the observed ratios are very close to the value of 1![[thin space (1/6-em)]](https://www.rsc.org/images/entities/char_2009.gif) :
:![[thin space (1/6-em)]](https://www.rsc.org/images/entities/char_2009.gif) 3, which indicates successful deposition of stoichiometric CH3NH3HgCl3 perovskite. These ratios indicate that the mercury-to-chlor ratio is almost 1
3, which indicates successful deposition of stoichiometric CH3NH3HgCl3 perovskite. These ratios indicate that the mercury-to-chlor ratio is almost 1![[thin space (1/6-em)]](https://www.rsc.org/images/entities/char_2009.gif) :
:![[thin space (1/6-em)]](https://www.rsc.org/images/entities/char_2009.gif) 3, as one would expect for an ABX3 perovskite.
3, as one would expect for an ABX3 perovskite.
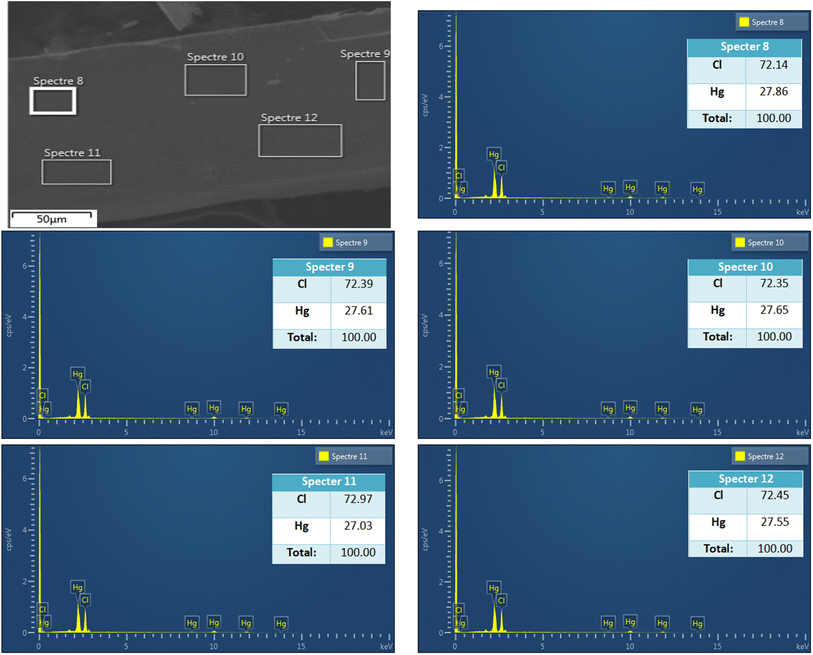 | ||
| Fig. 2 EDS profile of MATM compound for different crystals with a table of the atomic % of elements (inset figures). | ||
3.2. X-ray powder diffraction and structure description
To check the crystallinity and purity of the prepared compound, the grown crystals were ground together and underwent an X-ray powder diffraction analysis. Fig. 3 shows the X-ray powder diffraction pattern of the synthesized compound at room temperature. The present phase was fully indexed in the P32 space group of the trigonal unit cell (hexagonal cell) with a = b = 7.832(6) Å, c = 9.844 (2) Å, and Z = 3. These findings are in good agreement with those reported previously,18–21 which confirms the perovskite structure of the studied compound. The reliability factors evidenced the goodness of fit, where Rp = 16.1%, Rwp = 14.6%, Rexp = 10.2%, and χ2 = 2.076, indicating the high purity of the synthesized sample.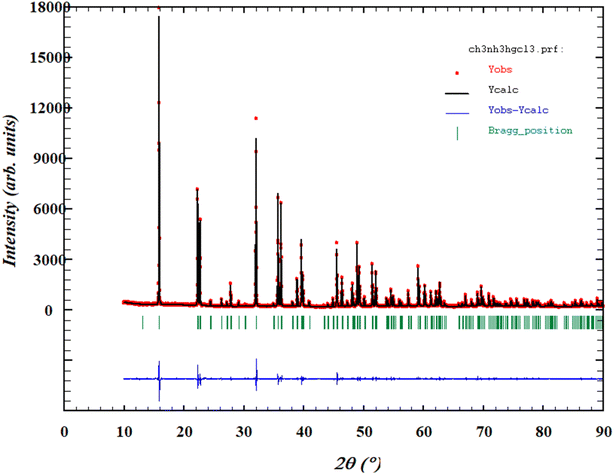 | ||
| Fig. 3 Rietveld's refinement at room temperature of the X-ray powder diffraction pattern of MATM compound. | ||
It was reported previously17–21 that the crystal structure of MATM at room temperature was first determined without any consideration of the ferroelectric domains. Close inspection revealed the presence of three-twofold pseudoaxes perpendicular to the threefold axis of the P32 space group.18 A decrease in the crystal symmetry, from the trigonal P32 to the monoclinic C2 space group, was detected and linked to a ferro–paraelectric phase transition. This transition is characterized by a loss of the threefold axis in the high-temperature structure. Simultaneously one of the three pseudo-two-fold axes becomes real in the paraelectric phase.18,21,27
3.3. Raman spectroscopy
The Raman spectra of MATM's different crystals have been measured in random orientation to ensure the good crystallinity of the material. The spectra were collected at room temperature in the spectral range of 60 to 3500 cm−1 and presented in Fig. 4. Observed bands have been interpreted in terms of internal and external vibration modes of [CH3NH3]+ and [HgCl3]− ions. These modes are assigned by comparison to the observed bands of similar compounds20,27–29 (see Table 1).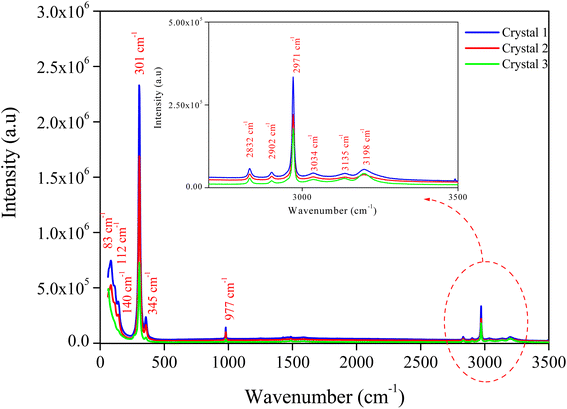 | ||
| Fig. 4 Raman spectra recorded, at room temperature in the wavenumber 50–3500 cm−1, for different crystals. | ||
| Raman (cm−1) | Assignments |
|---|---|
| a vw: very weak; w: weak; m: medium; vs: very strong. | |
| 83 m | [CH3NH3]+ lattice mode |
| 112 m | [HgCl3]− bending mode |
| 140 w | |
| 301 vs | [HgCl3]− asymmetrical stretching mode |
| 345 w | C–N–C symmetrical bending mode |
| 977 w | C–N symmetrical stretching mode |
| 2832 vw | CH3 symmetrical stretching mode |
| 2902 vw | |
| 2971 m | CH3 symmetrical stretching mode |
| 3034 vw | CH3 asymmetrical stretching mode |
| 3135 vw | NH3 asymmetrical stretching mode |
| 3198 vw | |
3.4. DSC analysis
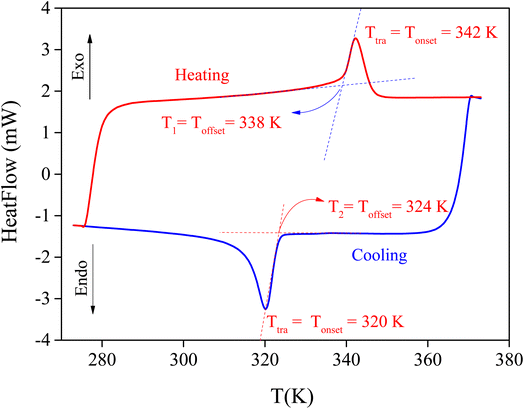
The DSC measurement was conducted for the MATM in its crystal form in the temperature range of 273 K to 373 K upon the heating and cooling process at a rate of 10 K min−1. The data show, in Fig. 5, the existence of a reversible peak at 342 ± 2 K and 320 ± 1 K (heating and cooling, respectively). The onset point of the peak on heating and cooling was taken as the phase transition temperature, as schematically shown. This peak is intense and exhibits the characteristics of a first-order phase transition, which was also indicated by the thermal hysteresis ΔT = T1 − T2 (see Fig. 5) associated with the transition. The latter is in good agreement with the crystallographic data, where the observed transition does not compromise the group–subgroup relation confirming the first-order type. It has been reported previously that phase transitions are classified into two types, namely order–disorder and displacive transitions. If the entropy value is above 2 J mol−1 K−1, the phase transition is mainly considered an order–disorder type.24,25As for the MATM, the enthalpy ΔH is determined after measuring the peak's area, and the entropy ΔS is deduced from the obtained enthalpy.25 These two factors were determined by the exothermic peak (heating process). Their values are 6.9 K J mol−1 and 20.53 J K−1 mol−1, respectively. So, the observed phase transition at 342 ± 2 K would be related to the pure order–disorder type.23 Mainly, the phase transition between distinct crystal structures is due to the organic cations that have a disordered dynamic at high temperatures and freeze at low temperatures.26 We may conclude that the disorder of [CH3NH3]+ is responsible for the ferro–paraelectric nature of the phase transition.17,18,27
3.5. Impedance spectroscopy
To suggest a proper equivalent circuit model that well interprets the electrical behavior of the MATM material, we chose to express the experimental data in terms of complex impedances.
Fig. 6(a) and (b) show Nyquist plots, also known as Cole–Cole plots (−Z′′ versus Z′), of the MATM compound over a wide range of temperature and frequency, demonstrating a single depressed semicircle whose center lies below the real axis (Z′ axis). The latter is attributed to the existence of single electrical relaxation phenomena31 and indicates a non-Debye type of relaxation.32 The presence of a single semicircular arc suggests the dominance of the grain's contribution. The spectra were adequately modeled by a one-cell circuit model, formed by a parallel combination of resistance (R), capacitance (C), and a constant phase element (CPE) (inset Fig. 6(a)). However, interfacial polarization occurs in the spectra even at the temperature of the phase transition (Ttra = 343 K). For this reason, we have added a constant phase element (CPE) to the equivalent circuit (inset Fig. 6(b)). The exchange of electrons between the ions of the same molecules takes place. The deformities and imperfections present in the material are responsible for altering the position and distribution of positive and negative space charges. This behavior is caused by the orientation of the methylammonium [CH3NH3]+ cations. Under the influence of the applied electric field, positive and negative charges move toward the negative and positive poles of the applied field, respectively. As a result, a large number of dipoles are formed.30,31 The latter can explain the appearance of the interfacial polarization above Ttra.
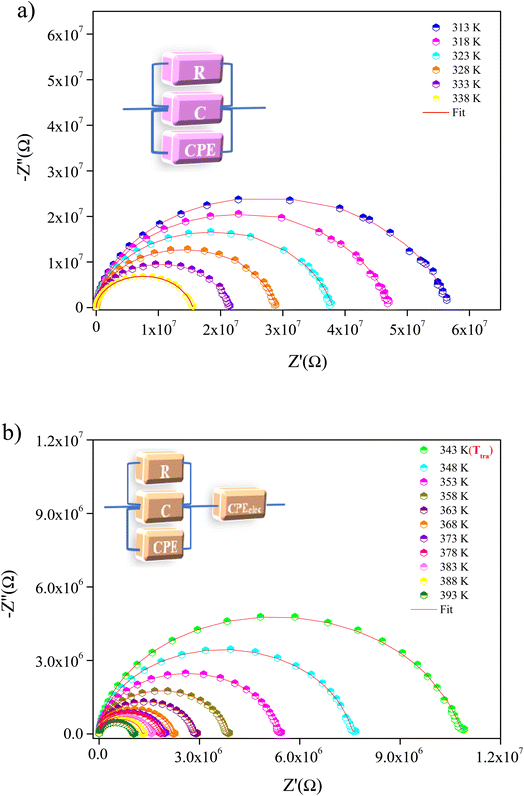 | ||
| Fig. 6 Nyquist plot of MATM compound, at different temperatures, (a) before and (b) after the temperature of phase transition. | ||
The resistance of the MATM at each temperature can be determined from the intercept of the semicircular arcs with the real axis (Z′). We may notice that the resistance values decrease with the increase in temperature (inset Fig. 7), accounting for the negative temperature coefficient of the resistances (NTCR). This behavior reveals that the conduction mechanism is thermally activated and the sample presents a semiconductor character.32–34
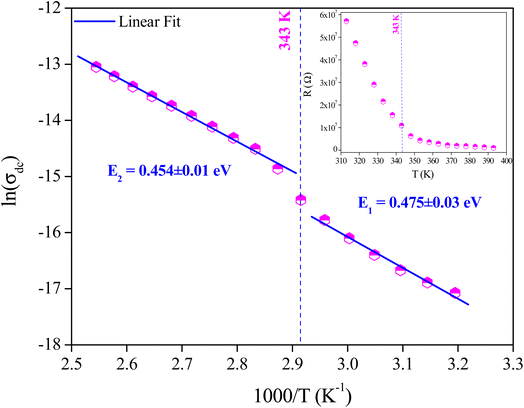 | ||
| Fig. 7 Variation of D. C. conductivity of the grains as a function of (1000/T), and variation of grains resistance as a function of temperature (inset). | ||
The D. C. conductivity (σDC) was determined using the following relation:
 | (1) |
The variation of D. C. conductivity as a function of the inverse of temperature is presented in Fig. 7. Its evolution marks an increment with the increase in temperature, obeying Arrhenius' law:
 | (2) |
A change in the slope of the D. C. conductivity curve is observed at T = 343 K, which is very close to the temperature of the phase transition detected by DSC analysis. The activation energy values of charge transport resulting from the linear fit are E1 = 0.475 ± 0.03 eV at low temperatures and E2 = 0.454 ± 0.01 eV at higher ones. According to DFT calculations performed by Yang et al.,35 as well as results obtained from similar studies,26 the values of activation energies stand out for the interstitial [CH3NH3]+ ions. The distinct activation energies indicate how the orientation of the dipole interacts with the charge carriers, activating the mobility of ions and their diffusion as the temperature increases.26
The A. C. conductivity of the sample under study was determined, using the impedance's real Z′ and imaginary Z′′ measured values, by applying the following relation:
 | (3) |
The evolution of A. C. conductivity (σAC), as a function of frequency and in the studied temperature range, is presented in Fig. 8. Two regions can be identified in these spectra. The first, located in the low frequencies, appears as a plateau, which is attributed to the conductivity behavior, namely D. C. conductivity. The second, located at higher frequencies, is known as the “conductivity scattered area”, where the conductivity increases due to the mobility of charge carriers with the increase in frequency.36 This behavior can be described by Jonscher's universal power law:37
| σAC = σDC + Bωs(T) | (4) |
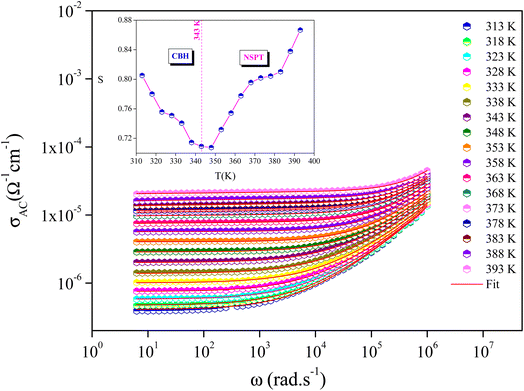 | ||
| Fig. 8 Variation of σAC with angular frequency at different temperatures, and temperature dependence of the frequency exponent s (inset Fig. 8). | ||
In previous works, diverse conduction models were reported, mainly classified into two distinct processes: the classical hopping over a barrier and the quantum tunneling effect. However, over the years, some modifications were performed. The final proposed models are quantum mechanical tunneling (QMT), correlated barrier hopping (CBH), non-overlapping small polaron tunneling (NSPT), and overlapping large polaron tunneling (OLPT).39
These models were proposed to correlate the conduction mechanism of the A. C. conductivity with the behavior of s(T) as a function of temperature.
The thermal variation of s(T) is provided in the inset of Fig. 8. It is worth noting that s(T) decreases with increasing temperature before increasing again after the phase transition temperature. This behavior coincides with the CBH model for T < Ttra (ferroelectric phase) and with the NSPT model for T > Ttra (paraelectric phase).
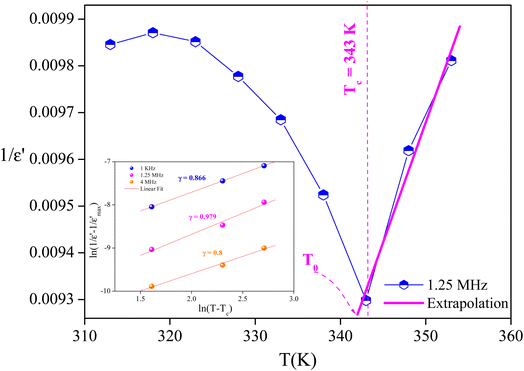
 as a function of temperature at a fixed frequency of 1.25 MHz. The latter appears as a straight line just above the temperature of the phase transition.
The degree of disorder in the ferroelectric MATM was evaluated using an empirical formula developed by Uchino and Nomura:45
 | (5) |
 is the relative dielectric constant at temperature T,
  is the maximum value at Curie–Weiss temperature Tc, C is the Curie–Weiss constant, and γ is the factor of diffuseness (1< γ < 2). When the 1 and 2 limiting values of γ are used, the Curie–Weiss equation is reduced, yielding the classical ferroelectric and the ideal relaxer ferroelectric.44 In our case, the γ values determined for different frequencies were found to be close to the unit. So, we may conclude that the MATM compound is a classical ferroelectric.
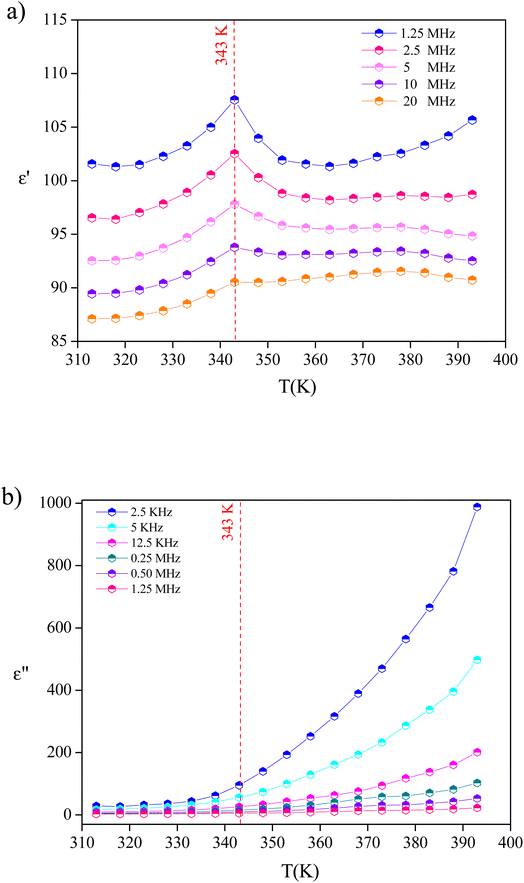
The temperature dependence of dielectric responses revealed the presence of anomalous dielectric behavior at 343 K (identified as a ferro–paraelectric phase transition), which is normally the temperature at which dielectric relaxation occurs. Thus, we now report the frequency dependence of the dielectric response at different temperatures, which is expressed in the form of the complex dielectric constant ε*(ω) that can be expressed as the following:
| ε*(ω) = ε′(ω) − jε′′(ω) | (6) |
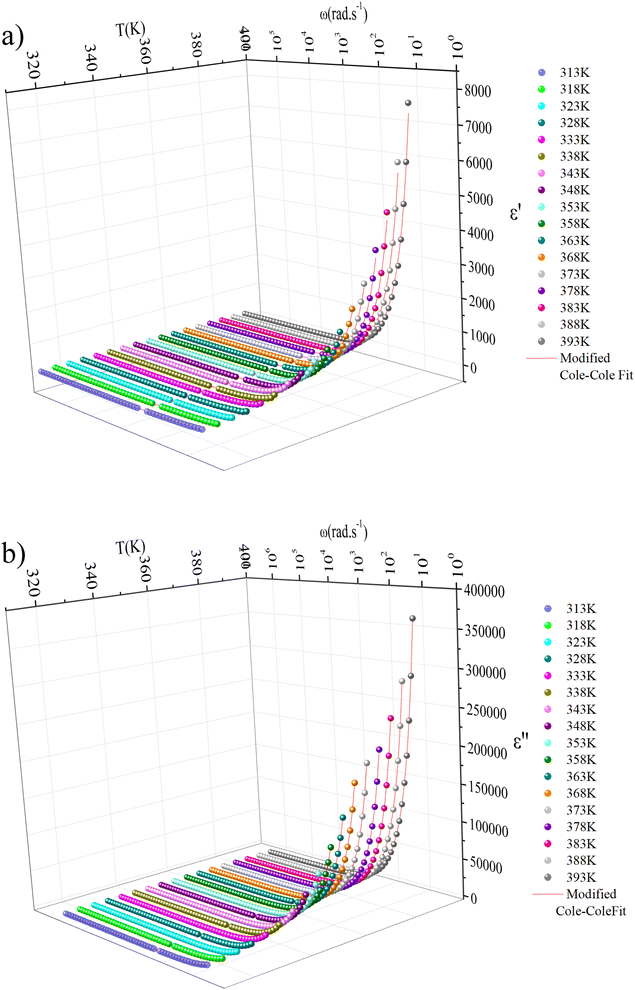
Fig. 11(a) and (b) depict the investigation and demonstration of the variation of the dielectric constant's real and imaginary parts as a function of frequency. We may notice that the dielectric constant is large (reaching 8 × 10³ for ε′(ω) and 3.7 × 10⁵ for ε′′(ω)) in the low-frequency region and decreases gradually with the increase of frequency to remain constant at a higher frequency. Such behavior indicates a large dielectric dispersion behavior and a thermally activated nature of the dielectric relaxation.45–47 Each of ε′(ω) and ε′′(ω) plays a noteworthy role in defining the ionic conduction process, which is mainly ruled by ionic, electronic, orientational, and interfacial polarization. The behavior of the dielectric response in the low-frequency region was found to be governed by orientational polarization and interfacial polarization, which confirms the non-Debye behavior.30 As for the high-frequency region, the ionic and electronic polarizations are responsible for lowering the value of the dielectric constant.30,48
To study the variation of the dielectric constant versus frequency in the studied temperature range, the modified Cole–Cole model with D. C. conductivity was used, where a correction term has been added. According to the modified Cole–Cole model, the complex permittivity can be stated as:30,48,49
 | (7) |
From the previous relation, the complex permittivity can be decomposed into the real ε′(ω) and ε′′(ω) imaginary parts can be expressed as the following:
 | (8) |
 | (9) |
The experimental data of real and imaginary parts were fitted with the modified Cole–Cole equation using the previous equations.
To gain insight into the relaxation procedure in MATM, detailed complex modulus (M* = M′ + jM′′) spectra have been studied. The imaginary part M′′ of the electric modulus as a function of angular frequencies in the studied temperature range is illustrated in Fig. 12(a). These spectra reveal a single peak's presence, confirming the studied material's single relaxation phenomenon. These findings are in good agreement with those of the Nyquist plots.
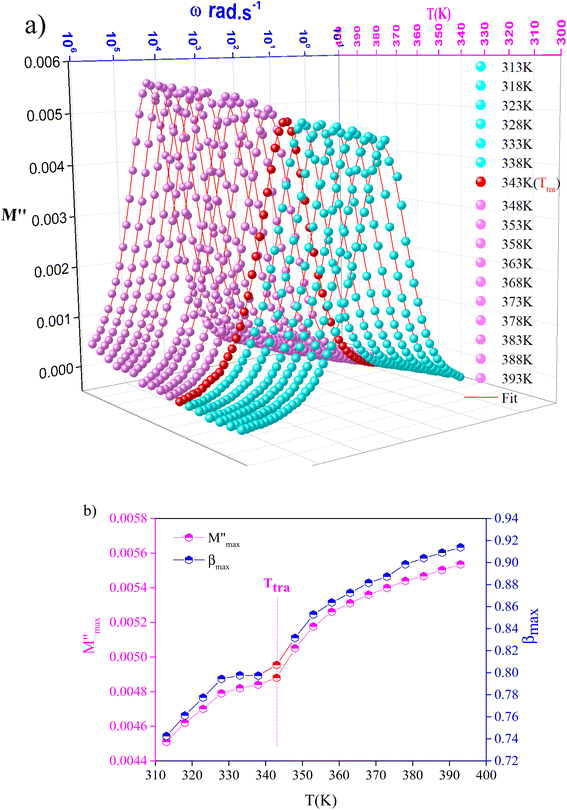 | ||
Fig. 12 Variation of (a) modulus spectra (M′′) vs. frequency and (b) parameters ( , β) as a function of temperature. , β) as a function of temperature. | ||
The observed peaks are slightly asymmetric at each temperature, and they are rather wider than the peaks of Debye. The enlargement points out the spread of relaxation with different meantime constants, confirming the non-Debye relaxation of the MATM.41,49,50 In addition, with the increase in temperature, the position of the peaks marks a shift toward the higher frequencies. These observations were confirmed by the analysis of the single peak characteristic using the Bergman equation, which is stated as follows:
 | (10) |
 is the modulus maximum associated with the frequency noted by ωmax, β′ is known by the Kohlrausch parameter (0 < β' < 1).
Fig. 12(b) represents the variation of each  and β′ values, as a function of temperature. The variation of these two parameters reveals the existence of two distinct regions with a change in slope around the same temperature as the detected phase transition. The behavior of these factors reveals that the mechanism of the observed phase transition may be described as an order–disorder transition, and the movement of [CH3NH3]+ cations is at least between two energetically equivalent positions.51 These findings are in good agreement with those of the DSC analysis.
4. Conclusions
Methylammonium Trichloro-Mercurate (MATM) crystals were grown through a slow evaporation method. Several complementary techniques, along with the XRPD analysis, were brought together to investigate the surface morphology, stoichiometry, and purity of the MATM in its crystal and powder forms. SEM analysis confirmed the crystalline nature and the flat surfaces of the crystals, indicating the good quality of the MATM crystals. EDS analysis revealed a surface coverage with Hg/Cl atomic ratios of 27![[thin space (1/6-em)]](https://www.rsc.org/images/entities/char_2009.gif) :
:![[thin space (1/6-em)]](https://www.rsc.org/images/entities/char_2009.gif) 73, indicating a successful deposition of stoichiometric MATM perovskite. These ratios show that the mercury-to-chlorine ratio is almost 1
73, indicating a successful deposition of stoichiometric MATM perovskite. These ratios show that the mercury-to-chlorine ratio is almost 1![[thin space (1/6-em)]](https://www.rsc.org/images/entities/char_2009.gif) :
:![[thin space (1/6-em)]](https://www.rsc.org/images/entities/char_2009.gif) 3, as expected for an ABX3 perovskite. As for the vibrational analysis, Raman spectra recorded at room temperature have given information about the internal and external vibration modes of [CH3NH3]+ and [HgCl3]− ions. As for thermal analysis, the DSC revealed the existence of a reversible peak at 342 ± 2 K and 320 ± 1 K upon the heating and cooling processes, respectively. The latter is associated with a first-order phase transition of an order–disorder nature, produced from the disorder of [CH3NH3]+ ions. The electrical, dielectric, and relaxation properties of the MATM hybrid perovskite are studied using impedance spectroscopy to characterize the material's intrinsic electrical behavior. Following the structural aspects, this behavior is interpreted, establishing a link between the nature of the migrating species and their impact on the macroscopic properties. The Nyquist plots revealed the existence of single electrical relaxation phenomena, indicating a non-Debye type relaxation, and the presence of a single semicircular arc suggests the dominance of the grain's contribution. These plots were satisfactorily fitted with the one-cell R/C/CPE circuit model, with the exception of adding a CPE element in series from the temperature of phase transition. The latter was interpreted by the formation of a significant number of dipoles, creating an interfacial polarization. A change in the slope of the D. C. conductivity curve is observed around the same temperature of the phase transition detected by DSC analysis. The activation energy values of charge transport are E1 = 0.475 ± 0.03 eV (T < Ttra) and E2 = 0.454 ± 0.01 eV (T > Ttra). These values were found to stand out for the interstitial [CH3NH3]+ ions. In addition, the A. C. conductivity was successfully described through Jonscher's power law. The variation of the deduced s(T) indicates that the CBH model interprets the charge transport mechanism in the MATM well (for T < Ttra), but switches to an NSPT model above Ttra. As for the dielectric study, as a function of temperature, it provides arguments for the existence of ferroelectricity, revealing the classic ferroelectric nature of the studied material. However, it confirms the findings of the electrical study as a function of frequency, where the space charge and free charge conductivity were determined through the modified Cole–Cole plot.
3, as expected for an ABX3 perovskite. As for the vibrational analysis, Raman spectra recorded at room temperature have given information about the internal and external vibration modes of [CH3NH3]+ and [HgCl3]− ions. As for thermal analysis, the DSC revealed the existence of a reversible peak at 342 ± 2 K and 320 ± 1 K upon the heating and cooling processes, respectively. The latter is associated with a first-order phase transition of an order–disorder nature, produced from the disorder of [CH3NH3]+ ions. The electrical, dielectric, and relaxation properties of the MATM hybrid perovskite are studied using impedance spectroscopy to characterize the material's intrinsic electrical behavior. Following the structural aspects, this behavior is interpreted, establishing a link between the nature of the migrating species and their impact on the macroscopic properties. The Nyquist plots revealed the existence of single electrical relaxation phenomena, indicating a non-Debye type relaxation, and the presence of a single semicircular arc suggests the dominance of the grain's contribution. These plots were satisfactorily fitted with the one-cell R/C/CPE circuit model, with the exception of adding a CPE element in series from the temperature of phase transition. The latter was interpreted by the formation of a significant number of dipoles, creating an interfacial polarization. A change in the slope of the D. C. conductivity curve is observed around the same temperature of the phase transition detected by DSC analysis. The activation energy values of charge transport are E1 = 0.475 ± 0.03 eV (T < Ttra) and E2 = 0.454 ± 0.01 eV (T > Ttra). These values were found to stand out for the interstitial [CH3NH3]+ ions. In addition, the A. C. conductivity was successfully described through Jonscher's power law. The variation of the deduced s(T) indicates that the CBH model interprets the charge transport mechanism in the MATM well (for T < Ttra), but switches to an NSPT model above Ttra. As for the dielectric study, as a function of temperature, it provides arguments for the existence of ferroelectricity, revealing the classic ferroelectric nature of the studied material. However, it confirms the findings of the electrical study as a function of frequency, where the space charge and free charge conductivity were determined through the modified Cole–Cole plot.
The presented results provide insights into the correlation between the properties of this material, leading us to conclude that MATM is a feasible perovskite that could be used in energy-harvesting systems.
Conflicts of interest
There are no conflicts to declare.Acknowledgements
This work is financially supported by the Ministry of Higher Education and Scientific Research of Tunisia.References
- A. Mhiri, F. Krichen, A. Oueslati, J. Lhoste, F. Goutenoire, M. Gargouri and A. Bulou, Synthesis, structural characterization, and spectroscopic studies of bis tetramethylammonium hexabromostannate [N(CH3)4]2SnBr6, J. Alloys Compd., 2019, 772, 546–556, DOI:10.1016/j.jallcom.2018.09.158.
- I. Borriello, G. Cantele and D. Ninno, Finding new perovskite halides via machine learning, Phys. Rev. B: Condens. Matter Mater. Phys., 2008, 77, 235214, DOI:10.1103/PhysRevB.77.235214.
- I. Chaabane, F. Hlel and K. Guidara, Electrical study by impedance spectroscopy of the new compound [C12H17N2]2CdCl4, J. Alloys Compd., 2008, 461, 495–500, DOI:10.1016/j.jallcom.2007.07.031.
- A. Kojima, K. Teshima, Y. Shirai and T. Miyasaka, Organometal Halide Perovskites as Visible-Light Sensitizers for Photovoltaic Cells, J. Am. Chem. Soc., 2009, 131, 6050–6051, DOI:10.1021/ja809598r.
- R. H. Petrosova, O. I. Kucheriv, S. Shova and I. A. Gural'skiy, Aziridinium cation templating 3D lead halide hybrid perovskites, Chem. Commun., 2022, 58(38), 5745–5748, 10.1039/D2CC01364A.
- M. Mączka, M. Ptak, A. Gągor, D. Stefańska, J. K. Zaręba and A. Sieradzki, Methylhydrazinium Lead Bromide: Noncentrosymmetric Three-Dimensional Perovskite with Exceptionally Large Framework Distortion and Green Photoluminescence, Chem. Mater., 2020, 32(4), 1667–1673, DOI:10.1021/acs.chemmater.9b05273.
- M. Maçzka, A. Gagor, J. K. Zareba, D. Stefanska, M. Drozd, S. Balciunas, M. Šimenas, J. Banys and A. Sieradzki, Three-dimensional perovskite methylhydrazinium lead chloride with two polar phases and unusual second-harmonic generation bistability above room temperature, Chem. Mater., 2020, 32(9), 4072–4082, DOI:10.1021/acs.chemmater.0c00973.
- M. Saliba, T. Matsui, K. Domanski, J. Y. Seo, A. Ummadisingu, S. M. Zakeeruddin and M. Grätzel, et al.). Incorporation of rubidium cations into perovskite solar cells improves photovoltaic performance, Science, 2016, 354(6309), 206–209, DOI:10.1126/science.aah5557.
- S. X. Tao, X. Cao and P. A. Bobbert, Accurate and efficient band gap predictions of metal halide perovskites using the DFT-1/2 method: GW accuracy with DFT expense, Sci. Rep., 2017, 7(1), 1–9, DOI:10.1038/s41598-017-14435-4.
- C. Bao, J. Yang, S. Bai, W. Xu, Z. Yan, Q. Xu and F. Gao, et al.). High Performance and Stable All-Inorganic Metal Halide Perovskite-Based Photodetectors for Optical Communication Applications, Adv. Mater., 2018, 30(38), 1–8, DOI:10.1002/adma.201803422.
- J. Sun, J. Wu, X. Tong, F. Lin, Y. Wang and Z. M. Wang, Organic/Inorganic Metal Halide Perovskite Optoelectronic Devices beyond Solar Cells, Adv. Sci., 2018, 5(5), 1700780, DOI:10.1002/advs.201700780.
- Y. Liu, Z. Yang, D. Cui, X. Ren, J. Sun, X. Liu and S. Liu, et al.). Two-Inch-Sized Perovskite CH3NH3PbX3 (X = Cl, Br, I) Crystals: Growth and Characterization, Adv. Mater., 2015, 27(35), 5176–5183, DOI:10.1002/adma.201502597.
- J. M. Kadro, K. Nonomura, D. Gachet, M. Grätzel and A. Hagfeldt, Facile route to freestanding CH3NH3PbI3 crystals using inverse solubility, Sci. Rep., 2015, 5, 1–6, DOI:10.1038/srep11654.
- M. A. Afroz, C. A. Aranda, N. K. Tailor, P. Yukta Yadav, M. M. Tavakoli and S. Satapathi, et al.). Impedance Spectroscopy for Metal Halide Perovskite Single Crystals: Recent Advances, Challenges, and Solutions, ACS Energy Lett., 2021, 6(9), 3275–3286, DOI:10.1021/acsenergylett.1c01099.
- K. Mencel, P. Durlak, M. Rok, R. Jakubas, J. Baran, W. Medycki and A. Piecha-Bisiorek, et al.). Widely used hardly known. An insight into electric and dynamic properties of formamidinium iodide, RSC Adv., 2018, 8(47), 26506–26516, 10.1039/c8ra03871f.
- M. M. Lee, J. Teuscher, T. Miyasaka, T. N. Murakami and H. J. Snaith, Efficient hybrid solar cells based on meso-superstructured organometal halide perovskites, Science, 2012, 338(6107), 643–647, DOI:10.1126/science.1228604.
- J. Seliger, V. Zagar, R. Blinc, F. Milia and S. Giannacopoulos, Proton 14N double resonance study of the ferroelectric phase transition in (CH3NH3)HgC13, Solid State Commun., 1986, 59(12), 877–879, DOI:10.1016/0038-1098(86)90648-4.
- H. Fuess, M. Körfer, H. Arend and R. Kind, A new ferroelectric compound: Methylammonium trichloromercurate (CH3NH3HgCl3), Solid State Commun., 1985, 56(1), 137–139, DOI:10.1016/0038-1098(85)90551-4.
- F. Milia and M. Voudouris, 35C1 NQR Study of the low temperature transition in ferroelectric (CH3NH3)HgCl3, Solid State Commun., 1986, 60(3), 261–262, DOI:10.1016/0038-1098(86)90460-6.
- M. Daub, R. Stroh, H. Hillebrecht, M. Koerfer, H. Fuess, M. Prager, E. J. Zehnder, M. A. Hossain, J. P. Srivastava, H. D. Bist, P. K. Khulbe, Z. T. Jiang, B. D. James, J. Liesegang, K. L. Tan, R. Gopalakrishnan and I. Novak, Raman spectroscopic evidence of the phase transition in CH3NH3HgCl3, Phys. Status Solidi A, 1991, 123(2), 535–538, DOI:10.1002/pssa.2211230218.
- Y. Ishibashi and V. Dvorak, Structural Phase Transitions in CH3NH3HgCl3, J. Phys. Soc. Jpn., 1989, 58(12), 4493–4495, DOI:10.1143/JPSJ.58.4493.
- R. A. Young, P. E. Mackie and R. B. von. Dreele, Application of the Pattern-Fitting Structure-Refinement Method to X-ray Powder Diffractometer Patterns, J. Appl. Crystallogr., 1977, 10, 262–269, DOI:10.1107/S0021889877013466.
- M. H. Mrada, I. Feddaoui, M. S. M. Abdelbaky, S. García- Granda and C. Ben Nasr, Elaboration, crystal structure, characterization and DFT calculation of a new Hg(II) inorganic-organic hybrid salt [C6H16N2O]HgCl4, J. Solid State Chem., 2020, 286, 121280, DOI:10.1016/j.jssc.2020.121280.
- P. Szklarz, M. Owczarek, G. Bator, T. Lis, K. Gatner and R. Jakubas, Crystal structure, properties and phase transitions of morpholinium tetrafluoroborate [C4H10NO][BF4], J. Mol. Struct., 2009, 929(1–3), 48–57, DOI:10.1016/j.molstruc.2009.04.014.
- I. Gharbi, A. Oueslati, K. Guidara and B. Louati, Ionic conductivity and conduction mechanism of CsZnPO4 compound, Ionics, 2019, 25, 3991–4001, DOI:10.1007/s11581-019-02954-1.
- R. E. Patru, H. Khassaf, I. Pasuk, M. Botea, L. Trupina, C. Ganea, L. Pintilie and I. Pintilie, Tetragonal – Cubic Phase Transition and Low-Field Dielectric Properties of CH 3 NH 3 PbI 3 Crystals, Materials, 2021, 14(15), 4215, DOI:10.3390/ma14154215.
- Z. T. Jiang, B. D. James, J. Liesegang, K. L. Tan, R. Gopalakrishnan and I. Novak, Investigation of the ferroelectric phase transition in (CH3NH3)HgCl3, J. Phys. Chem. Solids, 1995, 56(2), 277–283, DOI:10.1016/0022-3697(94)00176-6.
- M. A. Hossain, J. P. Srivastava, H. D. Bist and P. K. Khulbe, Raman spectroscopic evidence of the phase transition in CH3NH3HgCl3, Phys. Status Solidi A, 1991, 123(2), 535–538, DOI:10.1002/pssa.2211230218.
- F. Lambarki, A. Ouasri, A. Rhandour, M. Saadi, L. El Ammari and L. Hajji, Structural, vibrational and electrical studies of tetramethylammonium trichloromercurate [(CH3)4N]HgCl3, J. Mol. Struct., 2018, 1173, 865–875, DOI:10.1016/j.molstruc.2018.07.051.
- P. Sengupta, P. Sadhukhan, A. Ray, R. Ray, S. Bhattacharyya and S. Das, Temperature and frequency dependent dielectric response of C3H7NH3 PbI3: a new hybrid perovskite, J. Appl. Phys., 2020, 127(20), 204103, DOI:10.1063/1.5142810.
- J. L. C. Huamán, Perovskite Ceramics Recent Advances and Emerging Applications, in Perovskite Ceramics, ed. J. L. C. Huamán and V. A. G. Rivera, 1st edn, 2023. DOI:10.1016/c2020-0-03937-x.
- M. Abbassi, R. Ternane, I. Sobrados, A. Madani, M. Trabelsi-Ayadi and J. Sanz, Ionic conductivity of apatite-type solid electrolyte ceramics Ca2−xBaxLa4Bi4(SiO4)6O2 (0 ≤ x ≤ 2), Ceram. Int., 2013, 39(8), 9215–9221, DOI:10.1016/j.ceramint.2013.05.026.
- C. Thirmal, P. Murugavel and V. Subramanian, Impedance spectroscopic analysis of the organic ferroelectric - Diisopropylammonium bromide (DIPAB), Curr. Appl. Phys., 2014, 14(5), 688–690 CrossRef . 10.1016/j.cap.2014.02.018.
- Y. Pu, Z. Dong, P. Zhang, Y. Wu, J. Zhao and Y. Luo, Dielectric, complex impedance and electrical conductivity studies of the multiferroic Sr2FeSi2O7-crystallized glass-ceramics, J. Alloys Compd., 2016, 672, 64–71, DOI:10.1016/j.jallcom.2016.02.137.
- D. Yang, W. Ming, H. Shi, L. Zhang and M. H. Du, Fast Diffusion of Native Defects and Impurities in Perovskite Solar Cell Material CH3NH3PbI3, Chem. Mater., 2016, 28(12), 4349–4357, DOI:10.1021/acs.chemmater.6b01348.
- G. F. Pike, AC Conductivity of Scandium Oxide and a New Hopping Model for Conductivity, Phys. Rev. B: Solid State, 1972, 6, 1572, DOI:10.1103/PhysRevB.6.1572.
- A. Jonscher, The ‘universal’ dielectric response, Nature, 1977, 267, 673–679, DOI:10.1038/267673a0.
- I. Gharbi, A. Oueslati and K. Guidara, Alternating current conduction mechanisms of RbMgPO4 compound, Mater. Res. Bull., 2018, 100, 1–6, DOI:10.1016/j.materresbull.2017.11.058.
- C. B. Mohamed, K. Karoui, F. Jomni, K. Guidara and A. B. Rhaiem, Electrical properties and conduction mechanism of [C2H5NH3]2CuCl4 compound, J. Mol. Struct., 2015, 1082, 38–48, DOI:10.1016/j.molstruc.2014.11.006.
- S. Hajlaoui, I. Chaabane, J. Lhoste, A. Bulou and K. Guidara, Structural characterization, vibrational spectroscopy accomplished with DFT calculation, thermal and dielectric behaviors in a new organic–inorganic tertrapropylammonium aquapentachlorostannate dihydrate compound, J. Alloys Compd., 2016, 679, 302–315, DOI:10.1016/j.jallcom.2016.04.015.
- I. Gharbi, A. Oueslati, M. H. Dhaou and M. Gargouri, Investigation of ferroelectric phase transitions in TlZnPO4 stuffed tridymite compound, J. Solid State Chem., 2022, 308(2021), 122886, DOI:10.1016/j.jssc.2022.122886.
- S. Aydi, A. Amouri, S. Chkoundali and A. Aydi, Lead-free ferroelectric Na1−xSrx (Sn0.25Ti0.75) xNb1−xO3 system (0.1 ≤ x ≤ 0.4) XRD, dielectric, and Raman properties, Ceram. Int., 2017, 43(15), 12179–12185, DOI:10.1016/j.ceramint.2017.06.076.
- M. Abdessalem, I. Kriaa, A. Aydi and N. Abdelmoula, Large electrocaloric effect in lead-free Ba1−xCaxTi1−yZryO3 ceramics under strong electric field at room-temperature, Ceram. Int., 2018, 44(12), 13595–13601, DOI:10.1016/j.ceramint.2018.04.194.
- L. Khemakhem, A. Kabadou, A. Maalej, A. B. Salah, A. Simon and M. Maglione, New relaxor ceramic with composition BaTi1−x(Zn1/3Nb2/3)xO3, J. Alloys Compd., 2008, 452(2), 451–455, DOI:10.1016/j.jallcom.2007.03.056.
- K. Uchino and S. Nomura, Critical Exponents Of The Dielectric Constants In Diffused- Phase-Trans Ition Crystals, Ferroelectrics, 1982, 44(1), 55–61, DOI:10.1080/00150198208260644.
- I. Ouni, H. Ben Khlifa, R. M'nassri, M. M. Nofal, E. M. A. Dannoun, H. Rahmouni, K. Khirouni and A. Cheikhrouhou, Transport properties and dielectric response of Pr0.8Na0.2−xKxMnO3 (x = 0, 0.05, 0.1, 0.15 and 0.2) ceramics synthesized by sol–gel method, Appl. Phys. A: Mater. Sci. Process., 2021, 127(8), 12, DOI:10.1007/s00339-021-04760-x.
- X. Z. Zuo, J. Yang, B. Yuan, D. P. Song, X. W. Tang, K. J. Zhang, X. B. Zhu, W. H. Song, J. M. Dai and Y. P. Sun, Magnetic, dielectric properties, and scaling behaviors of Aurivillius compounds Bi6−x/3Fe2Ti3−2x(WCo)xO18 (0 ≤ x ≤ 0.15), J. Appl. Phys., 2015, 117(11), 7, DOI:10.1063/1.4915089.
- M. B. Bechir and M. H. Dhaou, Study of Charge Transfer Mechanism and Dielectric Relaxation of CsCuCl3 Perovskite Nanoparticles, Mater. Res. Bull., 2021, 144, 111473, DOI:10.1016/j.materresbull.2021.111473.
- P. Thongbai, S. Tangwancharoen, T. Yamwong and S. Maensiri, Dielectric relaxation and dielectric response mechanism in (Li, Ti)-doped NiO ceramics, J. Condens. Matter Phys., 2008, 20(39), 395227, DOI:10.1088/0953-8984/20/39/395227.
- M. Ram and S. Chakrabarti, Dielectric and modulus studies on LiFe1/2Co1/2VO4, J. Alloys Compd., 2008, 462(1–2), 214–219, DOI:10.1016/j.jallcom.2007.08.001.
- K. Mencel, P. Durlak, M. Rok, R. Jakubas, J. Baran, W. Medycki, A. Ciżman and A. Piecha-Bisiorek, Widely used hardly known. An insight into electric and dynamic properties of formamidinium iodide, RSC Adv., 2018, 8(47), 26506–26516, 10.1039/c8ra03871f.
| This journal is © The Royal Society of Chemistry 2023 |


