 Open Access Article
Antimony and naphthalene can be simultaneously leached from a combined contaminated soil using carboxymethyl-β-cyclodextrin as a biodegradable eluant
Changming Yang *ab,
Yanzhang Haoa and
Hanyu Wanga
aKey Laboratory of Yangtze River Water Environment of the Ministry of Education, Tongji University, Shanghai 200092, China. E-mail: cmyang@tongji.edu.cn; 1939771869@qq.com; 13636169262@163.com; Fax: +86-21-65986313; Tel: +86-21-65983869
bCollege of Environmental Science and Engineering, Tongji University, 1239 Siping Road, Shanghai 200092, China
First published on 25th April 2023
Abstract
In this study, we have investigated the removal efficiency of antimony (Sb) and naphthalene (Nap) from a combined contaminated soil by carboxymethyl-β-cyclodextrin (CMCD) leaching and reveal its remediation mechanisms by FTIR and 1H NMR analyses. The results show that the highest removal efficiencies of Sb and Nap were 94.82% and 93.59%, respectively, with a CMCD concentration of 15 g L−1 at a pH of 4 and a leaching rate of 2.00 mL min−1 over an interval-time of 12 h. The breakthrough curves show that CMCD had a stronger inclusion capacity of Nap than Sb, and Sb could enhance the adsorption capacity of Nap, while Nap weakened the adsorption of Sb during CMCD leaching. Furthermore, the FTIR analysis suggests that the removal of Sb from combined contaminated soil involved complexation with the carboxyl and hydroxyl groups on CMCD, and the NMR analysis suggests that the inclusion of Nap occurred. These results indicate that CMCD is a good eluant for remediating soil contaminated by a combination of heavy metals and polycyclic aromatic hydrocarbons (PAHs), and its remediation mechanisms depend on the complexation reactions between the surface functional groups and inclusion reactions in the internal cavities.
1. Introduction
With the rapid development of society and economy, soil and environmental safety, as well as ecological health, become increasingly important as they concern the safety of agricultural products, industrial constructions and people. In recent years, combined inorganic–organic pollution of the soil is widespread1 and is caused by heavy metals (HMs)2 and polycyclic aromatic hydrocarbons (PAHs) discharged from the oil industry,3 the disposal of electronic waste,4 smelting in mining areas,5,6 fuel wastewater,7 and coal coking.8Among the several heavy metals and refractory organic pollutants in the industrial soil, antimony (Sb) is used in the production of flame retardants, lead-acid batteries, paint coatings, and plastic ceramics, and poses an ecological threat to soil organisms.9 The background content of Sb in the soil ranges from 0.38 mg kg−1 to 2.98 mg kg−1, and its risk screening value is 20 mg kg−1 for the development land in China.10 The maximum allowable Sb content recommended by the Word Health Organization is 3.5 mg kg−1.11 However, the soil Sb content has reached several hundred mg kg−1 in some urban industrial areas.12 Simultaneously, the soil PAH content (especially in industrialized soil) has increased and ranges between 0.004–186 mg kg−1 due to anthropogenic emissions over the last three decades.13 Among the PAHs, naphthalene (C10H8, Nap) pollution is the most serious in urban industrial soil, especially in coking plants and metal smelters.14 As Nap is adsorbed to soil particles or combined with other pollutants, its melting and boiling point increases.15 Therefore, soil contamination, especially by a combination of pollutants, needs to be controlled and remediated urgently.
Numerous remediation technologies have been explored for HMs-contaminated soil, such as solidification/stabilization, electric remediation, chemical leaching and phytoremediation.16–18 Among these, the leaching remediation technology has been widely used for HM-contaminated soils found in metal smelting units and urban industrial parks19–21 as it effectively separates and removes heavy metals from contaminated soil through desorption or solubilization, resulting in high remediation efficiency within a short duration.22 Various other technologies, such as heating, soil washing/solvent extraction, chemical oxidation, bioremediation and integrated remedial approaches, have also been explored for the remediation of PAHs-contaminated field soils.23 Of these, solvent extraction is a viable cleanup technique based on the desorption of PAHs from the solid matrix using organic solvents and surfactants, which may be non-toxic and serve as biodegradable flushing agents.24 However, most of the eluents are chemically synthesized polymer compounds, difficult to degrade in the soil, and easily rise secondary pollution risk, affecting soil health.25 In addition, the leaching technology is often mainly aimed at the remediation of HMs-contaminated soil and is mostly not inefficient for organic pollutant-contaminated soil.26
Therefore, there is an urgency to develop more economical and environment-friendly agents and surfactants for leaching heavy metals from contaminated soil. Currently, green and biodegradable eluents, such as cyclodextrin (CD), rhamnolipid,27 and saponin,28 are the research hotspots toward HMs-contaminated soil remediation through leaching. Of these, CD is a high-performing surfactant with a structure containing hydrophilic outer edges and a hydrophobic inner cavity. In addition, lots of functional groups are present on the CD surface, such as the carboxyl group, mercapto group, and sulfobutyl group, which complex with heavy metals.29 Hence, CD and its derivatives are deemed as eco-friend leaching agents and promising for the remediation of contaminated soil due to their high efficiency, low cost and avoidance of secondary pollution; however, further studies are needed to explore their efficiency and mechanisms toward removing HMs and PAHs from combined contaminated soil.
The objectives of this study are: (1) to gain optimum parameters for Sb and Nap removal from urban contaminated soil using the modified CD, namely carboxymethyl-β-cyclodextrin (CMCD); (2) to probe the remediation potential of CMCD leaching against Sb–Nap combined contaminated soil; (3) to assess the remediation of Sb–Nap combined contaminated soil by CMCD through FTIR and 1H NMR analyses. These results would provide novel ideas for remediating soil contaminated by a combination of HMs and PAHs.
2. Materials and methods
2.1. Soil sampling and preparation
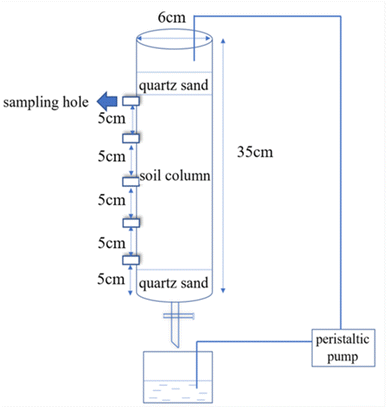
The combined contaminated soil sample was taken from Taopu Industrial Park, Shanghai City. After removing the debris and stones, these samples were dried naturally and passed through a 40-mesh sieve for further chemical analysis. The contents of Sb and Nap in the tested combined polluted soil were 101.47 mg kg−1 and 98.45 mg kg−1, respectively. In addition, the tested soil was yellow-brown with a soil organic matter content of 11.40 g kg−1, moisture content of 12.6%, pH value of 7.9 and a cation exchange capacity of 8.60 cmol kg−1.The soil column leaching equipment was mainly composed of a peristaltic pump and a leaching column (Fig. 1). The design parameters of the soil column were as follows: inner diameter = 6.00 cm; height = 35.00 cm, and 5 sampling holes were installed at every 5.00 cm interval. After the test soil samples were filled into the column, 100 mL of a 1 g L−1 potassium pyroantimonate solution in ethanol was added to the tested soil to ensure that the water level was higher than the soil surface, stirred and dried naturally in the dark for two weeks.
2.2. Batch experiments
To obtain the optimal leaching parameters through pilot experiments at a solid/liquid ratio of 1![[thin space (1/6-em)]](https://www.rsc.org/images/entities/char_2009.gif) :
:![[thin space (1/6-em)]](https://www.rsc.org/images/entities/char_2009.gif) 40 (w/v),30,31 1.00 g of the prepared contaminated soil was added to beakers, and 40.00 mL of 0.50–30.00 g L−1 CMCD solution was added. The pH values were adjusted between 2–9, the temperature was controlled from 10 °C to 60 °C, and the beakers were shaken at 160 rpm for 24 h. At the end of these experiments, 5.00 mL of each supernatant was taken to analyze the Sb contents; another 5.00 mL of the supernatant was taken and mixed with 20.00 mL extraction solution (methanol
40 (w/v),30,31 1.00 g of the prepared contaminated soil was added to beakers, and 40.00 mL of 0.50–30.00 g L−1 CMCD solution was added. The pH values were adjusted between 2–9, the temperature was controlled from 10 °C to 60 °C, and the beakers were shaken at 160 rpm for 24 h. At the end of these experiments, 5.00 mL of each supernatant was taken to analyze the Sb contents; another 5.00 mL of the supernatant was taken and mixed with 20.00 mL extraction solution (methanol![[thin space (1/6-em)]](https://www.rsc.org/images/entities/char_2009.gif) :
:![[thin space (1/6-em)]](https://www.rsc.org/images/entities/char_2009.gif) H2O = 10
H2O = 10![[thin space (1/6-em)]](https://www.rsc.org/images/entities/char_2009.gif) :
:![[thin space (1/6-em)]](https://www.rsc.org/images/entities/char_2009.gif) 10) to measure the Nap content.
10) to measure the Nap content.
2.3. The soil column leaching experiment
The tested soil was filled in the soil column, and the optimal CMCD content of 15.00 g L−1 (selected based on pilot experiments) was added into the column to ensure an appropriate water level. We conducted leaching experiments continuously and at intervals, as detailed below: 1760.00 mL CMCD solution was continuously pumped into the soil column, and the eluent samples were collected every 10 min at the five holes. In the interval leaching experiment, 880.00 mL of the CMCD solution was injected into the soil column first, and then another 880.00 mL was pumped into the soil column after 12 h. We also collected the effluent samples every 10 min at the five holes. The remaining Sb and Nap contents in the effluent were measured. In addition, soil column penetration curves were analyzed at the end of the leaching experiment.2.4. Determination of the Sb and Nap concentrations
The total Sb content in the soil was determined by acid digestion, as described by Verbeeck.32 Briefly, 50 mg of soil was weighed into Savillex beakers with screw caps (Savillex, Eden Prairie, MN, USA); HNO3 (65%), HClO4 (70%) and HF (48%) were added for digestion in the closed system, which was then evaporated to a near-dry state, and the residual was dissolved in 2.5 M HCl. The Sb content in the digest was determined by ICP-MS (Agilent 720ES) at m/z = 121. A standard sample (PACS-2 marine sediment, National Research Council of Canada, Ottawa, Canada) was also analyzed for quality control.The soil Nap content was determined using the high-performance gas chromatography method described by Krauss33 with some modifications. Briefly, 10 g of the soil sample was weighed into a tube, and Nap in the tested soil was extracted by an accelerated solvent analyzer (Dionex ASE-300) with 1![[thin space (1/6-em)]](https://www.rsc.org/images/entities/char_2009.gif) :
:![[thin space (1/6-em)]](https://www.rsc.org/images/entities/char_2009.gif) 1 dichloromethane acetone as the extraction solution. The extraction temperature was 140 °C, and the pressure was 1.03 × 10⁷ Pa. The sample was preheated for 5 min, extracted statically for 5 min, and purified on a silica gel chromatography column. The Nap content in the filtrate was analyzed by an Agilent 7890GC-5975MS equipped with a 3.9 mm × 200 mm XDBC18 column. The limit of detection (LOD) for Nap determination was 10 ng kg−1, and the average recoveries ranged from 82.2% to 114.2% with relative standard deviations (RSDs) of 4.1–7.2%.
1 dichloromethane acetone as the extraction solution. The extraction temperature was 140 °C, and the pressure was 1.03 × 10⁷ Pa. The sample was preheated for 5 min, extracted statically for 5 min, and purified on a silica gel chromatography column. The Nap content in the filtrate was analyzed by an Agilent 7890GC-5975MS equipped with a 3.9 mm × 200 mm XDBC18 column. The limit of detection (LOD) for Nap determination was 10 ng kg−1, and the average recoveries ranged from 82.2% to 114.2% with relative standard deviations (RSDs) of 4.1–7.2%.
2.5. The mechanisms of Sb and Nap removal and characterization of CMCD-Sb–Nap
In order to clarify the mechanisms of Sb and Nap removal from the combined contaminated soil, 1.00 g tested soil and 40.00 mL of an 8 g L−1 CMCD solution were added to a beaker, the pH was adjusted to 4, and shaken at 160 rpm for 24 h at 25 °C. The tested sample was evaporated and concentrated by nitrogen purging, and the residue was freeze-dried to achieve the complexation of CMCD-Sb–Nap. The FTIR spectra of CMCD and the prepared CMCD-Sb–Nap were obtained on a TENSOR 37 (Brock, Swiss) by using the potassium bromide tablet method, with a resolution of 4 cm−1 in the full scanning range of 4000–400 cm−1. In addition, CMCD and the prepared CMCD-Sb–Nap were dissolved in D2O at the concentrations of 5, 10, 20, 40 and 100 g L−1, and their NMR spectra were analyzed on an NMR (Fourier 80, Bruker, Germany) spectrometer. The conditions were set as 400 MHz, a temperature of 298 K, and the internal standard was the deuterium solvent reagent.3. Results and discussion
3.1. The effect of CMCD concentration on Sb and Nap removal
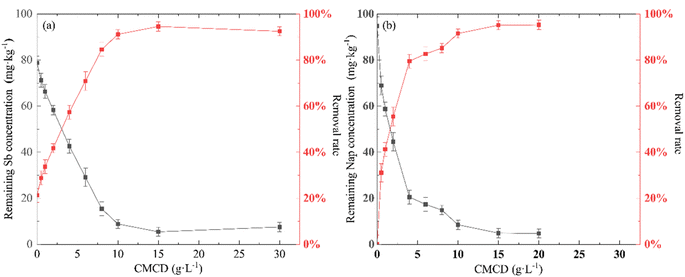
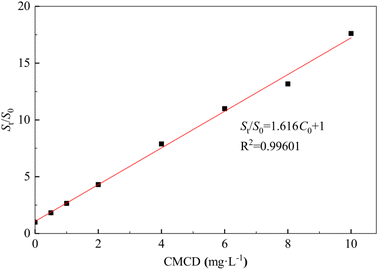
The removal efficiency of Sb from the contaminated soil increased from 20.17% in the control treatment (no CMCD) to 94.82% at a CMCD concentration of 15.00 g L−1, and we found that the removal efficiency of Sb increased with an increase in CMCD concentration (Fig. 2). The possible reason is the presence of functional groups on CMCD, such as carboxymethyl and hydroxyl, which would complex with Sb in the contaminated soil. In addition, the viscosity of the leaching solution increased as the CMCD concentration was increased beyond 15.00 g L−1, causing the removal rate to remain at a stable level.A similar removal trend of Nap from contaminated soil was observed; the maximum removal efficiency of Nap reached 93.59% at the CMCD concentration of 10.00 g L−1, and we also found that less Nap was removed at low CMCD concentrations (Fig. 2). The solubility of Nap in CMCD could explain the above phenomena; we found that the solubility of Nap was linearly related to low CMCD concentrations, and the fitting result showed that the solubility of Nap in CMCD at 10.00 g L−1 was 17 times higher than that in water (Fig. 3).
However, the solubility of Nap in CMCD conformed with the equation (StS0 = KsC0 + 1) at CMCD concentrations higher than 10 g L−1.34 Here, C0 is the initial concentration of the CMCD solution (mg L−1), St is the solubility of Nap in the CMCD solution (mg L−1), S0 is the solubility of Nap in water (mg L−1), Ks is the constant of inclusion between CMCD and Nap. This indicated that the adsorption capacity of CMCD was not fully utilized. Hence, it is necessary to explore high-performing leaching agents for removing PAHs from contaminated soil.
3.2. The effects of pH and temperature on Sb and Nap removal
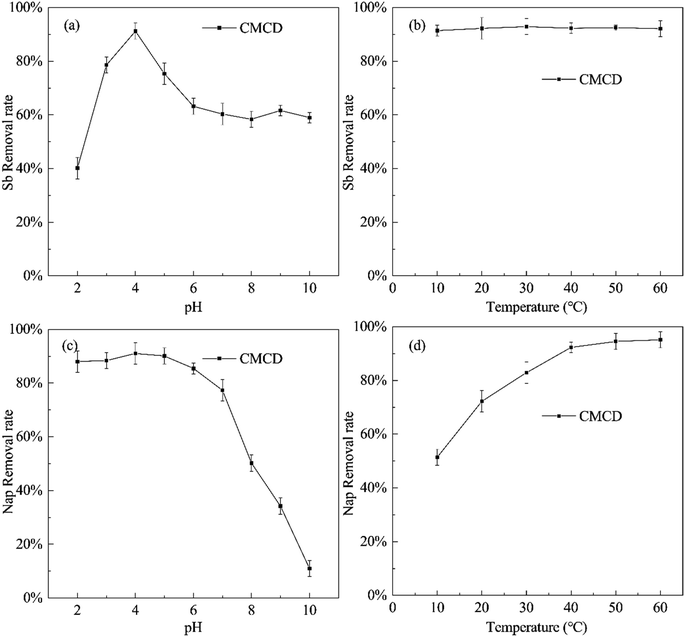
The removal efficiency of Sb varied with changing pH values and temperatures (at a CMCD concentration of 15.00 g L−1), and the highest removal efficiency of Sb was observed at pH = 4, reaching 91.23% (Fig. 4). In soil, generally, Sb(V) mainly exists in the form of Sb(OH)6− or SbO3− at pH greater than 7.0;35 and Sb(OH)6− complexes with CMCD and is subsequently leached from the contaminated soil. Under weakly acidic conditions, most of Sb(V) would exist in the form of low polymer Sb12(OH)644−,36 which complexes with the carboxyl groups and hydroxyl groups on the surface of CMCD and forms stable inner layer complexation; this complexation reaction is stronger compared to electrostatic adsorption. However, the carboxyl groups and hydroxyl groups on the surface of CMCD reduce as pH is lowered, and a large amount of H+ would compete with Sb5+, inhibiting the complexation of Sb with CMCD. In addition, we found that the temperature variations had little effect on the removal of Sb by CMCD leaching.We also found that the Nap removal efficiency of CMCD increased with increasing pH under acidic and neutral conditions, while it decreased rapidly at pH > 7.0 (Fig. 4). The possible reason is the destruction of the cavity structure of CMCD under strong alkaline conditions,37 resulting in the decreased inclusion ability for Nap. Simultaneously, in the range of 10–60 °C, the removal rate of Nap increased at higher temperatures, which suggested that the adsorption of Nap by CMCD was endothermic. The temperature would alter the time for achieving PAH adsorption equilibrium in the soil, and an increase in temperature would enhance Nap desorption from the contaminated soil.
3.3. The effects of leaching rate on Sb and Nap removal
The removal trends of Sb and Nap were investigated at the leaching flow rates of 0.66 mL min−1, 2 mL min−1, 4 mL min−1 and 10 mL min−1, and the cumulative quantities of Sb and Nap removed from the combined contaminated soil were calculated (Fig. 5). We found that Sb and Nap could be effectively removed from the combined contaminated soil column under a CMCD concentration of 15 g L−1, and they displayed similar removal trends, that is, the effluent Sb and Nap contents increased rapidly before 1 pore volume (220 mL) and then decreased to the lowest value.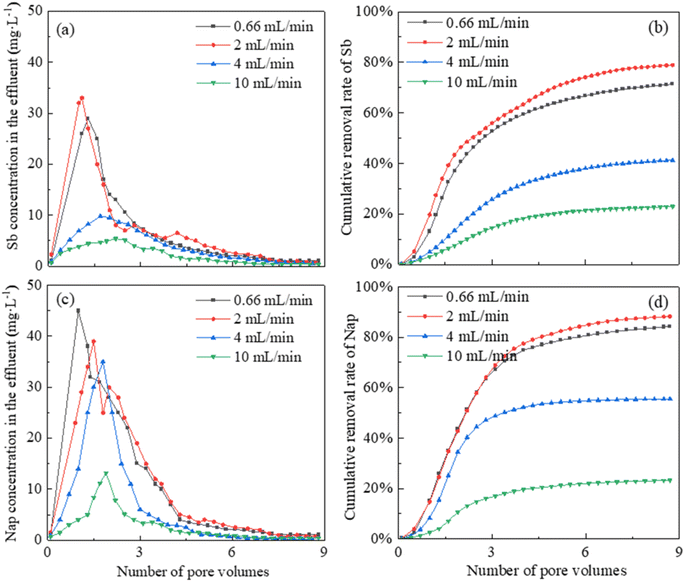 | ||
| Fig. 5 The effects of leaching rate on the effluent Sb and Nap contents and the cumulative removal efficiencies. | ||
In addition, the effluent Sb concentrations reached the peak values of 29.51, 33.67, 9.81, and 5.44 mg L−1 at the leaching rates of 0.66 mL min−1, 2 mL min−1, 4 mL min−1 and 10 mL min−1, respectively. After leaching with 1760.00 mL (8 pore volumes) of CMCD solution, 71.43%, 78.93%, 41.25%, and 22.93% of total Sb were removed from the contaminated soil column at the rates of 0.66 mL min−1, 2.00 mL min−1, 4.00 mL min−1, and 10.00 mL min−1, respectively. Similarly, the effluent Nap concentrations reached the peak values of 45.11, 39.03, 35.69 and 13.25 mg L−1 at the flowing rates of 0.66 mL min−1, 2 mL min−1, 4 mL min−1 and 10 mL min−1, respectively. After leaching with 1760.00 mL of CMCD solution, 84.29%, 88.27%, 55.52%, and 23.29% of Nap were removed at the rates of 0.66 mL min−1, 2.00 mL min−1, 4.00 mL min−1, and 10.00 mL min−1, respectively.
The leaching rate was one of the key factors influencing the removal efficiency of the combined contaminants. Low leaching rates ensured the diffusion of CMCD and complete contact time with the pollutants in the contaminated soil, which facilitated Sb and Nap to be complexed by the functional groups on the surface or interior of CMCD. However, the high leaching rates decreased the pollutant removal efficiency due to the short contact time. Therefore, the removal efficiencies at the rates of 0.66 mL min−1 and 2.00 mL min−1 were higher than those at the rates of 4.00 mL min−1 and 10.00 mL min−1 in this study. However, the CMCD solution would also be retained in the tested soil column at slower rates, which would decrease the removal efficiency of Sb and Nap. Considering these, the optimal leaching rate was chosen as 2.00 mL min−1 in this study.
3.4. The effects of the leaching method on Sb and Nap removal
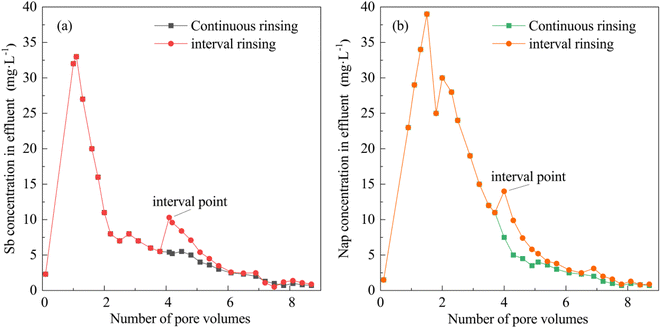
The effluent Sb and Nap concentrations were analyzed during continuous and interval leaching processes (Fig. 6). The interval points were observed in the interval leaching curves of Sb and Nap. We also found that the effluent Sb and Nap concentrations suddenly increased at the interval points, and stayed slightly higher at the second stage compared with those observed in continuous leaching. The sudden increase in the effluent contaminants is caused by the desorption of complexed Sb and Nap at the second stage of leaching, which suggests that the interval leaching facilitated the removal of the desorbed pollutants from the contaminated soil column. In this study, the cumulative Sb and Nap quantities removed from the combined contaminated soil increased by 3.4% and 4.1% while using interval leaching compared with those achieved by continuous leaching.3.5. The Sb and Nap permeability curves and their removal mechanisms
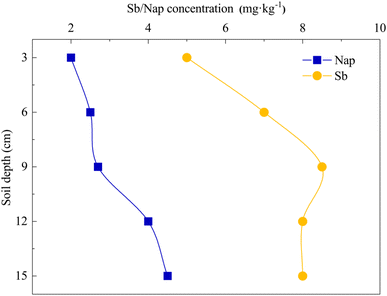
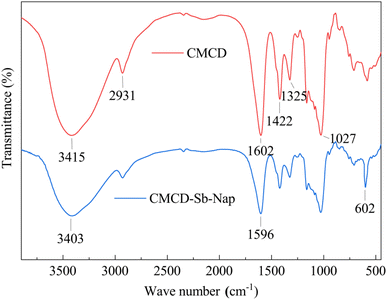
The Sb and Nap permeabilities were assessed by measuring the retained Sb and Nap concentrations in the surface soil (0–15 cm) at the end of the leaching experiment (Fig. 7). The permeability results showed that the remaining Sb and Nap migrate to the lower layer of the soil column. Sb in the upper (0–6 cm) soil was mainly transported to the middle layer (9–12 cm), while Nap mainly migrated from the middle-upper layer to the lower layer (12–15 cm), and the migration distance of Nap was longer than that of Sb. In addition, we also found that the surface soil accounted for 82.94% and 91.57% of removed Sb and Nap, respectively. These indicate that the CMCD solution had a stronger complexation ability with Nap compared with Sb, and the strong solubilization enabled Nap transport to the lower soil layer.FTIR spectra showed that there were lots of functional groups on CMCD, such as –CH3, –CH, –OH, –COO–, C–O–C and O–H (Fig. 8), and we also found that the peak of the hydroxyl groups shifted to low frequencies and the intensity became weak in CMCD-Sb–Nap. This indicated that O–H played an important role in the complexation and formation of the O–Sb(V) bond.38,39 In addition, variations in –COO– were observed in the FTIR spectrum of CMCD-Sb–Nap, which could indicate the –CO–Sb(V) bond.40–42 However, we found that no relative groups complexed with Nap according to the FTIR spectrum, which indicates that Nap could be enclosed by the CMCD solution.
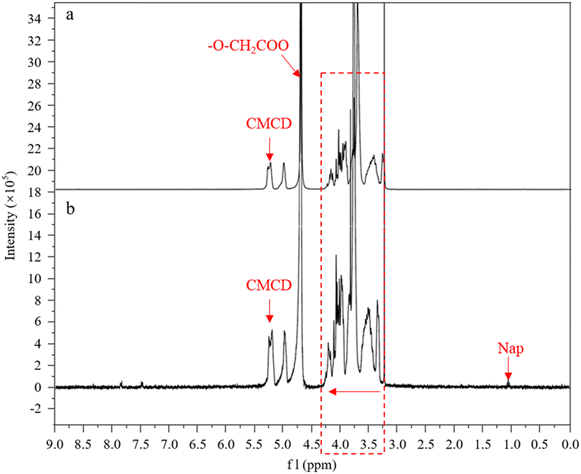
In order to further understand the mechanisms of CMCD enclosing Nap, the 1H-NMR spectra of CMCD and its inclusion form CMCD-Sb–Nap were comparatively analyzed (Fig. 9). In the 1H NMR spectrum of CMCD, a series of hydrogen signals were observed, including H-1 representing the cyclodextrin glucose residue at 5.22 ppm, –O–CH2COO at 4.77 ppm, and other hydrogen peaks in the range of 3.20–4.30 ppm. Compared with CMCD, there were many signals within the 7.00–8.00 ppm range, and the signal of Nap appeared at near 1.10 ppm in the CMCD-Sb–Nap spectrum,43 which confirmed that Nap had been incorporated into CMCD during the process of leaching. However, the chemical shift of a few CMCD-Sb–Nap peaks was observed compared to CMCD, and no chemical bond was formed during the inclusion of Nap. This suggests that Nap was incorporated into CMCD due to weak intermolecular forces, such as hydrogen bonds, hydrophobic force, and van der Waals force. In addition, we also found that H-1 was shifted slightly to the low-field direction, while the signals in the range of 3.20–4.30 ppm were shifted to the high-field direction with the inclusion of Nap in the CMCD cavity. These indicated that Nap was incorporated into the narrow-mouth segment of CMCD, and the interactions between CMCD and Nap were stronger compared with those of other surfactants.44
4. Conclusions
In this study, a series of batch experiments were conducted to gain the optimal parameters for removing Sb and Nap from a combined contaminated soil sample, and their removal efficiency was assessed by soil column leaching experiments. We found that CMCD concentration, pH and the leaching method were the important factors impacting the removal of Sb and Nap, and the best removal efficiency of Sb and Nap could be reached by interval leaching with a CMCD concentration of 15 g L−1, the leaching rate of 2.00 mL min−1 and at pH 4. In addition, the results showed that 94.82% and 93.59% of Sb and Nap were removed from the combined contaminated soil column under the above optimal parameters, respectively.Furthermore, the mechanisms of Sb and Nap removal by CMCD leaching relied on complexation and inclusion. During CMCD leaching, the functional groups, including –OH and –COOC–, present on the surface of CMCD complex with Sb and form the Sb(V)–O bond. Simultaneously, Nap is enclosed into the intra-cavity and bonds with CMCD at its narrow mouth. The above results indicate that CMCD is a good leaching agent for remediating soil contaminated by a combination of heavy metals and polycyclic aromatic hydrocarbons.
Conflicts of interest
There are no conflicts of interest to declare.Acknowledgements
This study was financial supported by the National Key Research and Development Program (No. 2019YFC1805201). The authors are grateful to Mrs Hao Chen and Qianfeng Xiao for their help with characterization of CMCD and the compound of CMCD-Sb–Nap.References
- A. Parviainen, A. Vázquez-arias and P. Juan, Environ. Res., 2022, 206, 112514 CrossRef CAS PubMed.
- C. Li, H. Wang, X. Liao, R. Xiao, K. Liu, J. Bai, B. Li and Q. He, J. Hazard. Mater., 2022, 424, 127312 CrossRef CAS PubMed.
- G. Shen, Y. Lu, Q. Zhou and J. Hong, Chemosphere, 2005, 61(8), 1175–1182 CrossRef CAS PubMed.
- P. Thavamani, M. Megharaj and R. Naidu, Environ. Monit. Assess., 2012, 184(6), 3875 CrossRef CAS PubMed.
- Q. Wu, J. Leung, X. Geng, S. Chen, X. Huang, H. Li, Z. Huang, L. Zhu, J. Chen and Y. Lu, Sci. Total Environ., 2015, 506–507, 217–225 CrossRef CAS PubMed.
- Y. He, Z. Han, F. Wu, J. Xiong and P. Wu, Environ. Contam. Toxicol., 2021, 107(6), 1–10 Search PubMed.
- M. H. Wong, S. C. Wu, W. J. Deng, X. Z. Yu, Q. Luo, A. Leung, C. Wong, W. Luksemburg and A. S. Wong, Environ. Pollut., 2007, 149(2), 131–140 CrossRef CAS PubMed.
- J. N. Brown and B. M. Peake, Sci. Total Environ., 2006, 359(1–3), 145–155 CrossRef CAS PubMed.
- L. P. Egodawatta, G. K. Macoustra and L. K. Ngo, Environ. Sci.: Processes Impacts, 2018, 20, 833–844 RSC.
- J. X. Fan, Y. J. Wang, T. T. Fan, F. Dang and D. M. Zhou, Chemosphere, 2016, 147, 44–51 CrossRef CAS PubMed.
- W. F. Donahue, E. W. Allen and D. W. Schindler, J. Paleolimnol., 2006, 35(1), 111–128 CrossRef.
- M. Filella, N. Belzile and Y. W. Chen, Earth-Sci. Rev., 2003, 59(1), 265–285 Search PubMed.
- W. Wilcke, Geoderma, 2007, 141(3–4), 157–166 CrossRef CAS.
- S. N. Meijer, T. Harner, P. A. Helm, C. J. Halsall, A. E. Johnston and K. C. Jones, Environ. Sci. Technol., 2001, 35, 4205–4213 CrossRef CAS PubMed.
- J. H. Zhang, J. H. Zeng and M. C. He, J. Environ. Sci., 2009, 21, 667–674 CrossRef CAS PubMed.
- L. W. Wang, J. Rinklebe, F. M. G. Tack and D. Y. Hou, Soil Use Manage., 2021, 27, 936–963 CrossRef.
- S. Rajendran, T. A. K. Priya, K. S. Khoo, T. K. A. Hoang, H. S. Ng, H. S. H. Munawaroh, C. Karaman, Y. Orooji and P. L. Show, Chemosphere, 2022, 287, 132369 CrossRef CAS PubMed.
- A. Valente, J. Environ. Manage., 2019, 246, 101–118 CrossRef PubMed.
- A. Grzywaczyk, W. Smulek, G. Smulek, M. Slachcinski and E. Kaczorek, Environ. Technol. Innovation, 2021, 24, 101926 CrossRef CAS.
- X. Ke, F. J. Zhang, Y. Zhou, H. J. Zhang, G. L. Guo and Y. Tian, Chemosphere, 2020, 255, 126690 CrossRef CAS PubMed.
- Y. L. Wang, Y. M. Xu, X. F. Liang, Y. B. Sun, Q. Q. Huang and Y. Y. Peng, Sci. Total Environ., 2020, 710, 135964 CrossRef CAS PubMed.
- T. B. Boving and M. L. Brusseau, J. Contam. Hydrol., 2001, 42(1), 51–67 CrossRef.
- S. Kuppusamy, P. Thavamani, K. Venkateswarlu, Y. B. Lee, R. Naidu and M. Megharaj, Chemosphere, 2017, 168(2), 944–968 CrossRef CAS PubMed.
- E. Mousset, M. A. Oturan, E. D. V. Hullebusch, G. Guibaud and G. Esposito, Crit. Rev. Environ. Sci. Technol., 2013, 44(7), 705–795 CrossRef.
- K. Wang, Y. H. Liu, Z. G. Song, Z. H. Khan and W. W. Qiu, Ecotoxicol. Environ. Saf., 2009, 182, 109399 CrossRef PubMed.
- S. Gitipour, A. Mohebban, S. Ghasemi, M. Abdollahinejad and B. Abdollahinejad, Int. J. Environ. Sci. Technol., 2020, 17, 683–694 CrossRef CAS.
- A. Bayata, Am. J. Environ. Prot., 2020, 9, 6–12 Search PubMed.
- H. Khodaverdiloo, F. X. Han, R. H. Taghlidabad, A. Karimi and J. A. Kazery, Arid Land Res. Manage., 2020, 34(9), 1–31 Search PubMed.
- M. Tan, J. Ma, S. Zhang, G. Li and J. Qu, J. Hazard. Mater., 2016, 302, 250–261 CrossRef PubMed.
- M. E. Skold, G. D. Thyne, J. W. Drexler, D. L. Macalady and J. E. Mccray, Environ. Sci. Technol., 2008, 42(23), 8930–8934 CrossRef CAS PubMed.
- M. Verma, I. Lee, Y. Hong, V. Kumar and H. Kim, Environ. Pollut., 2022, 292(1), 118447 CrossRef CAS PubMed.
- M. Verbeeck, Y. Thiry and E. Smolders, Environ. Pollut., 2020, 257, 113566 CrossRef CAS PubMed.
- M. Krauss and W. Wilcke, Environ. Pollut., 2003, 122(1), 75–89 CrossRef CAS PubMed.
- S. Ko, M. A. Schlautman and E. R. Carraway, Environ. Sci. Technol., 2019, 33(16), 2765–2770 CrossRef.
- J. Buschmann and L. Sigg, Environ. Sci. Technol., 2004, 38(17), 4535–4541 CrossRef CAS PubMed.
- S. J. Zhou, Y. J. Du, Y. S. Feng, H. Y. Sun, W. Y. Xia and H. Yuan, Chemosphere, 2022, 301, 134644 CrossRef CAS PubMed.
- M. E. Deary, C. C. Ekumankama and S. P. Cummings, J. Hazard. Mater., 2016, 307, 240–252 CrossRef CAS PubMed.
- M. Filella and P. M. May, Geochim. Cosmochim. Acta, 2003, 67(21), 4013–4031 CrossRef CAS.
- V. Thirumal, R. Yuvakkumar, P. S. Kumar, S. P. Keerthana, G. Ravi, M. Thambidurai, C. Dang and D. Velauthapillai, Environ. Res., 2022, 210(7), 112904 CrossRef CAS PubMed.
- L. Li, L. Liao, B. Wang, W. Li, T. Liu, P. Wu, Q. Xu and S. Liu, Environ. Pollut., 2022, 301(5), 119032 CrossRef CAS PubMed.
- Y. Takahashi, K. Sakuma, T. Itai, G. Zheng and S. Mitsunobu, Environ. Sci. Technol., 2008, 42(24), 9045–9050 CrossRef CAS PubMed.
- C. J. Yang, Q. R. Zeng, Y. Z. Wang, B. S. Liao, J. Sun, H. Shi and X. D. Chen, J. Environ. Sci., 2010, 22(12), 1910–1915 CrossRef CAS PubMed.
- L. J. Xiang and X. Zhang, Desalin. Water Treat., 2019, 170, 138–147 CrossRef CAS.
- W. L. Song, Q. G. Huang and L. S. Wang, Chemosphere, 1999, 38(4), 693 CrossRef CAS PubMed.
| This journal is © The Royal Society of Chemistry 2023 |

