DOI:
10.1039/D3RA00552F
(Paper)
RSC Adv., 2023,
13, 6051-6064
Nano–bio interaction between human immunoglobulin G and nontoxic, near-infrared emitting water-borne silicon quantum dot micelles†
Received
26th January 2023
, Accepted 14th February 2023
First published on 20th February 2023
Abstract
In recent years, the field of nanomaterials has exponentially expanded with versatile biological applications. However, one of the roadblocks to their clinical translation is the critical knowledge gap about how the nanomaterials interact with the biological microenvironment (nano–bio interactions). When nanomaterials are used as drug carriers or contrast agents for biological imaging, the nano–bio interaction-mediated protein conformational changes and misfolding could lead to disease-related molecular alterations and/or cell death. Here, we studied the conformation changes of human immunoglobulin G (IgG) upon interaction with silicon quantum dots functionalized with 1-decene, Pluronic-F127 (SiQD-De/F127 micelles) using UV-visible, fluorescence steady state and excited state kinetics, circular dichroism, and molecular modeling. Decene monolayer terminated SiQDs are accumulated inside the Pluronic F127 shells to form SiQD-De/F127 micelles and were shown to bind strongly with IgG. In addition, biological evaluation studies in cell lines (HeLa, Fibroblast) and medaka fish (eggs and larvae) showed enhanced uptake and minimal cytotoxicity. Our results substantiate that engineered QDs obviating the protein conformational changes could have adept bioefficacy.
Introduction
Recent advances in precision medicine primarily rely on developing nanomaterials as diagnostics and therapeutics. In particular, several functionalized nanoparticles have been developed as contrasting agents for in vivo and in vitro imaging. In recent decades, biologists have been interested in near-infrared (NIR) fluorescent imaging because NIR light can penetrate human tissues (>700 nm) without inducing pathogenic molecular alterations.1–3 Therefore, NIR-based fluorescent probes are preferred to visualize the morphology of cells and even organelles.4 Semiconductor quantum dots (QDs) play a significant role in biomedical applications such as real-time tissue imaging agents, biosensors and therapeutic agents.5,6 Compared to commercial fluorescent probes, QD probes exhibit better stability against photobleaching, high quantum yield, tunable emission, and broad absorption spectral ranges.7,8 However, it is difficult to dissolve semiconductor QDs in water; hence, it is necessary need to functionalize the surface of the QD probes with water-soluble materials.9 While extensive studies have been focused on the imaging efficacy of functionalized QD probes, only a few studies have been conducted on their interaction with biomacromolecules.10,11 Nanomaterial interaction with the biological microenvironment (nano–bio interaction) is critical to harness the excellent fluorescent properties of QDs and use them in deep-tissue imaging, drug delivery, and intra-cellular organelle tracking.12,13
The multi-modality imaging capability of QDs has been extensively harnessed as theranostic agents in chronic systemic inflammatory diseases such as ‘Rheumatoid Arthritis (RA)’. Patients with RA are known to have elevated levels of immunoglobulins than the control population. In particular, immunoglobulin G (IgG), the second most abundant plasma protein in human blood, is known to be 0.6 g L−1 higher in positive RA than the controls.14 Human IgG has a molecular weight of about 150 kDa and comprises two heavy and light chains linked by disulfide bridges.15 Nanoparticles (NP) interact with IgG after injection into the bloodstream and often comprise protein corona.16,17 In nonspecific binding, IgG undergoes conformational changes with different hydrophobic and hydrophilic surfaces due to the tendency for the nanoparticle micelles to find a more favorable energy state.18 When NPs like QD probes are injected into the bloodstream, the heavy metal ions are released and induce toxicity.19 After intravenous injection, biomolecules, primarily plasma proteins, cover the surfaces of NPs to form a protein corona.20,21 Concurrently, the adsorption of the protein on the corona micelles alters their secondary or tertiary structures, leading to toxicity.22 Cukalevski et al. studied protein-induced NP aggregation and discovered that IgG drives NP aggregation in blood serum and induces it in an unexpectedly concentration-dependent manner.23 Later, Hassan et al. investigated interactions between 13 immunoglobulin isotypes from human, bovine, and murine blood and gold nanoparticles.24 Lin et al. demonstrated that IgG effectively enhances the PL intensity and stability of amphiphilic poly(acrylic acid) -coated CdSe/ZnS core–shell QDs.25 Silicon QDs (Si-QDs) gets proclaimed to have better clinical translation prospects in RA as bioimaging agents owing to their biocompatible properties. However, until now, no studies have been available to show the interaction of Si-QDs or their functionalized derivatives with biomolecules like IgG. Here, we prepared non-toxic (heavy metal ions free), water-borne NIR Si-QDs to elucidate the interaction mechanism with human IgG (Fig. 1). Furthermore, we verified their cellular uptake and viability with the live cells (HeLa and human dermal fibroblasts) and medaka fish (egg and larvae) as a proof-of-concept study to verify their biocompatibility as imaging agents in the in vitro and in vivo models.
 |
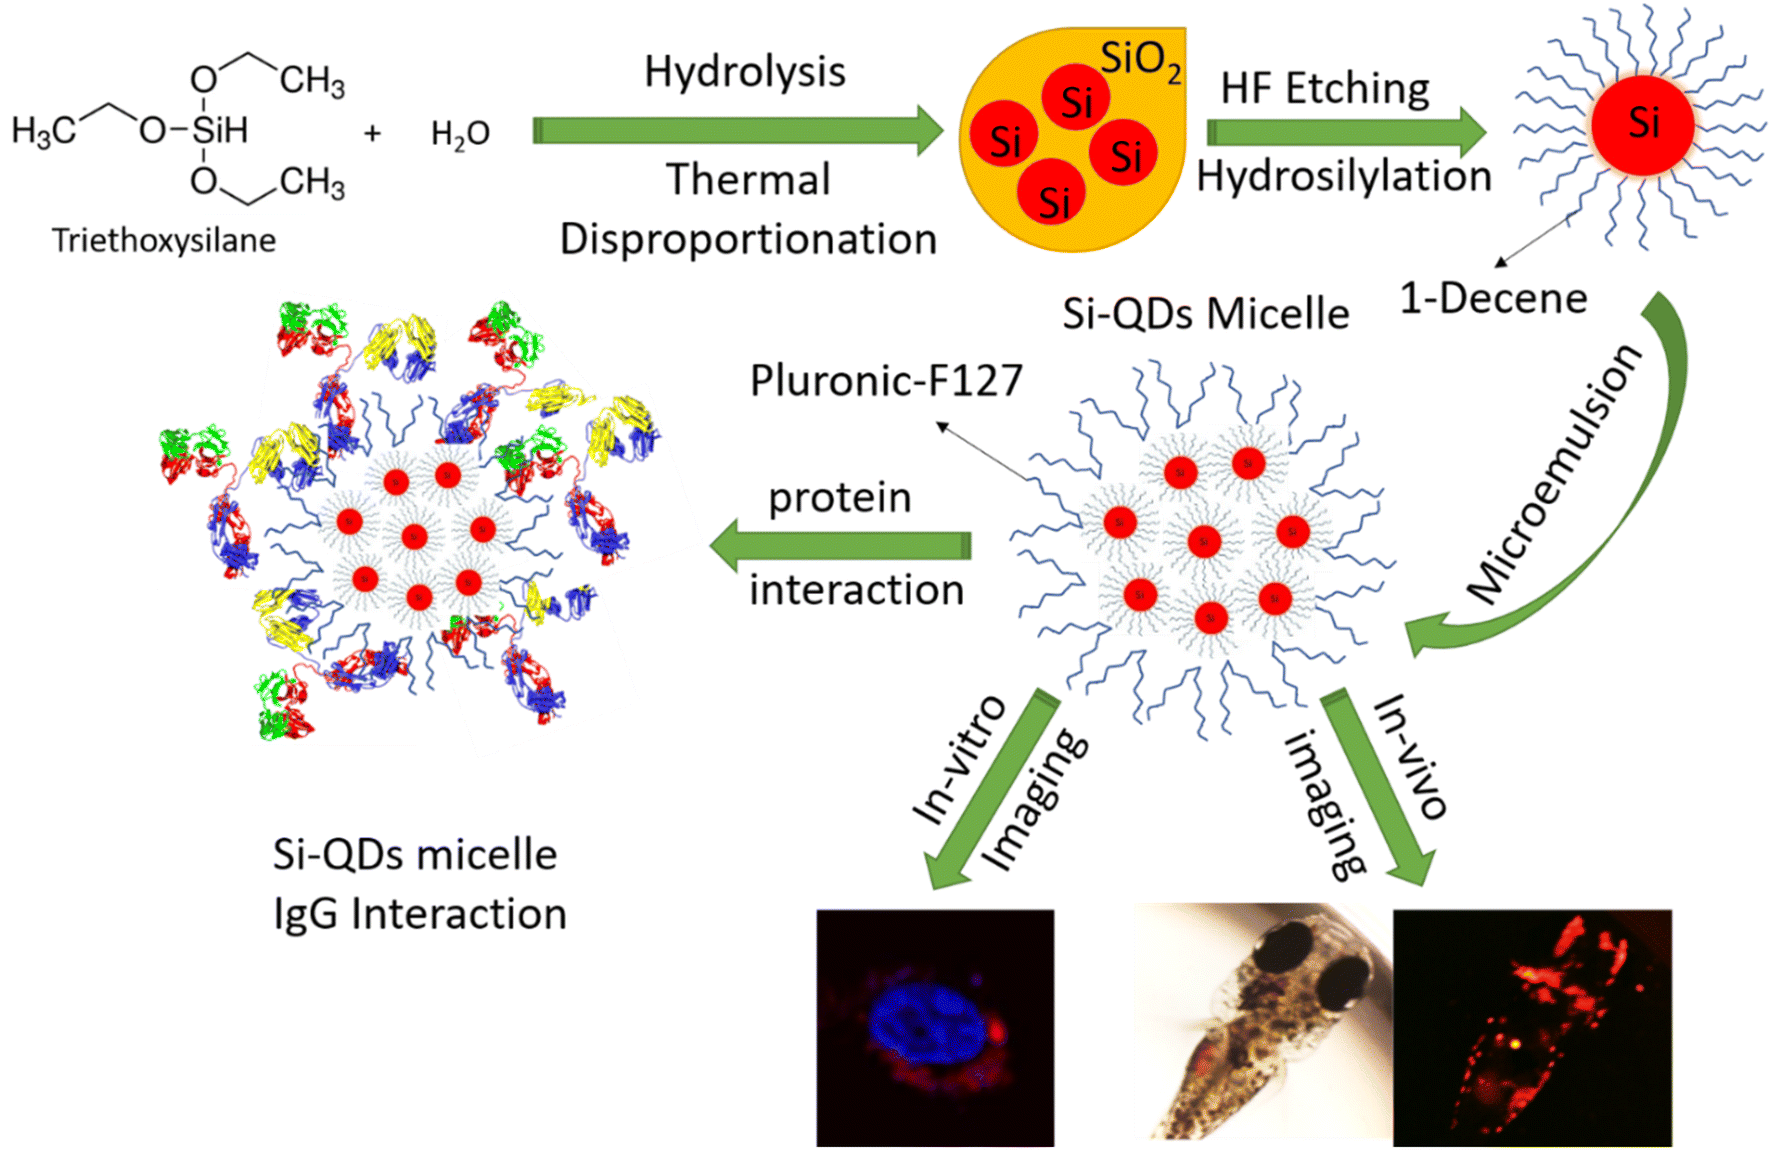
| | Fig. 1 The schematic diagram shows the silicon quantum dots production from the triethoxysilane precursor, hydrosilylation with 1-decene and functionalize with Pluronic-F127. The prepared SiQD-De/F127 micelle used as a biocompatible staining agent in an in vitro and in vivo model. Also, a two-dimensional picture shows IgG interaction on the surface of the SiQD-De/F127 micelle. | |
Experimental section
Materials
1-Decene, IgG from human serum was purchased from Sigma-Aldrich (I4506-10MG). Triethoxysilane (TES) received from Tokyo Chemical Industry. Wako Pure Chemical Industries (Tokyo, Japan) provided all other reagents and chemicals. Hydrofluoric acid was purchased from Kanto Chemical Japan, which is < 100 ppm metal impurity and 46–51% aqueous solution. We used deionized water from Sartorius (arium 611 UV) purifier (Sartorius AG, Goettingen, Germany). Normal human fibroblast cell lines (JCRB0527) and HeLa (JCRB9004) were purchased from the JCRB cell bank.
Production of Si-QDs
16 mL of TES was placed in a two-neck flask placed in an ice bath and stirred under an Ar atmosphere. Hydrochloric solution of pH 3 (32 mL) was added dropwise to the TES solution while stirring vigorously under Ar flow. The use of acidic water was needed to prevent deprotonation of the TES during the hydrolysis. We filtered the solution under reduced pressure. A white powder (hydrogen silsesquioxane) was rinsed with Milli-Q water until pH 7 and then dried overnight in a vacuum. After being moved to a quartz crucible, the dried powder was heated in a vacuum furnace. Five gas purges were then performed using 5%-H2/95%-Ar gas. The powder was thermally disproportionated at 1150 °C for 3 hours under a 5%-H2/95%-Ar atmosphere. The resulting brown powder was SiQD dispersed in a SiOx matrix.
Decene-terminated SiQD production
The SiQD/SiOx powder, 300 mg, was pulverized in an agate mortar with a pestle. The fine powder was placed in a 50 mL Teflon container. By agitating for 80 minutes in an acidic solution containing 8 mL of ethanol and 16 mL of 48% HF solution, the SiQDs were freed from the oxide matrix. The hydrogen-terminated SiQDs were collected at 15![[thin space (1/6-em)]](https://www.rsc.org/images/entities/char_2009.gif) 000 rpm centrifugation for 30 minutes and washed with ethanol twice and acetonitrile in that order. The resultant product dispersed in 1-decene was transferred to a two-neck flask under Ar atmosphere. The final product was heated at 170 °C for 2 hours in an atmosphere of Ar after being purged with Ar for 15 minutes at room temperature. Immediately following the reaction, the mixture was cooled to ambient temperature. High-performance liquid chromatography (HPLC) was used to purify the resulting decene-terminated SiQDs (SiQDs-De). Following drying under vacuum, the purified QDs were dissolved in toluene.
000 rpm centrifugation for 30 minutes and washed with ethanol twice and acetonitrile in that order. The resultant product dispersed in 1-decene was transferred to a two-neck flask under Ar atmosphere. The final product was heated at 170 °C for 2 hours in an atmosphere of Ar after being purged with Ar for 15 minutes at room temperature. Immediately following the reaction, the mixture was cooled to ambient temperature. High-performance liquid chromatography (HPLC) was used to purify the resulting decene-terminated SiQDs (SiQDs-De). Following drying under vacuum, the purified QDs were dissolved in toluene.
Production of SiQD-De/F127 micelles
10 mL of acidic water (0.1 N HCl) was used to dissolve 200 mg of pluronic F127, then stirred for one hour. In a vial, 1 mg of SiQDs-De was mixed with Pluronic F127 solution containing a screw bottle. The bottle was shaken for a few minutes vigorously to achieve emulsion formation; then, the screw bottle was opened to the air until it evaporated the toluene layer completely (∼48 hours) (Fig. S1(a)†). The leftover sample was treated with sonication for a short period and then transferred to a 14 KDa dialysis tube. Two hours later, the unreacted Pluronic F127 and HCl were removed by dialysis against water. The resultant sample looks like a milky solution. Further dilution with water is necessary for biological applications.
Characterization
JASCO V-650 spectrometer was used for UV-visible absorption spectra. Rigaku Smart Lab X-ray diffractometer (XRD) was used to obtain the SiQDs-De diffraction pattern. Tecnai G2 F30, a high-resolution transmission electron microscope (HR-TEM) with 300 kV, was used to capture the crystalline lattice structure of SiQDs-De. Before observations, the Pluronic-coated SiQDs-De samples were deposited onto the ultrathin copper grid. The excitation and emission spectra of the SiQDs-De and Pluronic coated SiQDs-De were measured by InGaAs detector for NIR on a NanoLog spectrofluorometer (Hamamatsu Photonics, Japan). The power lamp source is a 450 W xenon arc lamp. IgG was excited with a 279 nm LED source, and the Pluronic coated SiQDs-De were excited with a 370 nm pulsed spectral LED. The experimental decay curve fitting values were decided based on the χ2 value, which is near to value 1. Using an integrating sphere C9920-03G system from Hamamatsu Photonics in Japan with a xenon lamp light source (150 W), the photoluminescence quantum yield (PLQY) was measured. The spectropolarimeter (model J-725; Jasco, Tokyo, Japan) measured circular dichroism spectra using a 1 mm quartz cuvette and a 100 nm min−1 scan rate at ambient temperature. We measured each spectrum three times and acquired an average to finalize the results. Each CD data was measured three times and averaged. BESTSEL web server was used for protein secondary structure predictions.
Particle size analysis by AF4
The Asymmetric-flow field flow fractionation (AF4) apparatus is attached to an HPLC manual injection valve (Wyatt Technology) and includes a 20 μL sample loop made of stainless steel; this machinery consists of an isocratic pump (1260 series (G1310B), Agilent Technologies, Santa Clara, CA). A channel for AF4 separation (Eclipse, Wyatt Technology, Santa Barbara, CA) using 5 kDa molecular weight cut-off filter with regenerated cellulose membrane, MALS detector from Dawn 8+, Wyatt Technology, A diode array detector in the UV-vis range (1260 DAD (G1315D), Agilent Technologies). Before AF4 analysis, we used a 0.22 μm membrane filter and sonicated and 10 mM PBS was used as an eluent. The investigation was carried out using an injection flow rate of 0.2 mL min−1 and 0.25 mL min−1. About 50 μL of the sample was injected into the system for micelles analysis. Usually, after sample injection, focus and axial flow were generally in opposition to one another to condense the micelles sample into a tiny space. We need to wait about 10 minutes, utilizing a cross-flow of 0.25 mL min−1, to reach the equilibrium stage. Around 0.5 mL min−1 of detector flow rate was continued. ASTRA software has been used for all AF4 analyses (version 5.3.4.15, Wyatt Technology).
Cell culture and cytotoxicity assay
For in vitro studies, we used (HeLa and human dermal fibroblasts) that were grown in a 75 cm2 flask at 37 °C in humidified air containing 5% CO2 and supplied with 10% fetal bovine serum, 5000 U per mL penicillin, and 50 μg mL−1 streptomycin. Both cell lines are maintained with the DMEM medium. We got all our tissue culture supplies from Fisher Scientific. The cells were grown onto a 96-well plate at a density of 5000 cells per well for the cell cytotoxicity assessment. After a 24 hours preincubation period, SiQD-De/F127 micelles were applied to cells and the cell viability was measured after incubating them at 24 and 48 h using the Cell Counting Kit-8 (Dojindo Laboratories, Osaka, Japan). With a conventional microplate reader, absorbance at 450 nm was determined (MTP-880Lab; Corona, Hitachinaka, Japan). Experiments on cell viability were carried out in triplicate, and the outcomes were displayed as ± mean standard deviation. Compared to untreated control cells, the percentage of cell cytotoxicity was displayed.
Live-cell imaging
To visualize the SiQD-De/F127 micelles in the live cells, we used a confocal laser scanning fluorescence microscope (FluoView, FV10i, Olympus) with UV laser excitation. We seeded HeLa and Fibroblast cells in a 35 mm dish, and 24 hours later, 100 μg mL−1 nanomaterials were added to a glass bottom dish as a final concentration. After a 24 hours incubation period, the cells were washed in PBS and fixed for 10 minutes in 4% paraformaldehyde before confocal imaging. The cell nucleus was stained with Hoechst 33342 dye. Integrated fluorescence intensities from each cell were calculated using Image-J software.
Medaka fish culture
For in vivo studies, we used medaka fish (Oryzias latipes) embryos and larvae. The mature Oryzias latipes were purchased from a local fish farm (Higo-pet, Kyoto Prefecture) and were subjected to artificial reproductive conditions in a freshwater glass aquarium maintained at 25 °C in a 10 hours dark and 14 hours light cycle. As described before, the spawned eggs were collected, maintained and monitored in a Petri-dish.26 The eggs were seeded in triplicates onto a 96-well plate (one per well) and the treatment was done on a 4 days-old egg and was monitored every day until day 28. The larvae hatched out of the egg around day 17 were maintained and monitored in a separate glass tank. Image-J software calculated mean fluorescence intensities from medaka fish embryos and larvae.
Molecular docking studies
ChemDraw was used to draw the F-127 compound's initial chemical structure. The steepest descent approach and conjugate gradient approach were used to reduce the energy of the chemical structure 5000 times in total, an impact panel integrated into the Schrodinger software. The protein data bank portal was used to download the IgG (PDB ID: 6KA7). The two protein structures that were obtained were optimized and reduced using the force field from the OPLS 2005 software of the Protein Preparation Wizard panel. The steps for preparing the protein file were as follows: initially, remove all water from around the protein molecule; (ii) add hydrogen atoms to the appropriate protein structure; (iii) assign coulomb charges; and (iv) native (co-crystal) molecules were taken out of the corresponding protein molecules; and (v) minimized the energy of the structure. After the docking experiments using the induced fit panel have generated a maximum of 10 possible postures, the best docking position is chosen based on glide energy and docking score.27–32
Results and discussion
Synthesis and characterization of SiQD-De/F127 micelle
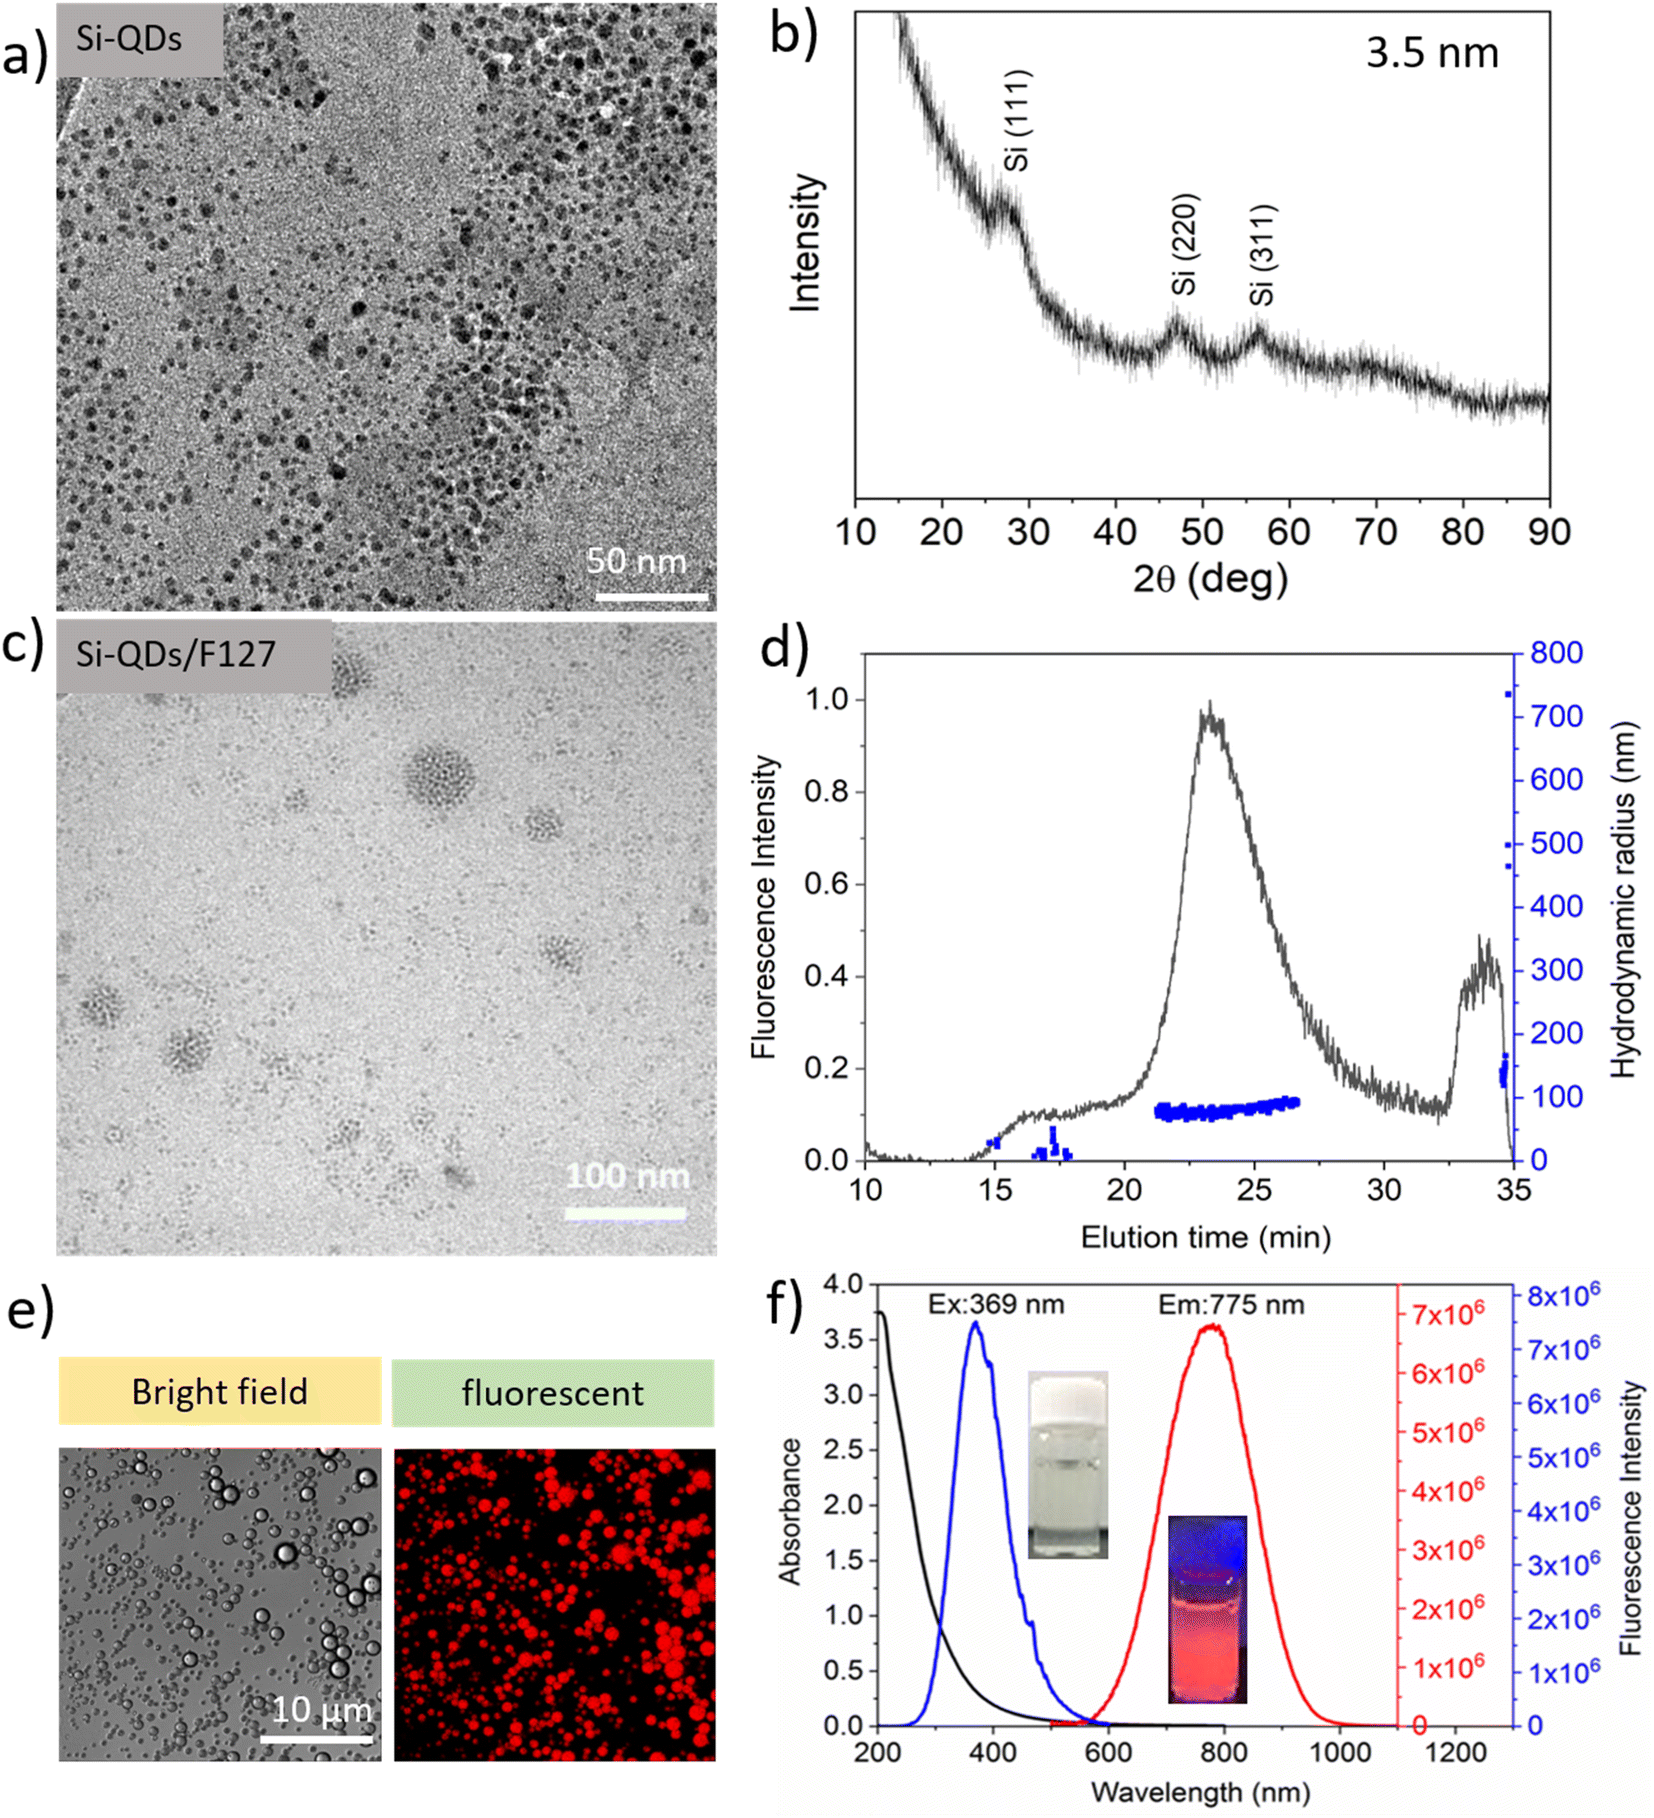
As per our prior procedure, we produced a water-borne micelle with a Pluronic F127 shell and an assembled SiQD core that is terminated by decene monolayers.5 SiQD termination with alkyl monolayers significantly improved PLQYs.33–35 By wrapping the SiQD-De inside a Pluronic F127 molecule, the SiQD-De was transported from toluene to water. Pluronic F127 were chosen as coating material in this study for several reasons. First, Pluronic block copolymers are amphiphilic synthetic polymers composed of hydrophilic poly(ethylene oxide) (PEO) blocks and hydrophobic poly(propylene oxide) (PPO) blocks arranged in a triblock configuration: PEO–PPO–PEO. The hydrophobic PPO segments include a hydrophobic core that serves as a microenvironment for lipophilic drug. The hydrophilic PEO corona inhibits aggregation, protein adsorption, and reticuloendothelial recognition (RES).36 The resulting SiQDs-De/F127 was then purified using dialysis and a 14 kDa MWCO tube. According to TEM images (Fig. 2a), SiQD-De micelles are well distributed. The average size (3.5 nm) of SiQD-De was calculated by X-ray diffraction (Fig. 2b). After surface modification with Pluronic-F127, the sizes of materials increased between 30 to 80 nm (Fig. 2c and S1(b)†). In addition, with TEM images, AF4 analysis also suggests that most of the micelles present nearly 80 nm hydrodynamic radius (Fig. 2d). The TEM and AF4 results are also supported by dynamic light scattering analysis (85 nm) (Fig. S2†). To confirm the fluorescence nature of the materials, we prepared SiQD-De/F127 micelles and investigated with confocal fluorescence microscopy. The red color fluorescence intensity was produced by micelles at the microscale, as shown in Fig. 2e. The SiQD-De/F127 micelles emit the light at 775 nm when excited with 369 nm. In addition, we could observe the wide-ranging absorption spectrum and narrow excitation spectrum of the micelles (Fig. 2f). SiQDs emission ranges were controlled by QDs size. In addition, with 3.5 nm (775 nm emission) SiQDs, we synthesized 4.8 and 4.0 nm SiQDs with fluorescence emissions of 886 and 800 nm (Fig. S3†). Finally, small-size SiQDs are used to prepare micelles, which are then used for cell imaging and IgG interaction studies.
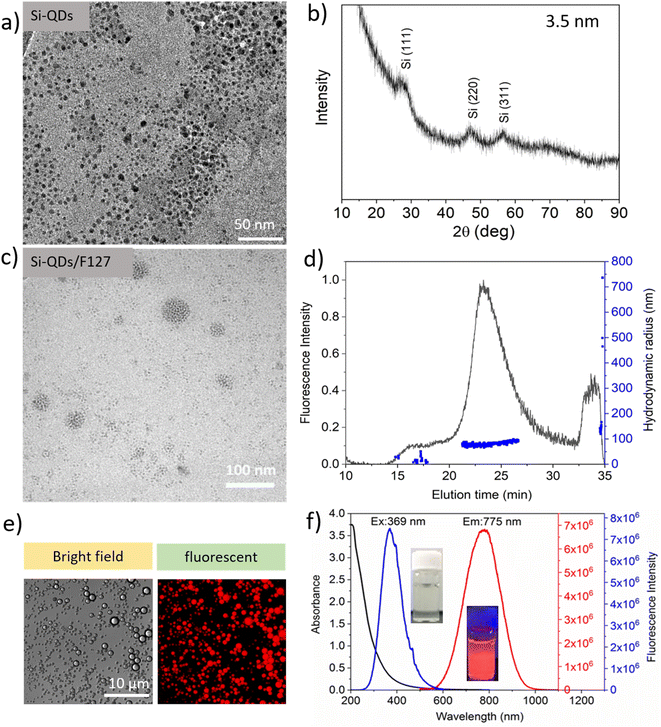 |
| | Fig. 2 TEM images of SiQD-De (a), XRD spectrum of SiQD-De (b), TEM images of SiQD-De/F127 micelles (c), AF4 analysis shows a micelle size of between 30 to 80 nm (d), Fluorescent bright field and fluorescent images of the microscale micelle (e), Fluorescent absorption, excitation and emission spectra of micelles (f). | |
Interaction between Si-QD-De/F127 and IgG: UV-vis absorption study
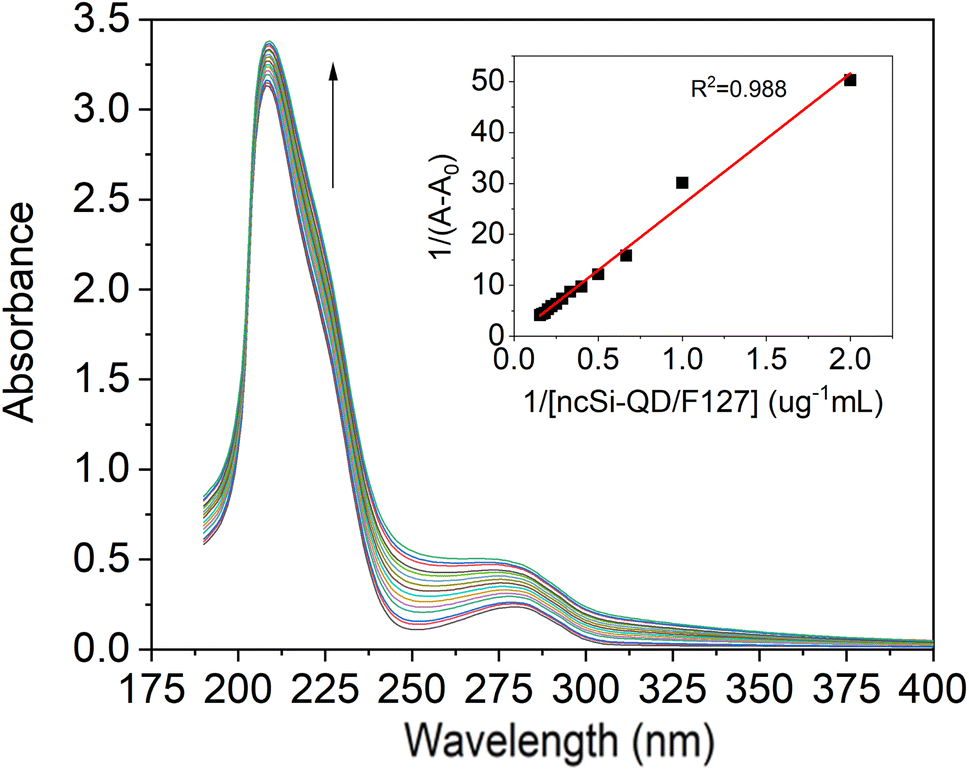
UV-Vis absorption spectroscopy is an easy and ideal tool to investigate the interaction between proteins and small molecules or nanomaterials. When exposed to an external source, amino acid residues are highly sensitive to the local environment. For spectroscopy investigations, aromatic amino acids are more sensitive, especially tryptophan. Such microenvironment changes the absorption maxima and spectral shift of the IgG. Due to Si-QD-De/F127, the absorption spectra were measured between 190 and 400 nm to examine the peptide strands of IgG. We recorded IgG (1 μM) absorption spectra (Fig. 3), in the presence of increasing concentrations of SiQD-De/F127 (0–2.0 μg mL−1). Around 220 and 278 nm, two prominent bands developed; the first is caused by the π–π* transition of polypeptide backbone structure C![[double bond, length as m-dash]](https://www.rsc.org/images/entities/char_e001.gif) O transition, while the second is due to aromatic amino acids, particularly for tryptophan of IgG. After adding SiQD-De/F127, the polypeptide backbone region shows minimal absorption changes, while the aromatic amino acid region shows considerable spectral changes. Which means microenvironment of aromatic amino acids are more sensitive than peptide backbone while interact with foreign molecule or nanomaterials.37
O transition, while the second is due to aromatic amino acids, particularly for tryptophan of IgG. After adding SiQD-De/F127, the polypeptide backbone region shows minimal absorption changes, while the aromatic amino acid region shows considerable spectral changes. Which means microenvironment of aromatic amino acids are more sensitive than peptide backbone while interact with foreign molecule or nanomaterials.37
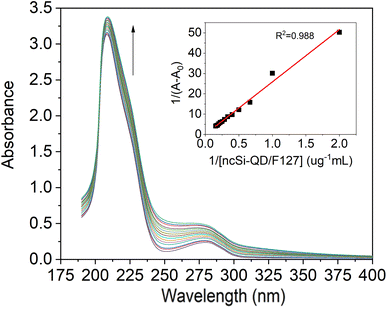 |
| | Fig. 3 IgG (1 μM) absorption spectra with increasing concentration (0.154, 0.167, 0.182, 0.200, 0.222, 0.250, 0.286, 0.333, 0.400, 0.500, 0.667, 1.000, 2.000 μg mL−1) of SiQD-De/F127 micelles. Benesi–Hildebrand graph for IgG as a factor of micelles concentration is displayed in the insets. | |
The above results confirm that ground-state complex formation is possible between IgG and SiQD-De/F127 micelles.
Using eqn (1), the degree of complex formation between IgG and SiQD-De/F127 was assessed.
| | |
IgG + SiQD-De/F127 ⇌ [IgG]: SiQD-De/F127
| (1) |
where
K is the provided value for the association constant
| | |
K = [IgG: SiQD-De/F127]/[IgG] [SiQD-De/F127]
| (2) |
Using the Benesi–Hildebrand relation, the binding constants of complex formation were calculated from the alteration in the absorption peak's intensity at 278 nm.38
| | |
1/(Aobs − A0) = 1/(Ac − A0) +1/Kapp [Ac − A0] 1/[ SiQD-De/F127]
| (3) |
where
A0 and
Aobs are the IgG solution's absorption at 1 μM and IgG varying in the concentration of SiQD-De/F127, separately.
Ac represents the final absorption of the ligated IgG. The binding constant (
Kapp) for the IgG–SiQD-De/F127 complex is reported to be 3.11 × 10
4 M
−1, and the plot of 1/(
Aobs −
A0) against 1/[SiQD-De/F127] is shown to be linear.
A steady-state fluorescence analysis of the interaction between SiQD-De/F127 and IgG
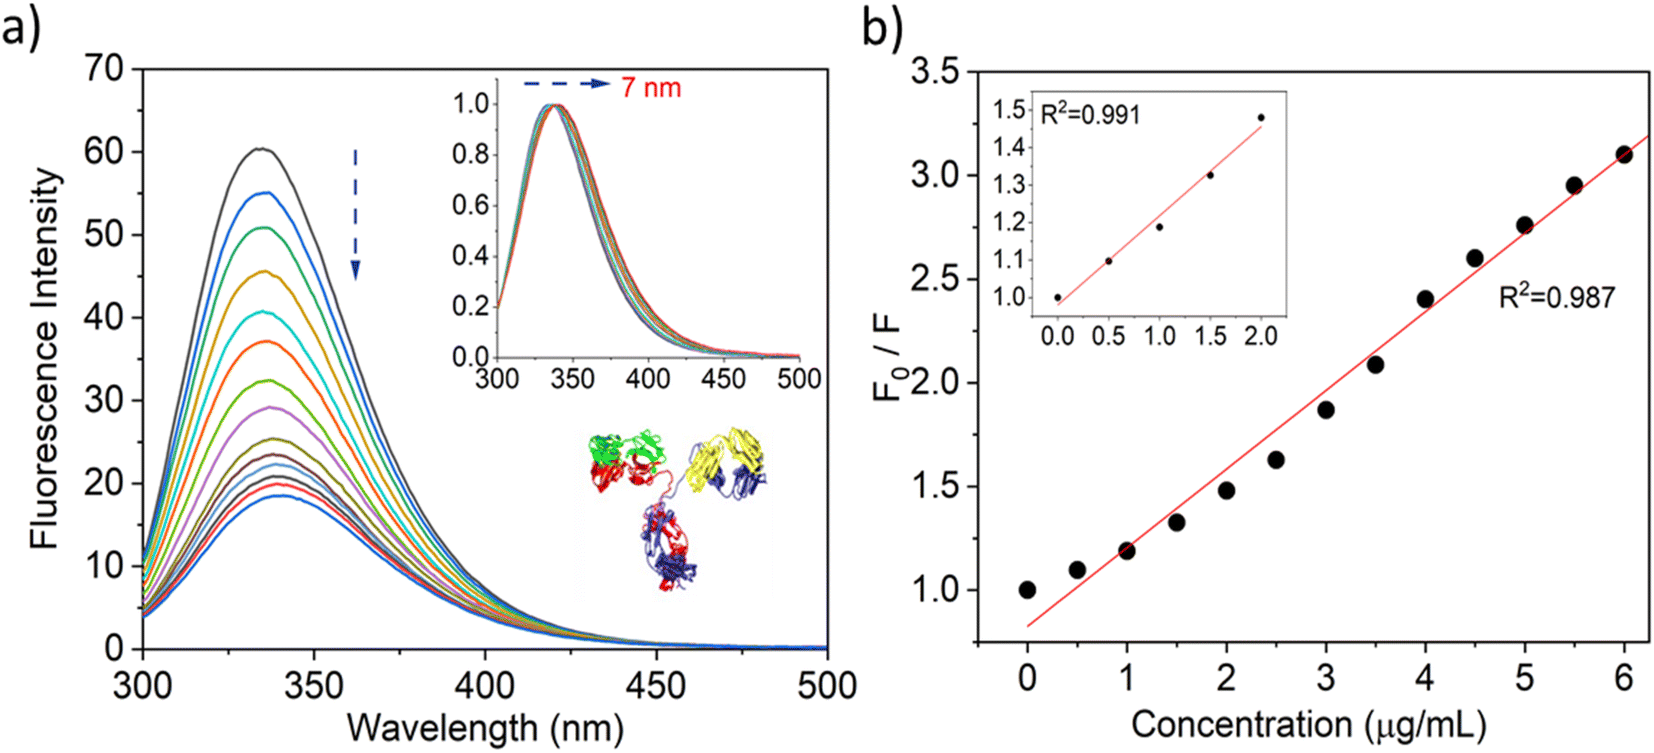
To evaluate the fluorescence quenching nature of the IgG while interacting with SiQD-De/F127, we used fluorescence steady and excited state spectroscopy. Usually, tryptophan gives intrinsic fluorescence of more than 95% compared with other aromatic amino acids like tyrosine and phenylalanine. The fluorescence spectra of IgG were observed with an incremental concentration of SiQD-De/F127 (Fig. 4a). With rising SiQD-De/F127 concentrations, the fluorescence intensity of IgG significantly reduced, and a redshift (∼7 nm) was observed, which indicated that SiQD-De/F127 interacted with IgG, causing the fluorescence chromophore of IgG to be positioned in a more hydrophobic environment.
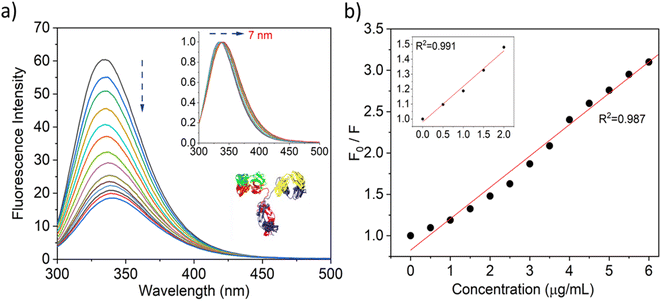 |
| | Fig. 4 Quenching of IgG tryptophan fluorescence while interacting with increasing concentrations (0, 0.5, 1.0, 1.5, 2.0, 2.5, 3.0, 3.5, 4.0, 4.5, 5.0, 5.5, 6.0, 6.5 μg mL−1) of SiQDs/F127 micelles (a). Fluorescence quenching spectra and red spectral shift (inset) (b). Stern–Volmer graph of IgG with and without SiQDs/F127 micelles. Insets show low concentration levels of SiQDs/F127 micelles. Protein data bank information is used to create the IgG crystal structure, PDB ID: 6KA7 (4a, inset). | |
The following Stern–Volmer equation helps to demonstrate the quenching mechanism.39,40
| | |
F0/F = 1 + Kq τ0[Q] = 1 + Ksv[Q]
| (4) |
F0 denotes the fluorescence intensity in the absence of a quencher. With the quencher,
F represents the fluorescence intensity.
Kq indicates quenching constants of IgG. The average lifetime (
τ0) of IgG indicates 2 × 10
8 s. The Stern–Volmer quenching constant is denoted by
Ksv, while the quencher concentration is represented by [Q].
Fig. 4b specifies the fluorescence quenching of IgG by SiQD-De/F127. The reason behind the fluorescence quenching is the complex formation between IgG and SiQDs-De/F127. The
Kq value, which is higher than the biopolymer's diffusion rate constant (1.47 × 10
13 L
−1 mol
−1 s
−1), further supported the static quenching theory. In addition, with the above results, time-resolved fluorescence analysis was performed to verify the types of quenching mechanisms.
The following equation can be used to determine the binding site (n = 0.98) and binding constant (K = 2.89 104 Lmol−1) based on Fig. 4b.41
| | |
log[(F0 − F)/F] = logKa + nlog[Q]
| (5) |
Table 1 summarizes the calculated parameters. When we used a lower concentration of nanomaterials (<2.0 μg mL−1), a linear relationship was obtained (see Fig. 4, inset) between IgG and SiQD-De/F127, which causes ground state complex formation or static quenching. PL quenching in high concentration leads to dynamic or collisional quenching.
Table 1 Binding values of IgG during interaction with SiQD-De/F127 micellesa
| |
Ksv (μg−1 mL) |
Kq (μg−1 mL s−1) |
τ0 (ns) |
n |
R2 |
| KSV represents the Stern–Volmer constant, Kq indicates the biomolecular quenching rate constant, τ0 denotes lifetime, and n represents the number of the binding site in the IgG. R2 shows the goodness of fit. |
| IgG (constant)/micelles |
0.29 ± 0.06 |
1.05 × 10¹⁰ |
2.80 |
0.98 |
0.99 |
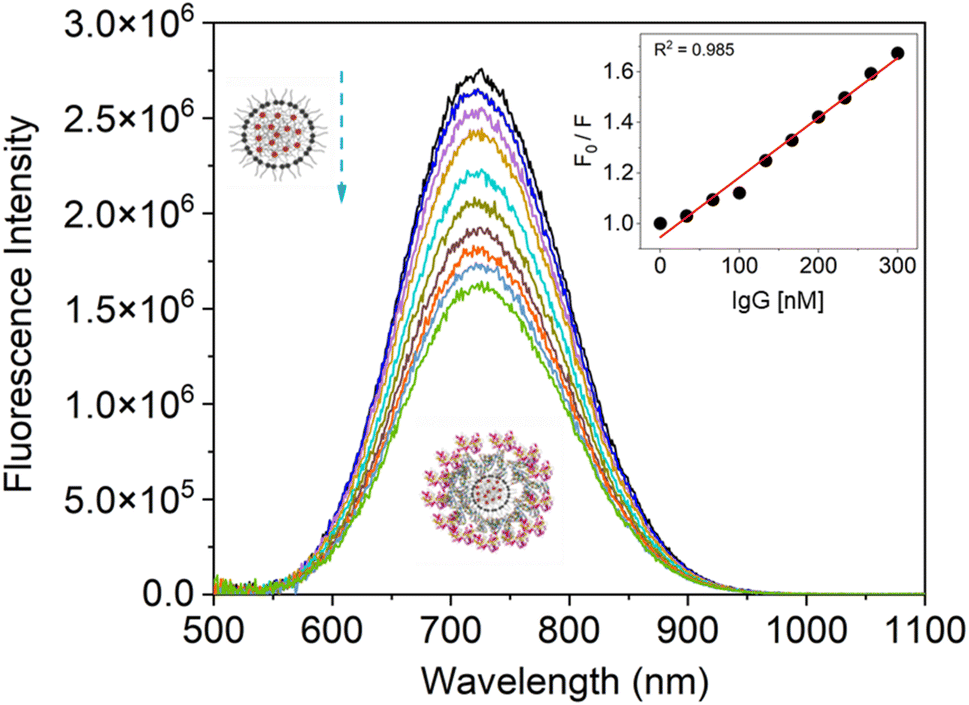
With the addition of IgG gradually (0–300 nM), we later observed the fluorescence quenching behavior of the SiQD-De/F127 micelles. The results are shown in Fig. 5, and the Stern–Volmer plot shown inset. The goodness of fit value (R2 > 0.98) shows linear quenching trends when more IgG is added, indicating that the PL intensity of SiQD-De/F127 micelles is degraded. The calculated parameters are tabulated in Table 2. The Kq value exceeds the top limit of the scatter collision quenching constant (2.0 × 10¹⁰ M−1 s−1), showing that the static quenching process dominates the SiQD-De/F127 fluorescence quenching.42
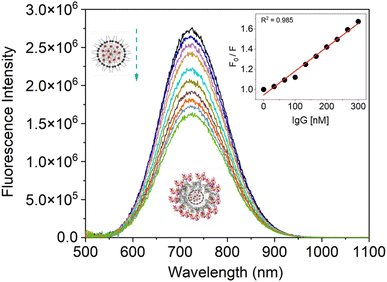 |
| | Fig. 5 Fluorescence spectra of SiQDs-De/F127 micelles after adding IgG in incremental amounts (0, 33.33, 66.66, 99.99, 133.32, 166.65, 199.98, 233.31, 266.64, 300.00 nM). SiQDs/F127 micelles fluorescence emission spectra and their accompanying Stern–Volmer graphs are displayed in both the absence (block line) and presence of IgG. | |
Table 2 Binding values of SiQD-De/F127 micelles during interaction with IgGa
| |
Ksv (L−1 M−1) |
Kq (L−1 M−1) |
τ0 (μs) |
n |
R2 |
| KSV represents the Stern–Volmer constant, Kq indicates the biomolecular quenching rate constant, τ0 denotes lifetime, and n represents the number of the binding site in the IgG. R2 shows the goodness of fit. |
| Micelles (constant)/IgG |
0.179 × 10⁷ |
2.29 × 10¹⁰ |
78.16 |
0.881 |
0.985 |
A time-resolved fluorescence analysis of the interaction between IgG and SiQD-De/F127
The PL decay curves for IgG with increasing concentrations of SiQD-De/F127 were measured to clarify the PL dynamics of the IgG- SiQD-De/F127 complex. Fig. 6 demonstrates the fluorescence decay profile of IgG before and after SiQD-De/F127 addition. IgG exhibits single exponential decay in dilute solutions and in the presence of SiQD-De/F127. There are significant variations in the lifetime of IgG (from 2.8 ns to 1.68 ns) as SiQD-De/F127 concentration is raised. This result suggests that fluorescence quenching happened by static mechanism and supports the ground state complex formation. The estimated decay time is summarized in Table 3.
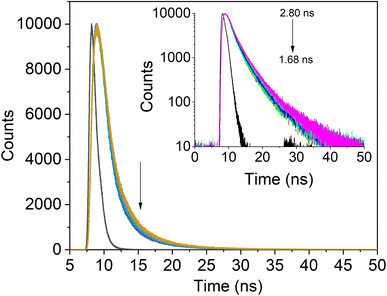 |
| | Fig. 6 IgG's fluorescence lifetime profile with the addition of SiQDs/F127 micelles (0, 3.33, 6.66, 10.00, 13.33 μg mL−1). Arrows show that lifetime decreases as micelles are gradually added. | |
Table 3 The addition of SiQD-De/F127 micelles gradually alters the tryptophanyl fluorescence lifetime of IgG
| |
Micelles conc. (μg mL−1) |
α1 × 10³ |
α2 |
α3 |
τ1 (ns) |
τ2 (ns) |
τ3 (ns) |
τ0 (ns) |
χ2 |
| IgG |
0 (Only protein) |
6.55 |
3.23 × 10⁻³ |
6.55 × 10⁻⁴ |
8.36 |
2.73 |
5.79 |
2.79 |
1.06 |
| 03.33 |
7.54 |
3.31 × 10⁻³ |
1.17 × 10⁻³ |
6.64 |
2.10 |
4.09 |
2.23 |
1.13 |
| 06.66 |
7.59 |
2.35 × 10⁻³ |
2.17 × 10⁻³ |
6.36 |
1.55 |
2.94 |
1.84 |
1.11 |
| 10.00 |
7.93 |
2.88 × 10⁻³ |
1.99 × 10⁻³ |
6.05 |
1.43 |
2.88 |
1.72 |
1.10 |
| 13.33 |
5.82 |
2.39 × 10⁻³ |
4.12 × 10⁻³ |
5.70 |
2.66 |
1.15 |
1.68 |
1.09 |
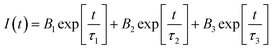
Fig. 5 and 6 fitted with a triexponential function as shown by eqn (6).43
| |
 | (6) |
In the equation above, B1, B2, and B3 stand in for the amplitudes of each component, while PL lifetimes for the first, second, and third components, respectively, are represented by 1, 2, and 3. When SiQD-De/F127 was gradually added, the radiative lifetime of IgG was reduced. A triexponential function was used to fit the IgG decay curve, yielding an estimated average decay time of 2.79 ns and time constants of 8.36, 2.73, and 5.79 ns. The average lifetime dropped to 1.68 ns under the influence of 13.33 g mL−1 micelles. The minor difference in PL decay time indicates that the lower concentrations of the SiQD-De/F127 addition do not affect the IgG PL decay dynamics.
A biexponential function was used to match the measured PL decay patterns for the SiQD-De/F127 with the progressive addition of IgG (Fig. 7). The fitting parameters are listed in Table 4. As the concentration rose, IgG's degradation time revealed decreasing tendencies (arrows, Fig. 7, inset). A bi-exponential fit with lifetime components of 26.1 and 80.3 s was used to estimate the average decay time, which was found to be 78.1 s. The average lifetime of the micelles dropped to 42.7 s after the serial addition of IgG. The tryptophanyl fluorescence's PL dynamics differed from the IgG incremental addition's effect on the micelles PL decay.
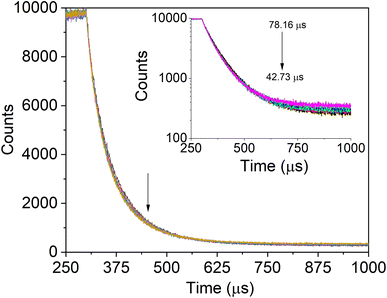 |
| | Fig. 7 SiQDs/F127 micelles fluorescence lifetime profile with the addition of IgG (0, 33.33, 66.66, 99.99, 133.32, 166.65 nM). After interacting with IgG, SiQDs/F127 micelles fluorescence lifetime is displayed in the insets. | |
Table 4 SiQD-De/F127 micelles PL lifetime is altered by adding IgG in nanomolar concentrations
| |
Protein conc. (nM) |
α1 × 10³ |
α2 × 10³ |
τ1 (μs) |
τ2 (μs) |
τ0 (μs) |
χ2 |
| IgG |
0 (only micelle) |
1.07 |
8.44 |
26.1 |
80.3 |
78.1 |
0.97 |
| 33.33 |
2.32 |
7.03 |
24.5 |
71.3 |
66.5 |
0.99 |
| 66.66 |
2.48 |
6.58 |
25.6 |
71.1 |
65.6 |
1.02 |
| 99.99 |
2.53 |
6.56 |
24.8 |
68.7 |
63.3 |
1.04 |
| 133.32 |
2.12 |
6.91 |
22.7 |
65.1 |
61.0 |
0.92 |
| 166.65 |
2.05 |
7.29 |
18.3 |
45.5 |
42.7 |
0.99 |
When we modify the surface of the SiQD-De with Pluronic F127, the PLQY reduction is very fast. Adsorption of the IgG on the SiQD-De/F127 surface changed the molecular structure of Pluronic F127 micelles. Using two parameters, kr for radiative processes and knr for nonradiative processes, PLQY (η) is defined as η = kr/(kr + knr), where kr = 1/τr and knr = 1/τnr. This process may diminish the micelle protecting performance against oxygen and water, leading to mild oxidation of QDs. Because the oxidized QD surface acts as a nonradiative channel and reduces the PL decay time, this procedure raises the value of τnr.44
IgG secondary structure analysis
One of the sensitive techniques to track the structural changes of the protein is circular dichroism (CD) spectroscopy. We captured the SiQD-De/F127- and SiQD-De/F127-IgG CD spectra. The secondary structure of IgG was calculated using an online software called BeStSel (http://bestsel.elte.hu/index.php) created for secondary structure identification and folding recognition from protein CD spectra.45,46
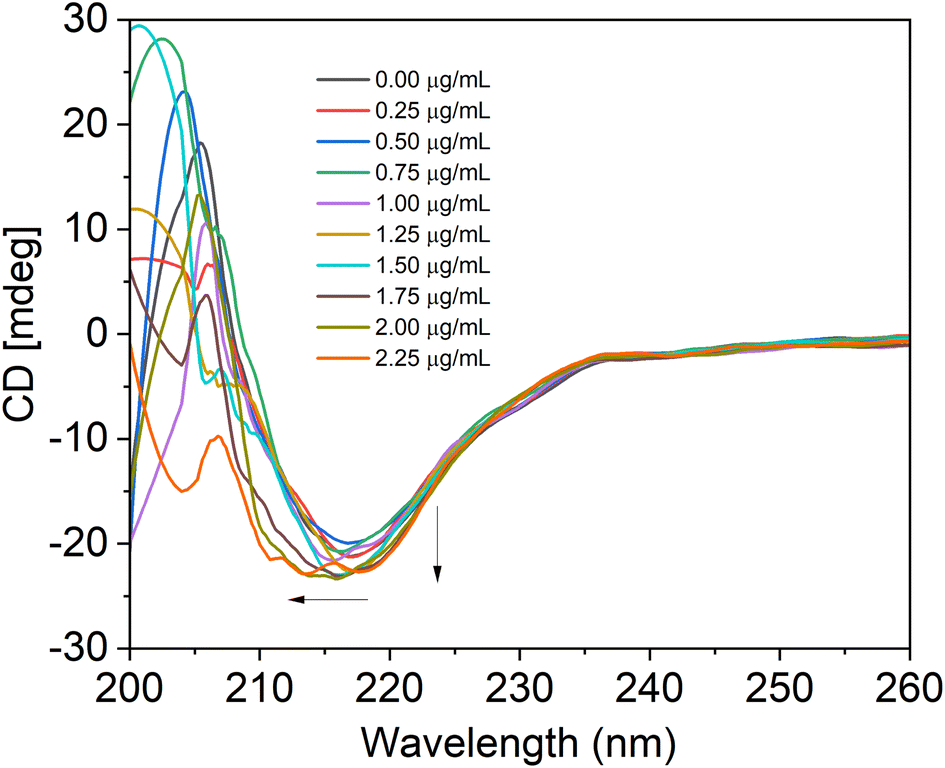
With the gradual addition of SiQDs/F127 micelles, we evaluated IgG CD spectra from 200 to 260 nm. The IgG and its combination with SiQDs/F127 micelles CD spectra are shown in Fig. 8. A negative peak is present between 210 to 225 nm due to the β-sheet secondary structure of IgG.47 The spectral shape and wavelength shift happened when adding 1.25 μg mL−1 of micelles, indicating IgG denaturation. Native IgG (0.1 M) includes 100% parallel beta sheets; however, as micelles (0–2.25 μg mL−1) were added, the value steadily dropped to 7.96%. Table 5 shows the percentages of parallel and anti-parallel beta-sheet changes and other secondary structure changes, such as a loop. Up to 1.5 μg mL−1 of micelles, in addition, the secondary structure of IgG does not alter when we go more than that; we observe irregular/loop structure in the Table 5. This result supports the utility of SiQDs/F127 micelles in biomedical applications as they could still have excellent biocompatibility even when utilized in a lower concentration. In addition, shorter in vivo circulation times further substantiate their biocompatibility.
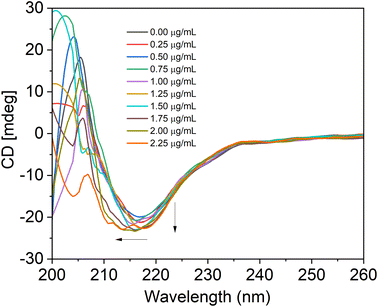 |
| | Fig. 8 CD spectra reveal the secondary structure and conformational stability of the IgG following their association with SiQDs/F127 micelles (0, 0.25, 0.50, 0.75, 1.00, 1.25, 1.50, 1.75, 2.00, 2.25 μg mL−1). Arrows describe the type of wavelength shift or change that occurs when micelles are combined with IgG. | |
Table 5 Analysis of IgG's secondary structure upon interactions with SiQD-De/F127 micelles
| IgG (0.1 μM) + micelle (μg mL−1) |
Anti (%) |
Parallel (%) |
Others (%) irregular/loop |
| 0.00 |
0 |
100 |
0 |
| 0.25 |
0 |
100 |
0 |
| 0.50 |
22.29 |
77.71 |
0 |
| 0.75 |
25.96 |
74.04 |
0 |
| 1.00 |
29.41 |
70.59 |
0 |
| 1.25 |
32.16 |
67.84 |
0 |
| 1.50 |
48.65 |
51.35 |
0 |
| 1.75 |
42.78 |
24.06 |
33.17 |
| 2.00 |
53.35 |
12.74 |
33.91 |
| 2.25 |
18.27 |
7.96 |
73.77 |
Cell viability and cellular uptake
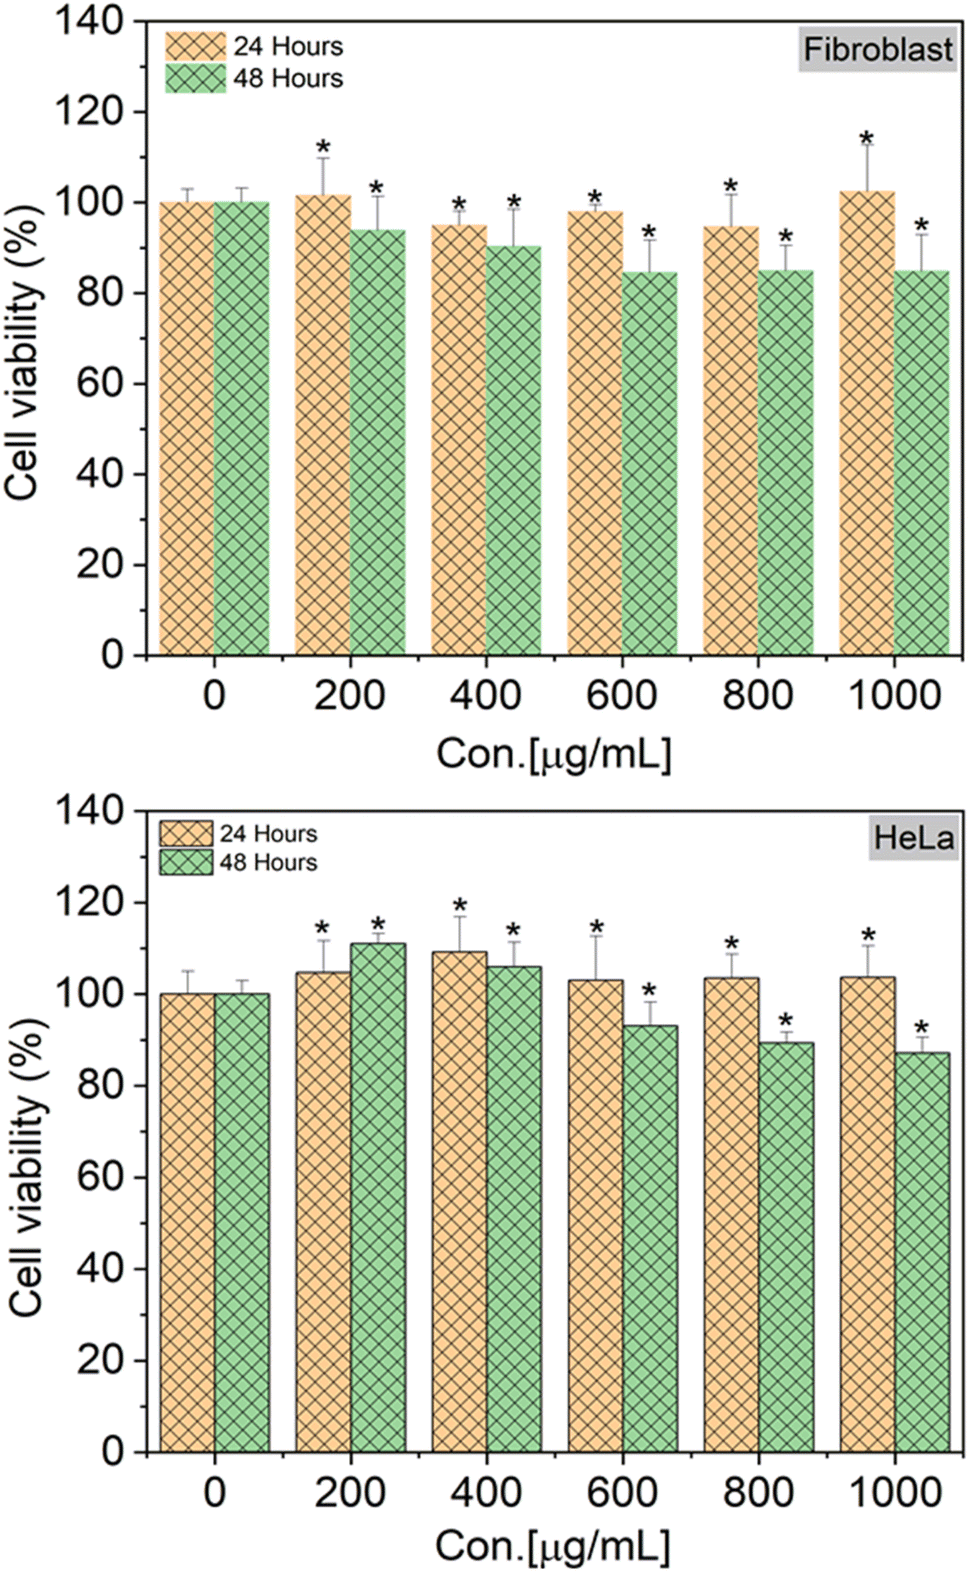
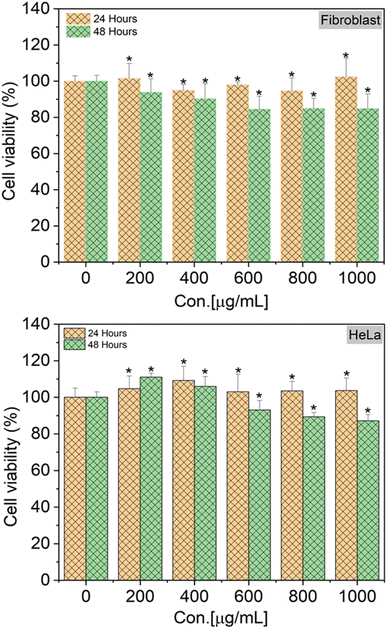
To verify the biocompatibility of SiQDs-De/F127 micelles in the in vitro models, we performed cellular viability and in vitro imaging studies using HeLa cells and human dermal fibroblasts (HDFs) as representative cell lines. As shown in Fig. 9, HeLa cells and HDFs were almost 100% viable after 24 h incubation, as no cytotoxicity was observed even with 1 mg mL−1 of SiQDs-De/F127 micelles. Interestingly, even with 48 h incubation, only a limited amount of toxicity (10%) was observed in both cell lines. Together, the cell-viability studies substantiate that the functionalized SiQDs-De/F127 micelles were relatively less hazardous than the heavy-metal QDs19 and are expected to have excellent biocompatibility for diagnostic studies using live cells. Pramanik et al. evaluated toxicity assay of SiQDs and CdSe and CdSe/ZnS using bacteria models Shewanella oneidensis and Bacillus subtilis.48 The effects of SiQDs on two different bacteria, one Gram-negative and the other Gram-positive, were studied and compared to the effects of two traditional Cd-based QDs (CdSe and CdSe/ZnS). In colony counting assays, the SiQDs had no effect on the viability of bacteria cells, whereas the CdSe QDs had significant dose-dependent toxic effects on the bacteria. The above findings support the SiQDs-De/F127 micelles cell viability assay performed on HeLa and Fibroblast cells.
 |
| | Fig. 9 Cell viability assay using SiQDs/F127 micelles with human dermal fibroblasts (fibroblast) and HeLa cells. Cell viability was represented as mean ± S.E. (n = 3). Treated groups showed statistically significant differences from the control group by the unpaired two-tailed Student's t-test (*p < 0.05). | |
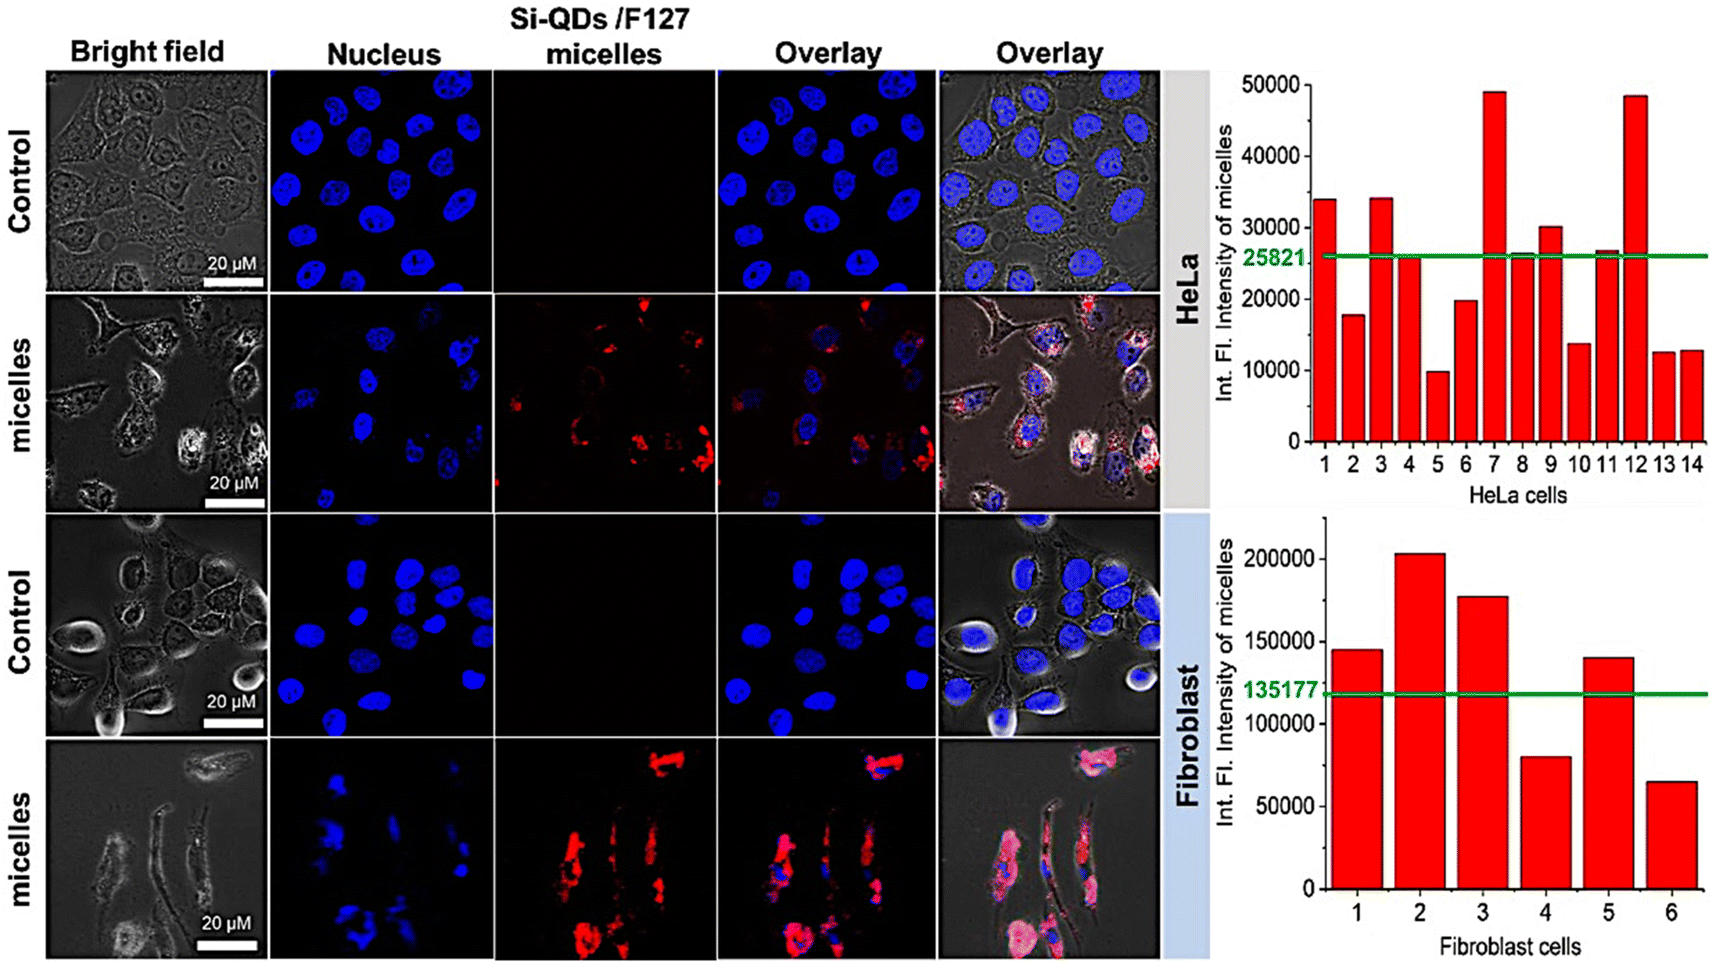
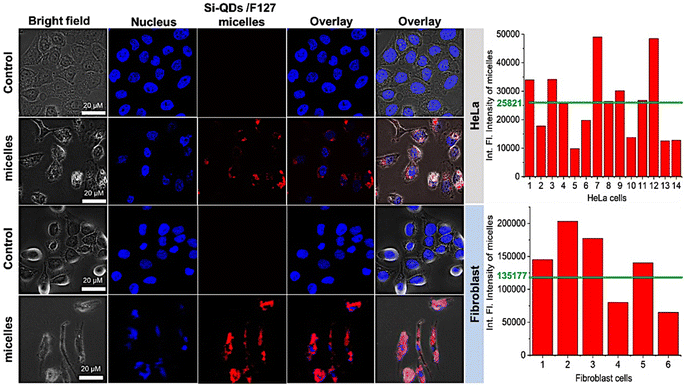
For in vitro imaging studies, we employed a fluorescence confocal microscope to visualize the uptake in the HeLa and fibroblast cell culture media to validate that SiQDs/F127 micelles are nontoxic (∼85% cell viability) even after cellular localization at 1 mg mL−1 concentration. As shown in Fig. 10, the SiQDs/F127 micelles did not enter the cell nucleus but were dispersed throughout the cytoplasm. So far, it has been widely accepted that the cellular uptake of nanoparticles is influenced by a number of factors, including nanoparticle size, concentration, and surface charge.49–51 Phatvej et al. demonstrated an endocytosis pathway for alkyl-capped silicon quantum dots using various cell lines, including HeLa.52 According to the references, SiQDs/F127 micelles are taken up by HeLa and Fibroblast cells via endocytosis. After endocytosis, the micelle will be localized in the early endosome and later translocation to late endosome.53 Finally, SiQDs/F127 micelles spread throughout the cytoplasm. From the fluorescence intensity of the cells, the endocytosis faster in Fibroblast than HeLa.
 |
| | Fig. 10 In vitro imaging studies using SiQDs/F127 micelles with human dermal fibroblast (Fibroblast) and HeLa cells. The bar charts show the integrated fluorescence intensity of individual cells and the green line represents the average intensity caused by the micelles. Triplicate wells were used for each cell line. | |
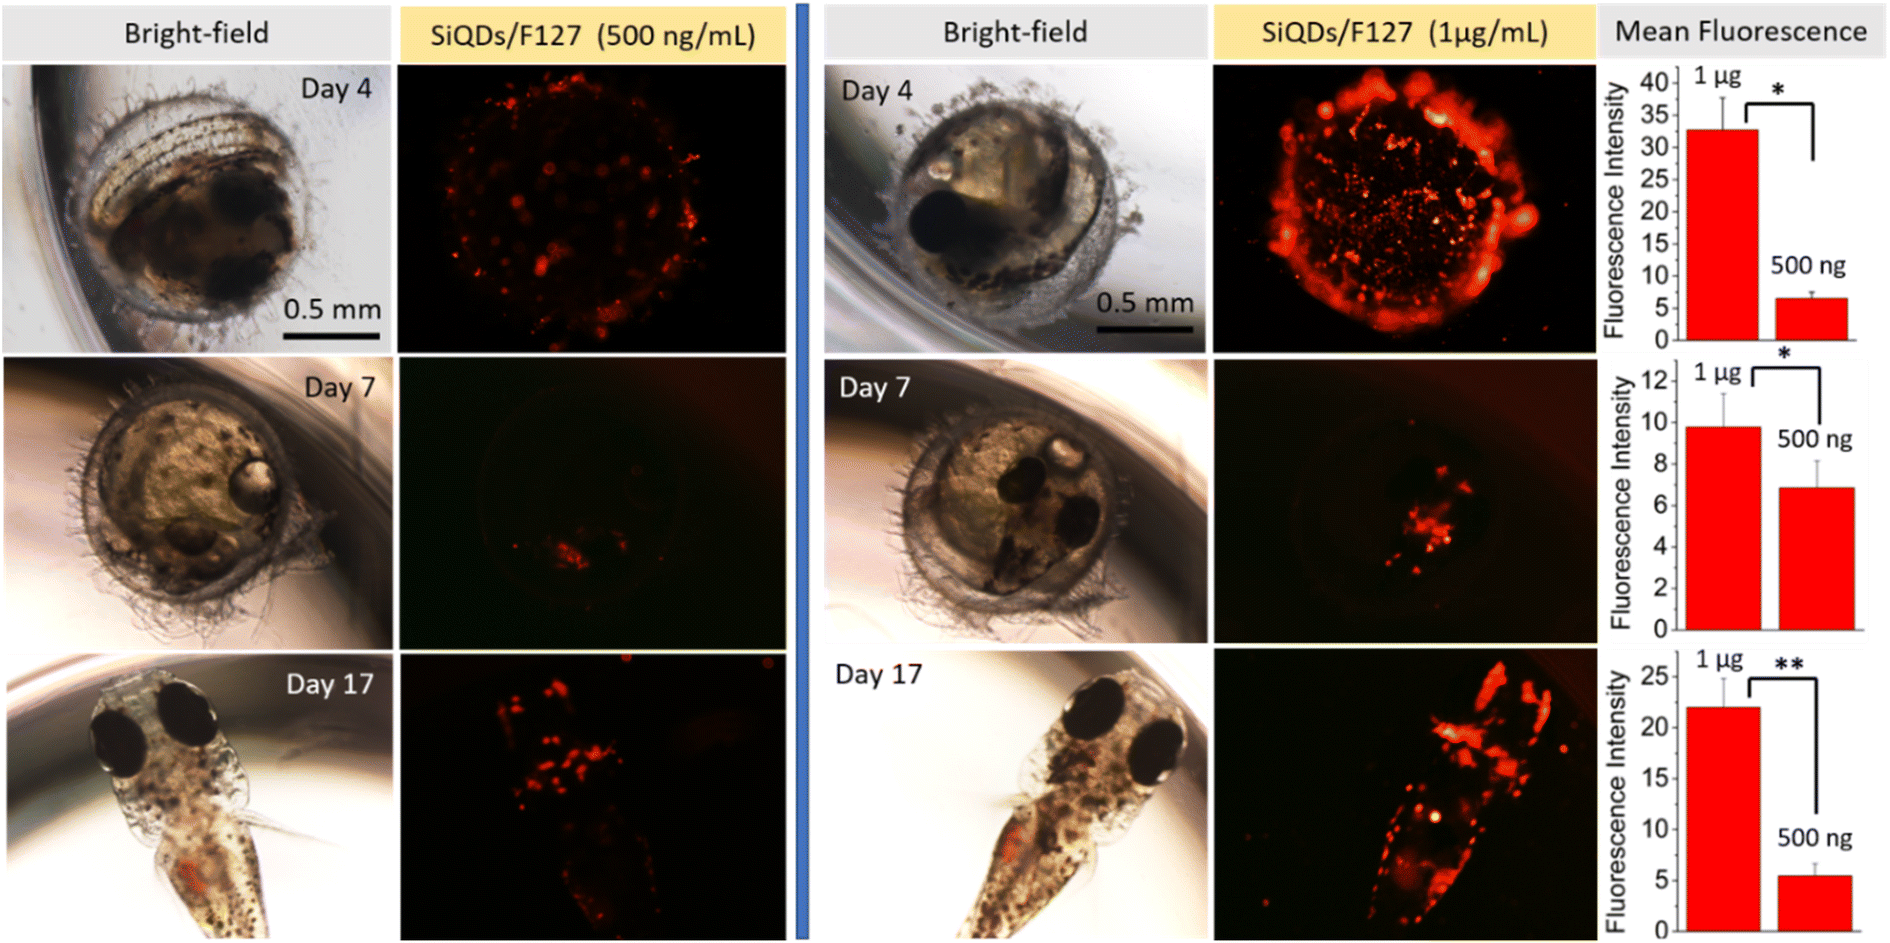
SiQDs-De/F127 uptake in an in vivo model
We chose to verify the in vivo staining capacity of SiQDs-De/F127 micelles by evaluating their uptake in the Japanese medaka fish model (embryo and larvae). After collecting the eggs from the fish tank, we transferred them to 96-well plates and incubated them with 200 μL of sterile, nuclease-free water. We then added 500 ng and 1 μg mL−1 of SiQDs-De/F127 micelles and performed confocal microscopy studies after 24 hours of incubation to examine if micelles could be uptaken by medaka eggs. As seen in Fig. 11, SiQDs-De/F127 micelles are effectively localized inside the medaka fish egg and larvae without any vectors or transfection agents. A significant (P < 0.05) difference in the fluorescence intensity could be observed with low (500 ng mL−1) and high (1 μg mL−1) concentrations of SiQDs-De/F127 micelles on days 4, 7, and 17 (Fig. 11). Even at higher concentrations (1 μg mL−1), the SiQDs-De/F127 micelles-treated fish embryo developed into normal larvae and exhibited excellent fluorescence distribution thereby substantiating their biocompatibility in the in vivo imaging. Furthermore, Kwok et al. evaluated silver nanoparticle uptake by medaka larvae and concluded most of the particles interact with the skin surface and are taken up via the gills.54 Using polystyrene microspheres, Kashiwada et al. evaluated four types of nano-sized distribution in medaka eggs/larvae, and most of the particles enter through adsorption or accumulation.55 Based on the references, the possibility of the SiQDs-De/F127 micelles uptake by medaka eggs/larvae is adsorption/bioaccumulation or entering via the gills. Silver nanoparticle contains Ag, which is toxic to the living organism,56 but we demonstrated SiQDs-De/F127 micelles is non-toxic to the cells and living organism.
 |
| | Fig. 11 SiQDs/F127 micelle uptake by Medaka fish (egg and larvae) with two different concentrations of 500 ng mL−1 and 1 μg mL−1. The fluorescence intensity plot shows a difference between two micelle concentrations. Three eggs were used for each micelle concentration ± S.E. (n = 3). Asterisks indicates *p < 0.05 or **p < 0.01. | |
Molecular docking analysis
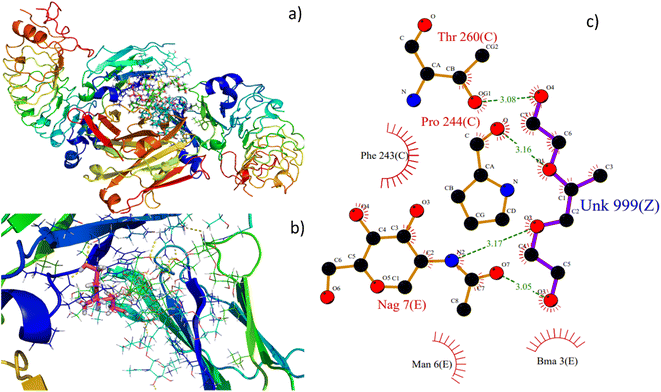
Molecular docking is an excellent resource for comprehending intricate biological systems at the atomic level. Following the experimental evidence supporting F127's binding in the IgG complex system, we performed molecular docking studies to gain deeper insights into how the F127 complex interacts with the microenvironment of IgG. After identifying the active site residues using blind docking, the F127 and IgG complex systems were shown to have additional induced fit docking on the active site residues from that complex. The induced fit docking simulation produced 10 distinct binding poses; for further studies of the F127 complex IgG system, the gliding energy and docking score were used to determine the best positions (Table S1†).
As seen in Fig. 12a and b, the optimal site for the F127 complex, are shown to bind with the IgG system. The binding energy and docking score of the F127 complex with the IgG system are −26.7 kcal mol−1 and −2.9 kcal mol−1, respectively, and three hydrogen bonding formations were found between F127-IgG complex. As seen in Fig. 12c, a OH and O atom in F127 have hydrogen bond contact with NAG 7 and a OH atom have hydrogen bond contact with C Chain of Pro 244 residue. Together, the study concludes that F127 has an excellent binding affinity towards the IgG complex system.
 |
| | Fig. 12 Best binding poses of the pymol view of (a) F127- IgG complex, (b) F127 binding site, (c) hydrogen bond interactions of ligand with the residues represented in green colored lines and nearby hydrophobic residues in red colored lines. In ligplot, ligand is represented in sticks. | |
Summary and outlook
Nanoparticles capable of in vitro and in vivo imaging could dissect cellular function at the molecular level and have been advancing as a potent diagnostic tool in precision medicine. While numerous reports focus on evaluating the staining capacity of quantum dot nanoparticles, their nano–bio interaction, which is critical for assessing their biocompatibility, is often overlooked. Quantum dot nanoparticles are the frontrunners as the diagnostic tools in studying the progression of inflammatory diseases like Rheumatoid arthritis, which are known to have elevated levels of immunoglobulins. Here, we produced water-borne, NIR-emitting SiQDs/F127 micelles capable of live cell imaging and studied their molecular interaction with human IgG through independent lines of evidence. The PLQY of the SiQDs/F127 micelles in water was 25% at pH 7. We first studied IgG's UV-visible absorption and fluorescence emission characteristics by gradually adding SiQDs/F127 micelles and vice versa. The binding parameters depended on IgG binding pockets/surface and the interaction between SiQDs/F127 micelles and IgG. Quenching constants at 1010th order was observed and resembled the creation of a rigid protein corona with strong association. The fluorescence spectral redshift (7 nm) further confirmed the strong protein corona formation. The CD spectroscopy results verified SiQD-De/F127 micelles as an excellent candidate to use in medical diagnosis with limited concentration levels without disturbing the IgG conformation. Accordingly, SiQD-De/F127 micelles demonstrated significant in vitro imaging capacity and limited cytotoxicity in the representative cell lines (HeLa and human dermal fibroblasts). Furthermore, the SiQD-De/F127 micelles displayed excellent in vivo imaging capacity even without requiring vectors and transfection agents when incubated with medaka fish eggs and larvae. It is important to note here that even at higher concentrations (1 μg mL−1), the normal embryonic development of medaka fish was not altered as the larvae hatched on day 17 from the micelles-treated egg as that of the control without any signs of toxicity. Therefore, SiQDs-De/F127 micelles are expected to have excellent biocompatibility for in vivo imaging studies. Our proof-of-concept study postulates the necessity to construct QDs without damaging the original protein conformations to preclude potential toxicity. In the future, this work will guide the development of new QDs as in vitro and in vivo diagnostic and therapeutic tools for inflammatory diseases such as rheumatoid arthritis.
Conflicts of interest
The authors declare no competing financial interest.
Acknowledgements
S. C. acknowledges financial support from Grant-in-Aid for Early-Career Scientists, KAKENHI (grant number 22K15249) and a tenure-track program of NIMS “International Center for Young Scientists (ICYS). We express sincere thanks to Uehara memorial foundation and JSPS KAKENHI (grant number 22K19291) to G. N. P and S. K. thank VIT for providing VIT RGEMS SEED grant.
References
- S. Chinnathambi and N. Shirahata, Recent advances on fluorescent biomarkers of near-infrared quantum dots for in vitro and in vivo imaging, Sci. Technol. Adv. Mater., 2019, 20, 337–355 CrossRef CAS PubMed.
- S. Chandra, Y. Masuda, N. Shirahata and F. M. Winnik, Transition-metal-doped NIR-emitting silicon nanocrystals, Angew. Chem., Int. Ed., 2017, 56, 6157–6160 CrossRef CAS PubMed.
- S. Chinnathambi, S. Chen, S. Ganesan and N. Hanagata, Silicon quantum dots for biological applications, Adv. Healthcare Mater., 2014, 3, 10–29 CrossRef CAS PubMed.
- M. Tian, J. Zhan and W. Lin, Single fluorescent probes enabling simultaneous visualization of duple organelles: Design principles, mechanisms, and applications, Coord. Chem. Rev., 2022, 451, 214266 CrossRef CAS.
- S. Chandra, B. Ghosh, G. Beaune, U. Nagarajan, T. Yasui, J. Nakamura, T. Tsuruoka, Y. Baba, N. Shirahata and F. M. Winnik, Functional double-shelled silicon nanocrystals for two-photon fluorescence cell imaging: spectral evolution and tuning, Nanoscale, 2016, 8, 9009–9019 RSC.
- S. Chinnathambi, N. Hanagata, T. Yamazaki and N. Shirahata, Nano–Bio Interaction between Blood Plasma Proteins and Water-Soluble Silicon Quantum Dots with Enabled Cellular Uptake and Minimal Cytotoxicity, Nanomaterials, 2020, 10, 2250 CrossRef CAS PubMed.
- S. Pandey and D. Bodas, High-quality quantum dots for multiplexed bioimaging: A critical review, Adv. Colloid Interface Sci., 2020, 278, 102137 CrossRef CAS PubMed.
- S. Chinnathambi and N. Hanagata, Photostability of quantum dot micelles under ultraviolet irradiation, Luminescence, 2019, 34, 472–479 CrossRef CAS PubMed.
- A. M. Wagner, J. M. Knipe, G. Orive and N. A. Peppas, Quantum dots in biomedical applications, Acta Biomater., 2019, 94, 44–63 CrossRef CAS PubMed.
- L. Zhang, Y. Wu, X. Luo, T. Jia, K. Li, L. Zhou, Z. Mao and P. Huang, A novel insight into mechanism of derangement of coagulation balance: interactions of quantum dots with coagulation-related proteins, Part. Fibre Toxicol., 2022, 19, 17 CrossRef CAS PubMed.
- J. Liu, W. Zhao, R.-L. Fan, W.-H. Wang, Z.-Q. Tian, J. Peng, D. W. Pang and Z. L. Zhang, Investigation of the nonspecific interaction between quantum dots and immunoglobulin G using Rayleigh light scattering, Talanta, 2009, 78, 700–704 CrossRef CAS PubMed.
- B. Gidwani, V. Sahu, S. S. S. R. Pandey, V. Joshi, V. K. Jain and A. Vyas, Quantum dots: Prospectives, toxicity, advances and applications, J. Drug Delivery Sci. Technol., 2021, 61, 102308 CrossRef CAS.
- H. Zhang, H. Wang, H. Yang, D. Zhou and Q. Xia, Luminescent, protein-binding and imaging properties of hyper-stable water-soluble silicon quantum dots, J. Mol. Liq., 2021, 331, 115769 CrossRef CAS.
- K. Aho, M. Heliovaara, P. Knekt, A. Reunanen, A. Aromaa, A. Leino, P. Kurki, R. Heikkila and T. Palosuo, Serum immunoglobulins and the risk of rheumatoid arthritis, Ann. Rheum. Dis., 1997, 56, 351–356 CrossRef CAS PubMed.
- H. W. Schroeder Jr and L. Cavacini, Structure and Function of Immunoglobulins, J. Allergy Clin. Immunol., 2010, 125, S41–S52 CrossRef PubMed.
- Y. Zhang, J. L. Y. Wu, J. Lazarovits and W. C. W. Chan, An Analysis of the Binding Function and Structural Organization of the Protein Corona, J. Am. Chem. Soc., 2020, 142, 8827–8836 CrossRef PubMed.
- R. Rampado, S. Crotti, P. Caliceti, S. Pucciarelli and M. Agostini, Recent Advances in Understanding the Protein Corona of Nanoparticles and in the Formulation of “Stealthy” Nanomaterials, Front. Bioeng. Biotechnol., 2020, 8, 166 CrossRef PubMed.
- M. Rankl, T. Ruckstuhl, G. R. J. Artus, A. Walser and S. Seeger, Conformational Reorientation of Immunoglobulin G During Nonspecific Interaction with Surfaces, ChemPhysChem, 2006, 7, 837–846 CrossRef CAS PubMed.
- K. T. Yong, W. C. Law, R. Hu, L. Ye, L. Lie, M. T. Swihart and P. N. Prasad, Nanotoxicity assessment of quantum dots: from cellular to primate studies, Chem. Soc. Rev., 2013, 42, 1236 RSC.
- T. Lima, K. Bernfur, M. Vilanova and T. Cedervall, Understanding the Lipid and Protein Corona Formation on Different Sized Polymeric Nanoparticles, Sci. Rep., 2020, 10, 1129 CrossRef CAS PubMed.
- S. Chinnathambi, S. Karthikeyan, N. Hanagata and N. Shirahata, Molecular interaction of silicon quantum dot micelles with plasma proteins: hemoglobin and thrombin, RSC Adv., 2019, 9, 14928–14936 RSC.
- S. Chinnathambi, N. Abu and N. Hanagata, CdSe/ZnS quantum dot micelles for long-term cell imaging without alteration to the native structure of the blood plasma protein human serum albumin, RSC Adv., 2017, 7, 2392–2402 RSC.
- R. Cukalevski, S. A. Ferreira, C. J. Dunning, T. Berggård and T. Cedervall, IgG and fibrinogen driven nanoparticle aggregation, Nano Res., 2015, 8, 2733–2743 CrossRef CAS.
- R. Hassan, Interactions between Gold Nanoparticles and Immunoglobulin Isotypes, Electron. Theses Diss., 2020, 509 Search PubMed.
- Z. Y. Lin, T. U. L. Ping, Z. Q. Hui and K. X. Gui, Effect of protein molecules on the photoluminescence properties and stability of water-soluble CdSe/ZnS core-shell quantum dots, Chin. Sci. Bull., 2013, 58(21), 2616–2621 CrossRef.
- K. Naruse, M. Kinoshita, K. Murata and M. Tanaka, Medaka: Biology, management and experimental protocols, Wiley-Blackwell Publications, 2009, pp. 31–66, DOI:10.1002/9780813818849.
- T. A. Halgren, R. B. Murphy, R. A. Friesner, H. S. Beard, L. L. Frye, W. T. Pollard and J. L. Banks, Glide: A New Approach for Rapid, Accurate Docking and Scoring. 2. Enrichment Factors in Database Screening, J. Med. Chem., 2004, 47, 1750–1759 CrossRef CAS PubMed.
- R. A. Friesner, J. L. Banks, R. B. Murphy, T. A. Halgren, J. J. Klicic, D. T. Mainz, M. P. Repasky, E. H. Knoll, D. E. Shaw, M. Shelley, J. K. Perry, P. Francis and P. S. Shenkin, Glide: A New Approach for Rapid, Accurate Docking and Scoring. 1. Method and Assessment of Docking Accuracy, J. Med. Chem., 2004, 47, 1739–1749 CrossRef CAS PubMed.
- R. Farid, T. Day, R. A. Friesner and R. A. Pearlstein, New insights about HERG blockade obtained from protein modeling, potential energy mapping, and docking studies, Bioorg. Med. Chem., 2006, 14, 3160–3173 CrossRef CAS PubMed.
- W. Sherman, T. Day, M. P. Jacobson, R. A. Friesner and R. Farid, Novel Procedure for Modeling Ligand/Receptor Induced Fit Effects, J. Med. Chem., 2006, 49, 534–553 CrossRef CAS PubMed.
- W. Sherman, H. S. Beard and R. Farid, Use of an Induced Fit Receptor Structure in Virtual Screening, Chem. Biol. Drug Des., 2006, 67, 83–84 CrossRef CAS PubMed.
- Biologics Suite 2018-2, Schrödinger, LLC, 2018, New York, NY, vol. 2 Search PubMed.
- B. Ghosh, T. Hamaoka, Y. Nemoto, M. Takeguchia and N. Shirahata, Impact of anchoring monolayers on the enhancement of radiative recombination in light-emitting diodes based on silicon nanocrystals, J. Phys. Chem. C, 2018, 122, 6422–6430 CrossRef CAS.
- U. R. Kortshagen, R. M. Sankaran, R. N. Pereira, S. L. Girshick, J. J. Wu and E. S. Aydil, Nonthermal plasma synthesis of nanocrystals: Fundamental principles, materials, and applications, Chem. Rev., 2016, 116, 11061–11127 CrossRef CAS PubMed.
- K. Dohnalová, A.
N. Poddubny, A. A. Prokofiev, W. D. de Boer, C. P. Umesh, J. M. J. Paulusse, H. Zuilhof and T. Gregorkiewicz, Surface brightens up Si quantum dots: Direct bandgap-like size-tunable emission, Light: Sci. Appl., 2013, 2, e47 CrossRef.
- W. Zhang, Y. Shi, Y. Chen, J. Ye, X. Sha and X. Fang, Multifunctional Pluronic P123/F127 mixed polymeric micelles loaded with paclitaxel for the treatment of multidrug resistant tumors, Biomaterials, 2011, 32, 2894–2906 CrossRef CAS PubMed.
- B. K. Paul, K. Bhattacharjee, S. Bose and N. Guchhait, A spectroscopic investigation on the interaction of a magnetic ferrofluid with a model plasma protein: Effect on the conformation and activity of the protein, Phys. Chem. Chem. Phys., 2012, 14, 15482–15493 RSC.
- H. A. Benesi and J. H. Hildebrand, A Spectrophotometric Investigation of the Interaction of Iodine with Aromatic Hydrocarbons, J. Am. Chem. Soc., 1949, 71(8), 2703–2707 CrossRef CAS.
- S. Chinnathambi, D. Velmurugan, N. Hanagata, P. Aruna and S. Ganesan, Investigations on the interactions of 5-fluorouracil with bovine serum albumin: Optical spectroscopic and molecular modeling studies, J. Lumin., 2014, 151, 1–10 CrossRef CAS.
- F. D. Catherine and R. A. Gemeinhart, Biophysical Characterization of Interactions between Serum Albumin and Block Copolymer Micelles, ACS Biomater. Sci. Eng., 2022, 8(7), 2899–2907 CrossRef PubMed.
- V. D. Suryawanshi, P. V. Anbhule, A. H. Gore, S. R. Patil and G. B. Kolekar, Spectroscopic Investigation on the Interaction of Pyrimidine Derivative, 2-Amino-6-hydroxy-4-(3,4-dimethoxyphenyl)-pyrimidine-5-carbonitrile with Human Serum Albumin: Mechanistic and Conformational Study, Ind. Eng. Chem. Res., 2012, 51, 95–102 CrossRef CAS.
- W. R. Ware, Oxygen quenching of fluorescence in solution-An experimental study of diffusion process, J. Phys. Chem., 1962, 66, 455–458 CrossRef CAS.
- S. Karmakar, T. K. Das, S. Kundu, S. Maiti and A. Saha, Physicochemical Understanding of Protein-Bound Quantum DotBased Sensitive Probing of Bilirubin: Validation with Real Samples and Implications of Protein Conformation in Sensing, ACS Appl. Bio Mater., 2020, 3, 8820–8829 CrossRef CAS PubMed.
- B. Ghosh, M. Takeguchi, J. Nakamura, Y. Nemoto, T. Hamaoka, S. Chandra and N. Shirahata, Origin of the photoluminescence quantum yields enhanced by alkane-termination of freestanding silicon nanocrystals: Temperature-dependence of optical properties, Sci. Rep., 2016, 6, 36951 CrossRef CAS PubMed.
- A. Micsonai, F. Wien, L. Kernya, Y.-H. Lee, Y. Goto, M. Réfrégiers and J. Kardos, Accurate secondary structure prediction and fold recognition for circular dichroism spectroscopy, Proc. Natl. Acad. Sci. U. S. A., 2015, 112, E3095–E3103 CrossRef CAS PubMed.
- A. Micsonai, F. Wien, E. Bulyáki, J. Kun, E. Moussong, Y. H. Lee, Y. Goto, M. Réfrégiers and J. K. BeStSel, A web server for accurate protein secondary structure prediction and fold recognition from the circular dichroism spectra, Nucleic Acids Res., 2018, 46, W315–W322 CrossRef CAS PubMed.
- S. Islam, Moinuddin, A. R. Mir, A. Raghav, S. Habib, K. Alam and A. Ali., Glycation, Oxidation and Glycoxidation of IgG: A Biophysical, Biochemical, Immunological and Hematological study, J. Biomol. Struct. Dyn., 2018, 36, 2637–2653 CrossRef CAS PubMed.
- S. Pramanik, S. K. E. Hill, B. Zhi, N. V. Hudson-Smith, J. J. Wu, J. N. White, E. A. McIntire, V. S. Santosh, K. Kondeti, A. L. Lee, P. J. Bruggeman, U. R. Kortshagen and C. L. Haynes, Comparative toxicity assessment of novel Si quantum dots and their traditional Cd-based counterparts using bacteria models Shewanella oneidensis and Bacillus subtilis, Environ. Sci.: Nano, 2018, 5, 1890–1901 RSC.
- G. Sahay, E. V. Batrakova and A. V. Kabanov, Different Internalization Pathways of Polymeric Micelles and Unimers and Their Effects on Vesicular Transport, Bioconjugate
Chem., 2008, 19, 2023–2029 CrossRef CAS PubMed.
- J. Zastre, J. Jackson, M. Bajwa, R. Liggins, F. Iqbal and H. Burt, Enhanced cellular accumulation of a P-glycoprotein substrate, rhodamine-123, by Caco-2 cells using low molecular weight methoxypolyethylene glycol-block-polycaprolactone diblock copolymers, Eur. J. Pharm. Biopharm., 2002, 54, 299–309 CrossRef CAS PubMed.
- M. Liang, I. C. Lin, M. R. Whittaker, R. F. Minchin, M. J. Monteiro and I. Toth, Cellular Uptake of Densely Packed Polymer Coatings on Gold Nanoparticles, ACS Nano, 2010, 4, 403–413 CrossRef CAS PubMed.
- W. Phatvej, H. K. Datta, S. C. Wilkinson, E. Mutch, A. K. Daly and B. R. Horrocks, Endocytosis and Lack of Cytotoxicity of Alkyl-Capped Silicon Quantum Dots Prepared from Porous Silicon, Materials, 2019, 12, 1702 CrossRef CAS PubMed.
- Y. Xiao, S. P. Forry, X. Gao, R. D. Holbrook, W. G. Telford and A. Tona, Dynamics and mechanisms of quantum dot nanoparticle cellular uptake, J. Nanobiotechnol., 2010, 8, 13 CrossRef PubMed.
- K. W. H. Kwok, M. Auffan, A. R. Badireddy, C. M. Nelson, M. R. Wiesner, A. Chilkoti, J. Liu, S. M. Marinakos and D. E. Hinton, Uptake of silver nanoparticles and toxicity to early life stages of Japanese medaka (Oryzias latipes): Effect of coating materials, Aquat. Toxicol., 2012, 120–121, 59–66 CrossRef CAS PubMed.
- S. Kashiwada, Distribution of Nanoparticles in the See-through Medaka (Oryzias latipes), Environ. Health Perspect., 2006, 114, 1697–1702 CrossRef CAS PubMed.
- N. Yan and W. X. Wang, Maternal transfer and biodistribution of citrate and luminogens coated silver nanoparticles in medaka fish, J. Hazard. Mater., 2022, 433, 128862 CrossRef CAS PubMed.
|
| This journal is © The Royal Society of Chemistry 2023 |
Click here to see how this site uses Cookies. View our privacy policy here. 
 Open Access Article
 This Open Access Article is licensed under a
  *ab,
Naoto Shirahata
*ab,
Naoto Shirahata