DOI:
10.1039/D3RA00549F
(Paper)
RSC Adv., 2023,
13, 12917-12924
Crystallization behavior of polyvinylidene fluoride (PVDF) in NMP/DMF solvents: a molecular dynamics study†
Received
26th January 2023
, Accepted 13th April 2023
First published on 25th April 2023
Abstract
In this study, the crystallization behavior of polyvinylidene fluoride (PVDF) in NMP/DMF solvent at 9 to 67 weight percent (wt%) was analyzed by molecular dynamics (MD) simulation. The PVDF phase did not gradually change with the incremental increase in PVDF wt%, but displayed rapid shifts at 34 and 50 wt% in both solvents. The solvation behavior between the two solvents was quite identical from the similar radial distribution functions. However, PVDFs in DMF solvent showed a higher ratio of β phase crystalline structures than those in NMP solvent. It was found that DMF solvents were more tightly packed near trans state PVDF fluorine compared to NMP solvents. Also, NMP oxygen atoms interacted more favorably with gauche state PVDF hydrogen atoms over DMF oxygen atoms. The evaluation of properties observed in atomic scale interactions, such as trans state inhibition and gauche state preference, can be used as indicators in future solvent research.
1 Introduction
The demand for better battery performance has led to developments in the high energy/power density and long lifetime of lithium ion batteries (LIB), which consist of an electrolyte, separator, additives and electrode.1–3 In the functioning of an electrode, battery slurry is the main component that controls ion transport speed, battery lifetime, and charging time.4–6 Battery slurry consists of active materials, conductive additives, binders, solvents and dispersants. Active materials, which act as a reservoir where the exchange of lithium ions and electrons take place, are bound to conductive additives to increase conductivity.5 For binder materials, carboxymethyl cellulose (CMC) or styrene-butadiene rubber (SBR) in water are commonly used in aqueous systems and polyvinylidene fluoride (PVDF) in n-methyl-2-pyrrolidinone (NMP) solvent is used in non-aqueous systems. Graphite is currently used as an active material (anode) and recent studies have shown that adding carbon nanotubes (CNTs) improves the capacity and mechanical properties of the battery electrode simultaneously.7,8 In this case, the aggregation issue of CNTs is controlled by adding hydrogenated NBR (HNBR) which can be used as a dispersant.9
While NMP is the commercially preferred solvent up to now, it is a toxic compound that can damage the skin, eyes, and respiratory system, which has led to legislation limiting the use of NMP to solutions below 0.3% by Registration, Evaluation, Authorization and Restriction of Chemicals (REACH).10–12 As organic solvents are expensive and consume lots of energy in the recovery process, research on replacing organic solvents with aqueous solutions has been recently conducted.13 The adaption of an aqueous process may reduce battery production costs, but the high surface tension of water results in poor wetting of the current collector, heterogeneous distribution, and cracks during the drying process.14 Therefore, efforts have been made to find a low toxicity organic solvent to substitute NMP. Dimethyl sulfoxide (DMSO) can dissolve PVDF, but the sulfur containing byproducts (DMSO degrades above 40 °C) cause self-discharge defects.15,16 Cyrene is also a candidate, but low adhesion and cracks resulting from poor PVDF solubility make it unsuitable for the fabricating process.17 However, in case of N,N-dimethylmethanamide (DMF), DMF has a lower boiling point (155 °C) than NMP (202 °C) which could save energy during the drying process and has a high auto-ignition temperature which is safe for use.18 DMF is inexpensive and has a similar polarity, dielectric constant and surface tension as NMP, which makes DMF a promising substitute for NMP in the battery slurry coating process.19 Despite these advantages, DMF is considered to be relatively poor dispersant compared to NMP for conductive additives in battery slurry processing. Therefore, a detailed design principle at the atomic level for the use of DMF as a solvent in battery slurry processing is required.
Until now, studies of PVDF have been focused on the dielectric properties of different PVDF phases (α, β, and γ) and the phase behavior during the manufacturing process under external stress.20–22 Through the use of multistage stretching, inclusion of ionic liquids, and an annealing process combined with pressure fields, it was possible to produce higher yield of the β phase of PVDF.23–25 Also, it has been reported that the solvent type and solvent evaporation rate significantly affect PVDF phases and crystallinity.26 However, detailed studies of PVDF phase behaviors in solution such as the relation between PVDF phases and its concentration or the interactions between PVDF and the solvent at the atomic scale have not yet been reported. Herein, an all-atom molecular dynamics simulation was used to investigate 15 repeat units of PVDF with varying percentage weight (wt%) in two different solvents, NMP and DMF. PVDF in both solvents showed three phases with increasing PVDF wt%: amorphous, intermediate, and crystalline phases. PVDF is more soluble in NMP than DMF, which was evaluated by the crystallinity that was quantified by the β phase ratio of PVDF in solution. Interactions between PVDF and the solvents were generally similar, but two different points were investigated. The first one was the compact packing of DMF near the β phase of the PVDF fluorine groups and the second one was the preference of NMP oxygen atoms near the gauche state PVDF hydrogen groups. We found that minor differences in the atomic arrangement between solvents resulted in differences in the interactions with PVDF, which had a significant impact on crystallization. From our study, the interactions between PVDF–solvent and their corresponding structures were evaluated. These interactions can be used as an indicator for evaluating solvent appropriateness in future battery slurry design.
2 Results and discussion
2.1 Phase analysis
Crystallization behaviors of PVDF in NMP/DMF solvent with varying PVDF wt% (9, 19, 27, 34, 40, 46, 50, 60, and 67) were analyzed using an all-atom molecular dynamics (MD) simulation. Visualized system structure snapshots with increasing PVDF wt% in both solvents are shown in Fig. S1 and S2.† For both solvents containing PVDF systems, it was observed that increasing PVDF concentration resulted in more linear conformations of PVDF chains. At concentration below 20 wt%, PVDF in both solvents was well solvated as shown in Fig. 1. However, crystallization of PVDF was observed in both solvents above 50 wt% of PVDF and the critical concentration of PVDF which results in crystallization was further explored. Therefore, PVDF conformation analysis was performed to quantify the degree of PVDF crystallinity as a function of concentration of PVDF in solution.
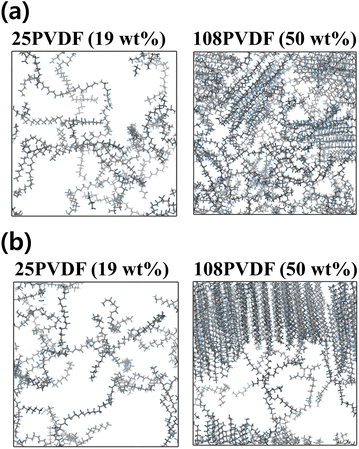 |
| | Fig. 1 Simulation snapshots of PVDF 19 wt% and 50 wt% in (a) NMP and (b) DMF. | |
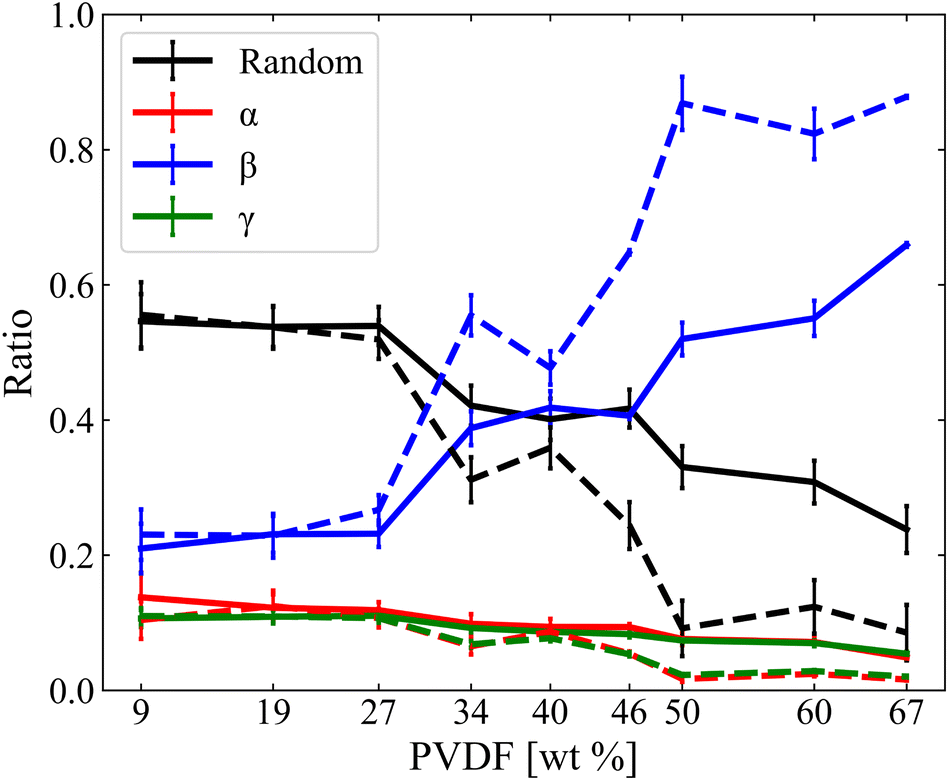
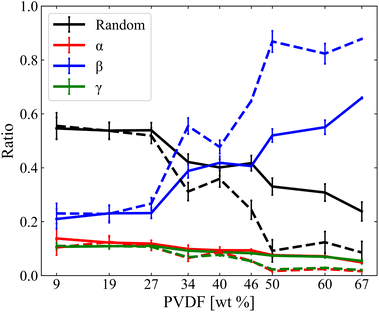
The structure of PVDF chains can be divided into trans, T segment and gauche, G segment as shown in Fig. 2(a) and the three representative local PVDF conformations, α, β, and γ, can be defined by their sequential arrangements of T and G segments as shown in Fig. 2(b). The α phase refers to sequential TGTG′, the β phase refers to sequential TTTT, the γ refers to sequential TTTG, and the other phases were referred to as Random. The linear conformation of the β phase of PVDF was characterized by aligned hydrogen atoms on one side and aligned fluorine atoms on the other side where hydrogen has a positive partial charge and fluorine has a negative partial charge. PVDF in this structural arrangement is polar and ferroelectric when stacked in order (hydrogen atoms facing fluorine atoms of the other PVDF chains) which results in the crystallization of PVDF as shown in Fig. 2(c).27–29 Thus, in this study, the crystallinity of PVDF was defined by the ratio of the β phase segments present in all PVDF chains at each simulated system and the ratio of the β phase was calculated and is shown in Fig. 3.
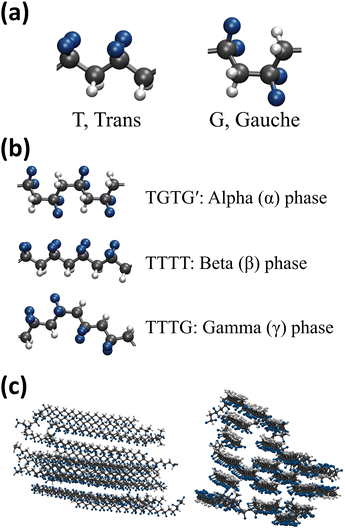 |
| | Fig. 2 Simulation snapshot of (a) trans and gauche segment of PVDF, (b) conformation of three PVDF phases: α, β, and γ, and (c) stacked β phase crystalline PVDF. | |
 |
| | Fig. 3 Phase ratios of α, β, γ, and Random as a function of PVDF wt% in NMP (solid line) and DMF (dashed line). | |
PVDF in both solvents showed an increase in β phase ratio with the incremental increase of PVDF wt%. The β phase ratio was generally higher for PVDF in DMF solvent than those in NMP solvent and this difference increased as the PVDF wt% increased. Crystallinity (β phase ratio) did not increase gradually with PVDF wt%, but instead considerably increased showing three distinctive phases: amorphous, intermediate, and crystalline. PVDF in both solvents showed an amorphous phase below 27 wt%. At this phase, PVDF in both solvents showed a similar β phase ratio. However, at the intermediate phase where the concentration of PVDF ranged from 27% to 50 wt%, differences in β phase ratio started to grow. The crystalline phase was observed for PVDF concentrations above 50 wt% in both solvents. The difference in β phase ratio of PVDF in different solvents slightly decreased at PVDF of 67 wt%, but it became apparent that PVDF in DMF solvent showed higher PVDF crystalline behavior than PVDF in NMP solvent. The α and γ phases appeared with similar ratio for PVDF in both solvents. As the increment in the β phase ratio of PVDF was considerably greater with DMF than with NMP, relative decrements of the ratio of other phases such as α, γ, and Random were greater with PVDF in DMF than with NMP. This result can be interpreted as PVDF having two critical concentrations that undergo phase changes rapidly in both solvents.
2.2 Structural analysis
Structural analysis using the radial distribution function (RDF) and dihedral angle histogram were performed for detailed interpretation of PVDF chain conformation in both solvents.
2.2.1 Radial distribution function analysis. | |
 | (1) |
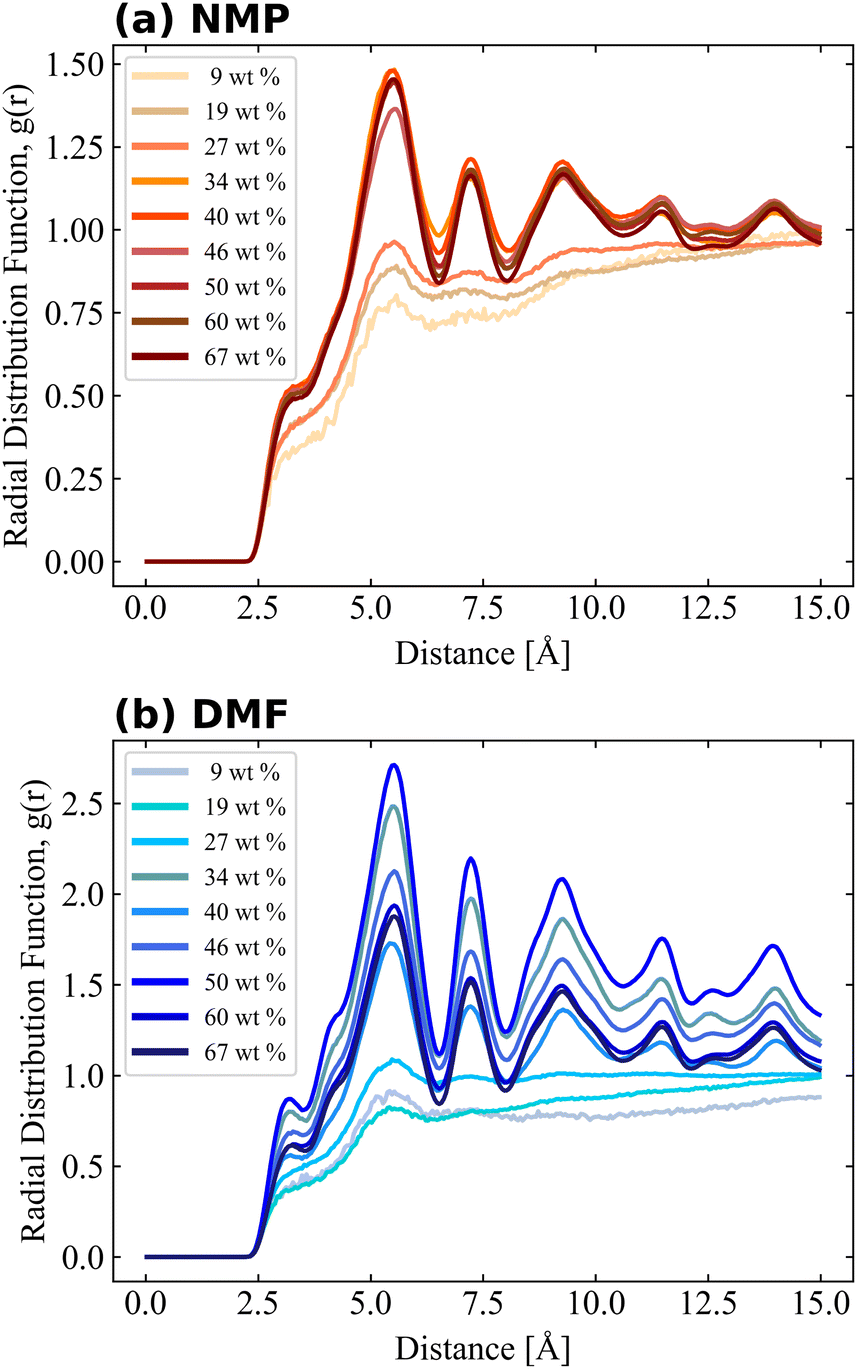
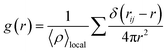
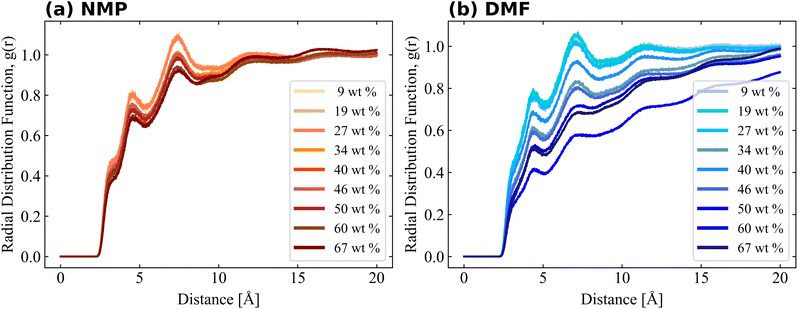
Local atomic arrangements of target molecules can be interpreted by RDF analysis as shown in eqn (1), which was performed for PVDF–PVDF and PVDF–solvent pairs. The impact of PVDF crystallization on local PVDF arrangements was observed from the RDF of fluorine–fluorine of PVDF (calculated with the exception of those in the same PVDF chain) as shown in Fig. 4. The RDF results of 9, 19, and 27 wt% of PVDF showed a relatively smooth shape, but the RDF considerably changed when more PVDF was introduced into the solvent, indicating that PVDF chains were well dissolved at 9, 19, and 27 wt% of PVDF in both solvents, but the repeated appearance of sharp RDF peaks over 34 wt% of PVDF in both solvents was evidence of crystalline structure, which was highly correlated with the β phase ratio shown in Fig. 3. As fluorine atoms generally interacts with oppositely charged hydrogen atoms, the first peak was found at a distance of 5.5 Å, which was the distance between the fluorine atoms of two aligned PVDF chains. The magnitude of RDF was higher for PVDF in DMF as more β phase PVDF crystallization was present in DMF as shown in Fig. 3. Also, the shoulder peak at 3.2 Å became clear at high PVDF wt% in DMF. Proximal distance fluorine interactions were mostly observed when the aligned β phase of PVDF was stacked in reverse order as shown in Fig. S3.†
 |
| | Fig. 4 Radial distribution function of PVDF fluorine–fluorine. Fluorine atoms in the same molecule were excluded from the RDF calculation. | |
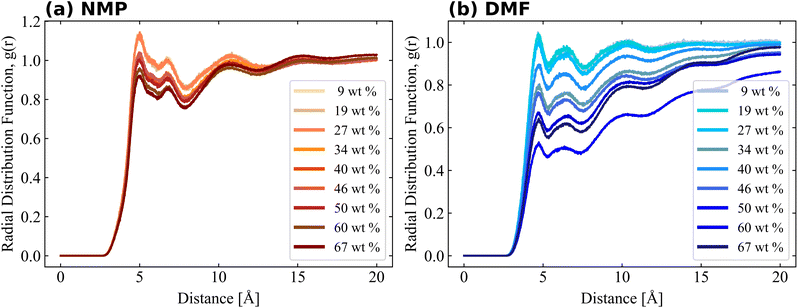
Bulk simulation without PVDF was also performed and solvent–solvent RDFs are also shown in Fig. S4† for comparison purposes. RDFs of both solvents had similar shapes and shoulders near their first peaks, but the shoulder location of the RDF of NMP was present prior to the first peak, while the shoulder of DMF was present after the first peak. The RDF of PVDF fluorine–solvent center of mass (CM) and PVDF hydrogen–solvent CM are shown in Fig. 5 and 6, respectively. The RDF of PVDF fluorine–NMP CM (Fig. 5(a)) and the RDF of PVDF hydrogen–NMP CM (Fig. 6(a)) showed three distinguishable groups, where each group was categorized by the presence of an amorphous phase [9, 19, 27 wt% of PVDF], an intermediate phase [34, 40, 46 wt% of PVDF], and a crystalline phase [50, 60, 67 wt% of PVDF]. In the case of the RDF of PVDF fluorine–DMF CM (Fig. 5(b)) and RDF of PVDF hydrogen–DMF CM (Fig. 6(b)), the RDF dropped noticeably with increasing PVDF concentration, which was also proportional to an increased β phase ratio as shown in Fig. 3.
 |
| | Fig. 5 Radial distribution function of PVDF fluorine–CM of (a) NMP and (b) DMF. | |
 |
| | Fig. 6 Radial distribution function of PVDF hydrogen–CM of (a) NMP and (b) DMF. | |
Notably the shapes of the RDFs for both PVDF fluorine and hydrogen groups in both solvents were generally similar. In the case of RDFs of PVDF hydrogen groups, both solvents (Fig. 6(a) and (b)) had an almost identical shape, meaning that the interactions and packing behavior of PVDF hydrogen groups and the solvents were similar. Locations of the first and second peak of the RDF of PVDF hydrogen–NMP and PVDF hydrogen–DMF were 4.6, 7.5 Å, and 4.5, 7.2 Å, respectively. Due to the different bulkiness of the solvent, RDF peak distances were slightly different (0.1 Å–0.3 Å). For the RDFs of PVDF fluorine–NMP and PVDF fluorine–DMF (Fig. 5(a) and (b)), while RDFs with NMP had weak second peaks at 6.8 Å, RDFs with DMF had relatively clear second peaks at 6.4 Å. From the pure solvent–solvent RDF (Fig. S4†), the approximate distance between the first and second peaks was 5 Å. From this, we can assume that the second peaks (6.8, 6.4 Å in Fig. 5) could be interpreted as a 1.5 peak, which was located between the first peak (∼5 Å) and the second peak (∼10 Å). A clear 1.5 peak in the RDF of PVDF fluorine–DMF elucidated that DMF formed a more tightly stacked structure near PVDF fluorine groups than NMP.
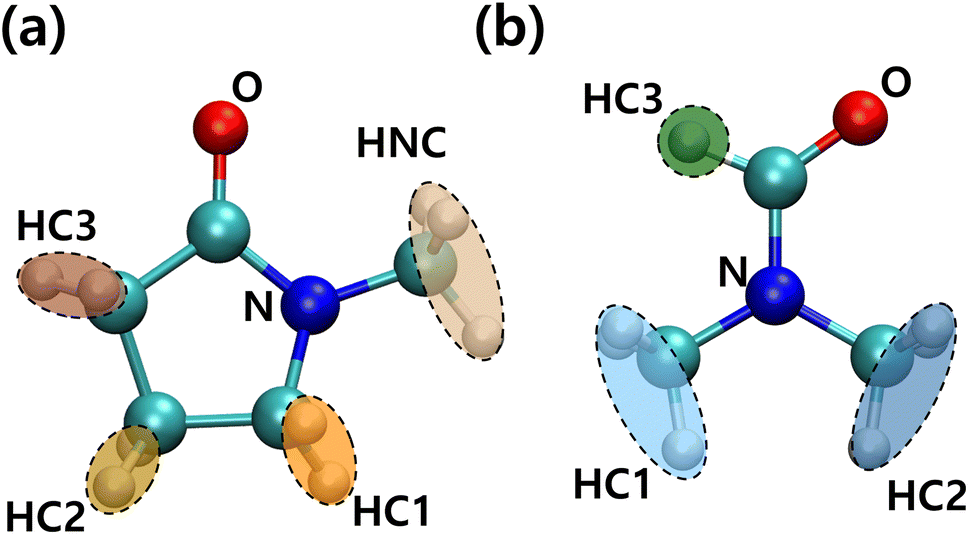
For more detailed PVDF–solvent RDF analysis, solvent atoms were grouped by similar charged atoms and each group of atoms was used in RDF analysis. In this way, we analyzed the structural preference which was ignored when the RDF was calculated using the CM of the solvents. Grouped atoms and corresponding group names are shown in Fig. 7. RDFs were calculated between atom groups of opposite charges. The RDFs of PVDF fluorine–solvent hydrogen and PVDF hydrogen–solvent nitrogen or oxygen are shown in Fig. S5 and S6,† respectively. Both RDFs of PVDF hydrogen and fluorine groups with solvents decreased with an incremental increase in PVDF wt% due to an increased β phase ratio of PVDF, which was consistent with the previous results. Because crystalline PVDFs with a β phase were stacked and rarely surrounded by solvent, analysis was focused on the systems of PVDF concentration below 27 wt% (amorphous phase). From Fig. S5,† specific preferences between PVDF fluorine atoms and solvent hydrogen groups were not found. Besides, the overall RDF values were less than 1, which meant that the interactions between PVDF fluorine atoms and both solvents were not favored.
 |
| | Fig. 7 Conformation and names of groups in (a) NMP and (b) DMF. | |
The RDFs of PVDF hydrogen groups with nitrogen and oxygen containing groups of the solvents are shown in Fig. S6.† NMP oxygen (ketone) could favorably interact with and become surrounded by oppositely charged PVDF hydrogen groups. However, in the case of DMF, positively charged DMF formyl hydrogen (HC3) caused coulomb repulsion and steric hindrance to PVDF hydrogen groups, which induced a lower interaction energy between DMF oxygen and PVDF hydrogen groups as compared to NMP oxygen groups. When solvent oxygen groups were located within 3.8 Å from PVDF hydrogen groups (first shell), the conformations of segments (trans or gauche) including the hydrogen groups were summed up to a PVDF trans conformation ratio as shown in Fig. S7.† The proportion of trans segments of PVDF increased with increased PVDF wt% in both solvents, but the incremental increase was greater in DMF than in NMP. Although the absolute amount of the β phase in the DMF solvent was greater than that in the NMP solvent at high PVDF wt% (Fig. 3), Fig. S7† only counted the segments that were interacting with solvents. This meant that the crystallized PVDF chains which were surrounded by other PVDF chains were not counted in the calculation and the difference in the trans ratio between the solvents was up to 10%. This showed that the strong interactions between PVDF hydrogen groups and NMP oxygen groups hindered the formation of trans segments of PVDF.
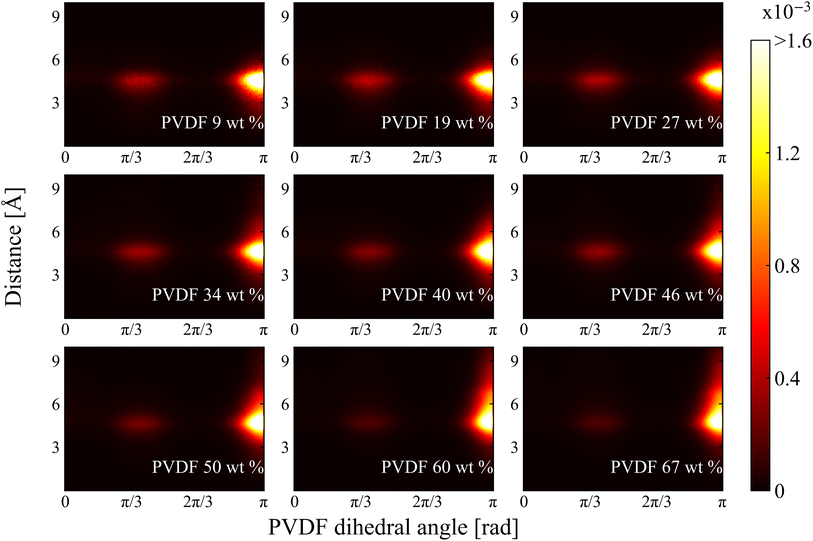
2.2.2 Dihedral angle and histogram analysis. The normalized 2D histograms of chain conformation as a function of nearest distance from solvent CM to PVDF fluorine and corresponding PVDF dihedral angle in NMP and DMF are shown in Fig. 8 and 9, respectively. Two major distributions are found at both histograms: one is at dihedral angle π/3 (gauche) and the other one is at π (trans). The approximate distances are 4.8 Å and 4.6 Å for NMP and DMF, respectively. The distances were almost the same as the previously calculated RDF first peak locations shown in Fig. 5. The distribution magnitude at the trans conformation was greater than the distribution at the gauche conformation, which indicated that PVDF preferentially adopts a linear conformation even at a lower PVDF wt%. Even though the distribution of the gauche conformation was relatively low, these gauche conformations were evenly distributed between the trans conformations so that the ratio of the β phase was low for low PVDF wt% as shown in Fig. 3. With increased PVDF wt%, the population of the gauche conformation decreased and the population of the trans conformation increased in both solvents. A newly developed distribution was found with the incremental increase in PVDF wt% in both solvents, where the dihedral angle was π (trans) with the nearest distance further than 5 Å. However, the newly developed area of distribution of the trans conformation in DMF solvent was wider and stronger than that in NMP solvent. The distance of the newly developed region was approximately 6 Å, which was the same distance as the location of the previously discussed RDF 1.5 peak in Fig. 5. The following conclusion can be drawn: DMF solvents formed a compactly packed structure (1.5 peak) near the trans conformation of PVDF fluorine groups which contributed to the formation of β phase structures that led to crystallization.
 |
| | Fig. 8 2D histogram of chain conformation as a functions of PVDF dihedral angle and distance between nearest solvent CM and PVDF fluorine in NMP. | |
 |
| | Fig. 9 2D histogram of chain conformation as a functions of PVDF dihedral angle and distance between nearest solvent CM and PVDF fluorine in DMF. | |
3 Discussion and conclusions
In this study, the crystallization behavior of PVDF in both NMP and DMF were determined. As the linear conformation of PVDF increased with increased PVDF wt%, the degree of crystallization was quantified by the ratio of the β phase of PVDF chains in the solvents. PVDF in both NMP and DMF solvents showed two sharp changes in the β phase ratio near 34 wt% of PVDF and 50 wt% of PVDF, which were used as a classification of three distinct phases: amorphous, intermediate, and crystalline. From PVDF fluorine–fluorine RDF analysis, the emergence of β phase stacking over 34 wt% of PVDF could be observed from the repeated appearance of sharp peaks, which indicated the formation of crystalline PVDF chains. In the case of RDF analysis of PVDF–solvent, plots were very similar for shape in both solvents, which showed that the interactions between PVDF and solvents were quite similar. However, as the gauche conformation of PVDF hydrogen groups preferentially interacts with NMP oxygen groups than with DMF oxygen groups, the PVDF trans conformation ratio was reduced in NMP. Also, in the analysis of the RDFs of PVDF fluorine groups and solvents, DMF was more tightly packed near PVDF fluorine groups than NMP. This phenomenon was also determined from normalized 2D histogram analysis that showed the formation of a noticeable distribution at the PVDF dihedral angle π (trans) at a distance of 6 Å between PVDF fluorine groups and solvent CM. Our study showed that the degree of PVDF crystallization was dependent on the specific concentration of PVDF and was also affected by the structural interactions from different atomic arrangements of solvents, and that these results need to be considered when designing a battery slurry solvent in the future.
4 Simulation method
PVDF chains with 9, 19, 27, 34, 40, 46, 50, 60, and 67 wt% in NMP/DMF solvent were built by changing the number of PVDF in the system while maintaining the number of solvent molecules. The number of DMF molecules was fixed to 1395 and the number of NMP molecules was fixed to 1030 to match the total volume occupied by solvents. The exact number of molecules and weight percent are shown in Table S1.† For all systems, a short 4 ns NPT run at 353 K was performed for equilibration followed by a 10 ns NVT run at 500 K to escape from any possible meta-stable states. A final 40 ns NPT production run at 353 K was carried out and the last 2 ns trajectory was used in phase analysis, RDF analysis, and heatmap analysis. All atom MD simulation was performed using GROMACS30,31 molecular dynamics simulation package. Force field parameters for PVDF, NMP, and DMF were generated by LigParGen32–34 force field generator based on optimized potentials for liquid simulation-all-atom (OPLS-AA) force field. The cutoff distance for short-range coulomb and van der Waals interactions was set to 1 nm. The particle mesh Ewald35 method was used for long-range interactions further away than the cutoff distance. LINCS algorithm36 was used for constraining bond lengths and the integration time step of 2 fs was used for both Nosé–Hoover thermostat37,38 and Parrinello–Rahman pressure coupling39 during the simulation.
Conflicts of interest
There are no conflicts to declare.
Acknowledgements
A. P., and J. J. contributed equally to this work. This work was supported by the National Research Foundation of Korea (NRF) grant, funded by the Ministry of Science and ICT, Republic of Korea (Grant No. NRF-2021M3H4A6A01041234, NRF-2022M3H4A6A01037200, NRF-2022R1F1A1074976, and NRF-2018M3D1A1058633).
Notes and references
- C. Liu, T. Li, H. Zhang, Z. Song, C. Qu, G. Hou, H. Zhang, C. Ni and X. Li, Sci. Bull., 2020, 65, 434–442 CrossRef CAS PubMed.
- Y. Liu, R. Zhang, J. Wang and Y. Wang, iScience, 2021, 24, 102332 CrossRef CAS PubMed.
- Y.-S. Hu and Y. Lu, 2019 Nobel prize for the Li-ion batteries and new opportunities and challenges in Na-ion batteries, 2019 Search PubMed.
- B. Ludwig, Z. Zheng, W. Shou, Y. Wang and H. Pan, Sci. Rep., 2016, 6, 1–10 CrossRef.
- H. Zheng, R. Yang, G. Liu, X. Song and V. S. Battaglia, J. Phys. Chem. C, 2012, 116, 4875–4882 CrossRef CAS.
- W. B. Hawley and J. Li, J. Energy Storage, 2019, 25, 100862 CrossRef.
- Z. Xiong, Y. S. Yun and H.-J. Jin, Materials, 2013, 6, 1138–1158 CrossRef CAS.
- B. J. Landi, M. J. Ganter, C. D. Cress, R. A. DiLeo and R. P. Raffaelle, Energy Environ. Sci., 2009, 2, 638–654 RSC.
- J. Ahn, B. Park, J. Kim, M.-K. Um, J. W. Yi and J.-K. Yoo, ACS Appl. Mater. Interfaces, 2021, 13, 19970–19982 CrossRef CAS PubMed.
- A. Hunt and N. Dale, Organisation for Economic Co-operation and Development, 2018, 33 Search PubMed.
- J. Sherwood, T. J. Farmer and J. H. Clark, Chem, 2018, 4, 2010–2012 CAS.
- M. I. Schmied-Tobies, A. Murawski, E. Rucic, G. Schwedler, D. Bury, M. Kasper-Sonnenberg, S. Koslitz, H. M. Koch, T. Brüning and M. Kolossa-Gehring, Environ. Int., 2021, 146, 106221 CrossRef CAS PubMed.
- D. L. Wood, J. D. Quass, J. Li, S. Ahmed, D. Ventola and C. Daniel, Drying Technol., 2018, 36, 234–244 CrossRef CAS.
- K. Rollag, D. Juarez-Robles, Z. Du, D. L. Wood III and P. P. Mukherjee, ACS Appl. Energy Mater., 2019, 2, 4464–4476 CrossRef CAS.
- M. Wang, X. Dong, I. C. Escobar and Y.-T. Cheng, ACS Sustainable Chem. Eng., 2020, 8, 11046–11051 CrossRef CAS.
- O. Chernysh, V. Khomenko, I. Makyeyeva and V. Barsukov, Mater. Today: Proc., 2019, 6, 42–47 CAS.
- J. Sherwood, A. Constantinou, L. Moity, C. R. McElroy, T. J. Farmer, T. Duncan, W. Raverty, A. J. Hunt and J. H. Clark, et al., Chem. Commun., 2014, 50, 9650–9652 RSC.
- R. Sliz, J. Valikangas, H. Silva Santos, P. Vilmi, L. Rieppo, T. Hu, U. Lassi and T. Fabritius, ACS Appl. Energy Mater., 2022, 5, 4047–4058 CrossRef CAS PubMed.
- M. M. Heravi, M. Ghavidel and L. Mohammadkhani, RSC Adv., 2018, 8, 27832–27862 RSC.
- R. Gregorio and E. Ueno, J. Mater. Sci., 1999, 34, 4489–4500 CrossRef CAS.
- K. C. Satyanarayana and K. Bolton, Polymer, 2012, 53, 2927–2934 CrossRef.
- R. Gregorio Jr, J. Appl. Polym. Sci., 2006, 100, 3272–3279 CrossRef.
- J. Guan, J. Shen, X. Chen, H. Wang, Q. Chen, J. Li and Y. Li, Macromolecules, 2018, 52, 385–394 CrossRef.
- J.-Y. Ren, Q.-F. Ouyang, G.-Q. Ma, Y. Li, J. Lei, H.-D. Huang, L.-C. Jia, H. Lin, G.-J. Zhong and Z.-M. Li, Macromolecules, 2022, 55, 2014–2027 CrossRef CAS.
- C.-Y. Liu, D.-L. Li, Z.-H. Wang, Y. Li, S.-Y. Zhou, L. Xu, G.-J. Zhong, H.-D. Huang and Z.-M. Li, Macromolecules, 2023, 56, 1481–1491 CrossRef CAS.
- L. M. M. Costa, R. E. S. Bretas and R. Gregorio, et al., Mater. Sci. Appl., 2010, 1, 246–251 Search PubMed.
- R. Gregorio Jr and D. S. Borges, Polymer, 2008, 49, 4009–4016 CrossRef.
- L. Ruan, X. Yao, Y. Chang, L. Zhou, G. Qin and X. Zhang, Polymers, 2018, 10, 228 CrossRef PubMed.
- Y. Low, N. Meenubharathi, N. Niphadkar, F. Boey and K. Ng, J. Biomater. Sci., Polym. Ed., 2011, 22, 1651–1667 CrossRef CAS PubMed.
- S. Pronk, S. Páll, R. Schulz, P. Larsson, P. Bjelkmar, R. Apostolov, M. R. Shirts, J. C. Smith, P. M. Kasson and D. Van Der Spoel, et al., Bioinformatics, 2013, 29, 845–854 CrossRef CAS PubMed.
- B. Hess, C. Kutzner, D. Van Der Spoel and E. Lindahl, J. Chem. Theory Comput., 2008, 4, 435–447 CrossRef CAS PubMed.
- L. S. Dodda, J. Z. Vilseck, J. Tirado-Rives and W. L. Jorgensen, J. Phys. Chem. B, 2017, 121, 3864–3870 CrossRef CAS PubMed.
- L. S. Dodda, I. Cabeza de Vaca, J. Tirado-Rives and W. L. Jorgensen, Nucleic Acids Res., 2017, 45, W331–W336 CrossRef CAS PubMed.
- W. L. Jorgensen and J. Tirado-Rives, Proc. Natl. Acad. Sci. U. S. A., 2005, 102, 6665–6670 CrossRef CAS.
- D. M. York, T. A. Darden and L. G. Pedersen, J. Chem. Phys., 1993, 99, 8345–8348 CrossRef CAS.
- B. Hess, H. Bekker, H. J. Berendsen and J. G. Fraaije, J. Comput. Chem., 1997, 18, 1463–1472 CrossRef CAS.
- S. Nosé, J. Chem. Phys., 1984, 81, 511–519 CrossRef.
- W. G. Hoover, Phys. Rev. A, 1985, 31, 1695 CrossRef PubMed.
- M. Parrinello and A. Rahman, J. Appl. Phys., 1981, 52, 7182–7190 CrossRef CAS.
|
| This journal is © The Royal Society of Chemistry 2023 |
Click here to see how this site uses Cookies. View our privacy policy here. 
 Open Access Article
 This Open Access Article is licensed under a Creative Commons Attribution-Non Commercial 3.0 Unported Licence
 a,
Je-Yeon Jung
a,
Je-Yeon Jung