 Open Access Article
Determination of active sites on the synthesis of novel Lewis acidic deep eutectic solvent catalysts and kinetic studies in microalgal biodiesel production†
Ange Douglas Potchamyou Ngatchaa,
Anqi Zhaob,
Shen Zhangac,
Wenlong Xiong ac,
Moinuddin Sarkerd,
Jingliang Xu*ac and
Md. Asraful Alam
 *ac
*ac
aSchool of Chemical Engineering, Zhengzhou University, Zhengzhou 450001, Henan, China. E-mail: xujl@zzu.edu.cn; alam@zzu.edu.cn; Fax: +86-371-67781801; Tel: +86-130-83608578
bSchool of Life Sciences, Zhengzhou University, Zhengzhou 450001, Henan, China
cState Key Laboratory of Motor Vehicle Biofuel Technology, Zhengzhou University, Zhengzhou 450001, Henan, China
dWaste Technologies LCC, Bridgeport, CT-06606, USA
First published on 29th March 2023
Abstract
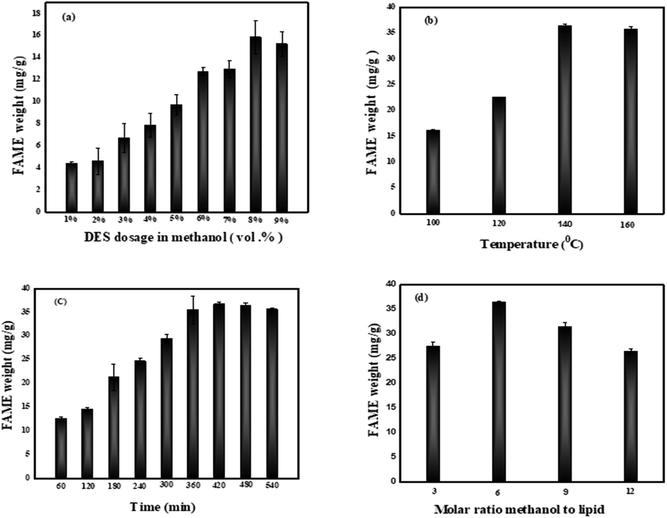
Experimental and theoretical considerations for kinetic modeling of the transesterification reaction of microalgae lipids into biodiesel were investigated using Lewis acid deep eutectic solvents (DESs) as a catalyst. The acid sites involved in the reaction were characterized using acetonitrile as a probe to understand the mechanism. DES ChCl–SnCl2 (choline chloride–tin II chloride) showed higher catalytic activity in transesterification due to its higher acidity compared to DES ChCl–ZnCl2 (choline chloride–zinc chloride). This was illustrated by geometric optimization of the DES structures through density functional theory (DFT) which showed that the metal centers furthest from the choline moiety are the most acidic and the bond lengths of Sn–Cl were between 2.56 and 2.77 Å, and were greater than the Zn–Cl bond lengths from 2.30 to 2.48 Å, making the ChCl–SnCl2 DES more acidic and more suitable for the biodiesel production. The fatty acid methyl ester (FAME) conversion from microalgae lipid was 36.75 mg g−1 under ideal conditions (6 molar ratio methanol–lipid with 8 vol% DES dosage in methanol at 140 °C for 420 min). The activation energy is found to be 36.3 kJ mol−1 based on the pseudo-first-order reaction, in addition, the DES catalyst (ChCl–SnCl2) drove the reaction chemically and did not show mass transfer limitation. Information from this study can help to advance the development of an efficient and environmentally friendly industrial biodiesel production technology.
1. Introduction
The world's rapid population growth, along with rising industrialization and living standards, is the primary contributor to energy scarcity and global warming. Scientists are looking at the most viable alternative energy sources because of the ongoing depletion of fossil fuel reserves and rising environmental degradation and have obtained net zero emissions energy systems.1,2 Renewable energy is cleaner and more efficient than traditional fossil fuels. Biomass energy is one of the most effective ways to replace traditional fossil fuels because it is widely available, renewable, and environmentally safe. Currently, there are a variety of uses for biomass in many industrial applications such as energy.3,4Biomass-derived biodiesel has become increasingly popular because of the advantages it offers. Not only is biodiesel renewable, but it is also biodegradable, environmentally benign, and non-toxic; hence, it is a good substitute for diesel fuel.5 The important characteristics of biodiesel are the same as those of diesel fuel produced from fossil fuel refineries and it also possesses high flash points, high cetane numbers, low viscosities, and high lubricity certifications.6 In addition, biodiesel can satisfy global energy demand while achieving economic and environmental sustainability. Earlier studies have suggested that lignocellulose and microalgae could be better source for biodiesel production. Many microalgae strains reported having 15–300 times higher lipid content than the various common oil crops, thus proposing it as an alternative future source of biodiesel.7
FAME or biodiesel are produced by transesterification reaction of triacylglycerides (a noteworthy constituent of oils and fats) and esterification of free fatty acids using short-chain alcohol in the existence of a catalyst. The choice of catalyst has a significant impact on the production and selectivity of biodiesel as well as the transesterification process.8 The process of transesterification, in which triacylglycerides are combined with alcohol in the presence of a homogeneous or heterogeneous catalyst and then subjected to heat, is the most commonly used method of producing biodiesel.9 Currently, acids or their derivatives, such as toluene sulfonic acid and sulfuric acid (H2SO4)10 are the traditionally applied catalysts for the transesterification of biodiesel, however, sulfuric acid suffers from serious drawbacks, such as equipment corrosion and pollution.11 As a result, efforts should be devoted to develop green and efficient catalysts to solve the aforementioned challenges, such as equipment corrosion and environmental contamination, in the biodiesel production process.12
DESs are similar to ionic liquids (ILs) and well-integrated in the fields related to bioprocessing, extraction of compounds. DESs differ from ILs due to their impressive properties, such as easy process and relatively cheap synthesis design, and less volatile, biodegradable, and nontoxic solvent. Quaternary ammonium salts are cationic and typically used as hydrogen bond acceptors (HBA) in the synthesis of DES, whereas metal halides or organic compounds with hydrogen functional groups are used as hydrogen bond donor (HBD). DESs have been exploited in multiple aspects in the application fields of biodiesel production as co-solvent of biodiesel production.13 Abbott effectively removed glycerol from biodiesel product blends by using DES salt–glycerol (1![[thin space (1/6-em)]](https://www.rsc.org/images/entities/char_2009.gif) :
:![[thin space (1/6-em)]](https://www.rsc.org/images/entities/char_2009.gif) 1).14
1).14
The hydrogen functional bonding groups provide a mixture of Lewis or Brønsted acidic character, where various cation and/or anion molecules are present depending on their usage (HBD or HBA).11 The application of DES with an acid character in the production of biodiesel has been reported by Tao et al., where they used ChCl–ZnCl2 for the production of biodiesel from the soybean oil but the yield has proved to be unsatisfactory,15 it appears that the production of biodiesel is strongly influenced by the strength of the acid character of DES. According to our knowledge, studies on transesterification for biodiesel production from microalgae using DESs directly as catalysts and reaction media have not been reported before.
In this study, the catalytic activity of DESs synthesized was investigated in transesterification of microalgae lipid into biodiesel production. The DESs acid sites involved in the transesterification reaction were also investigated. (DFT) methods were used to optimize the DES structures in order to demonstrate that the acid strength of DESs is correlated to its catalytic activity. Optimization of biodiesel production was performed through several experimental factors in order to optimize the levels of reaction conditions including DES dosage in methanol, temperature, time and molar ratio methanol to lipid. A kinetic study is also described in order to understand their reaction mechanism. This work provides a technological alternative of environmentally safe catalyst for the process integration of biodiesel from microalgae.
2. Materials and methods
2.1. Materials
Chlorella pyrenoidosa microalgae was obtained from the Yunnan Baoshan Zeyuan Microalgae Health Technology Co. Ltd., China, and kept at 4 °C for experimental usage. A total of 20.31% of the maximum lipid content was recorded in this strain based on the conventional modified Floch's method.16 Analytical grade chemicals used in experiments such as methanol, n-hexane, SnCl2, ZnCl2, methyl pentadecanoate (>98%), H2SO4 (∼98%), and acetonitrile were purchased from Aladdin Industrial Corporation, Shanghai, China.2.2. Preparation of the deep eutectic solvent catalyst
DESs ChCl–ZnCl2 and ChCl–SnCl2 were synthesized following the procedure reported by Cao et al.17 at a ratio of 1![[thin space (1/6-em)]](https://www.rsc.org/images/entities/char_2009.gif) :
:![[thin space (1/6-em)]](https://www.rsc.org/images/entities/char_2009.gif) 2. In that purpose, 0.1 mol of dried ChCl was mixed with 0.2 mol of SnCl2, ZnCl2 into the flask (250 mL) and heated in a water bath at 100 °C. Then, synthesized DESs were wrapped and kept in a desiccator to prevent it from absorbing moisture from the environment. The ratio of individual component during synthesis of ChCl–ZnCl2 and ChCl–SnCl2 DESs were selected based on a report by Liang et al.,18 in which both DESs were applied as catalysts.
2. In that purpose, 0.1 mol of dried ChCl was mixed with 0.2 mol of SnCl2, ZnCl2 into the flask (250 mL) and heated in a water bath at 100 °C. Then, synthesized DESs were wrapped and kept in a desiccator to prevent it from absorbing moisture from the environment. The ratio of individual component during synthesis of ChCl–ZnCl2 and ChCl–SnCl2 DESs were selected based on a report by Liang et al.,18 in which both DESs were applied as catalysts.
2.3. Characterization and confirmation of DESs
The DES formation was confirmed by performing Fourier-transform infrared (FT-IR) and proton nuclear magnetic resonance (1H NMR). The instruments were an FTIR (BRUKERTENSOR II-USA) and an NMR (BRUKER AVANCE III 400 MHz) spectrometer. A thermogravimetric analysis (TGA) analyzer (NETZSCH, Germany) was used to analyse the thermal behaviour of DES. The targeted Lewis acid DES was characterized by FTIR measurement in a frequency ranging from 4000 to 500 cm−1, and the acetonitrile has been used as a probe. In brief, the DES was mixed with acetonitrile under a ratio of 1![[thin space (1/6-em)]](https://www.rsc.org/images/entities/char_2009.gif) :
:![[thin space (1/6-em)]](https://www.rsc.org/images/entities/char_2009.gif) 5 based on the procedure previously reported by ref. 19.
5 based on the procedure previously reported by ref. 19.
In order to gain more insights into the role of DESs in the production of biodiesel, quantum chemical methods were applied. (DFT) was used in that purpose as implemented in the Gaussian 09 suite of programs.20 The B3LYP21 hybrid functional21,22 was combined to the Los Alamos double zeta (LanL2DZ) basis set23 to perform the geometry optimizations without any constraint of symmetry. Frequency calculations performed on the relaxed structures of the DESs reveal no imaginary frequency, showing that all obtained structures are real minima of the potential energy surface. Mulliken's atomic charges were further determined in other to analyse the sites of LADESs prone to nucleophilic attacks.
2.4. Biodiesel production
The lipid was extracted using the optimum conditions reported in the previous study.24 200 mg of pre-treated microalgae and 6 mL methanol–n-butanol (1![[thin space (1/6-em)]](https://www.rsc.org/images/entities/char_2009.gif) :
:![[thin space (1/6-em)]](https://www.rsc.org/images/entities/char_2009.gif) 4, v/v) were mixed in a 25 mL glass tube and magnetically stirred at temperature 60 °C controlled device (IKA C-MAG HS 7). After the reaction, the mixture was cooled at room temperature, 1.5 n-hexane and 3 mL distilled water were added to isolate lipids from the fraction via phase separation. A centrifuge (Beckman Coulter) was used at 10 min at 3500 g to separate the mixture from the liquid and solid phases. After the uppermost layer containing the lipids was put into a decanter that had been previously weighed for solvent evaporation using a rotary evaporator (RE2000A, Shanghai, China).
4, v/v) were mixed in a 25 mL glass tube and magnetically stirred at temperature 60 °C controlled device (IKA C-MAG HS 7). After the reaction, the mixture was cooled at room temperature, 1.5 n-hexane and 3 mL distilled water were added to isolate lipids from the fraction via phase separation. A centrifuge (Beckman Coulter) was used at 10 min at 3500 g to separate the mixture from the liquid and solid phases. After the uppermost layer containing the lipids was put into a decanter that had been previously weighed for solvent evaporation using a rotary evaporator (RE2000A, Shanghai, China).
The procedures described by Lu et al.25 were used to methylate the isolated lipid to obtain the FAME. In brief, 0.019 g of lipids extracted under optimized conditions were placed into each glass tube and transesterified based on the experiment design parameters including DES dosage in methanol (1 to 9% v/v, temperature (from 100 to 160 °C), time (60 to 540 min), and molar ratio of methanol to lipid (3 to 12 v/w). Then, the mixture was allowed to cool at room temperature for 20 min. Subsequently, the 5 mL of n-hexane was added in the mixture and centrifuged for 5 min at 3500g to create a binary phase for separating FAME. Afterward, the uppermost layer of hexane containing FAME was transferred to a different gas chromatography (GC) sample ampoule for further analysis. The results of the qualitative analysis of FAMEs were obtained using a GC (Agilent, USA 8890) following the setting of previous studies.24,26
Then, the total weight of FAME was estimated based on the procedure reported in the literature27 using the following equation:
| WFA = AS/AIS × CIS/WS | (1) |
The amount of lipid exterifiable into FAME was calculated using a conventional modified Folch's method and compared with the traditional H2SO4 catalyst-based data.24
2.5. Kinetics of transesterification reaction
Herein, the effects of temperature and time on the reaction were examined to better understand the reaction's kinetics. A transesterification reaction at different temperatures ranging from 100 to 140 °C was performed to find the activation energy. The activation energy and rate constant of a pseudo-first-order reaction were calculated using eqn (2) and (3).| −ln(1 − XFAME) = kt | (2) |
ln![[thin space (1/6-em)]](https://www.rsc.org/images/entities/char_2009.gif) k = ln k = ln![[thin space (1/6-em)]](https://www.rsc.org/images/entities/char_2009.gif) A − Ea/RT A − Ea/RT
| (3) |
![[thin space (1/6-em)]](https://www.rsc.org/images/entities/char_2009.gif) k is plotted against 1/T.
k is plotted against 1/T.
3. Results and discussions
3.1. Confirmation of deep eutectic solvent formation and characterization
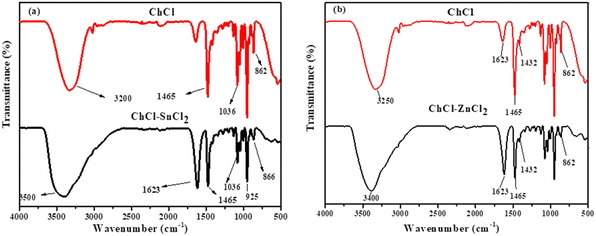
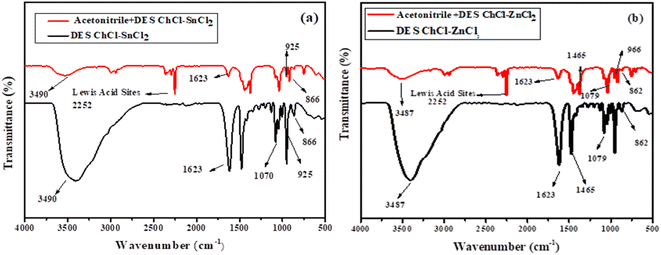
Meanwhile, the FTIR ChCl–ZnCl2 was represented in Fig. 1b, the ChCl characteristics are almost identical to those of the previous DES ChCl–SnCl2 synthesized. However, 1070 and 966 cm−1 bands could be interpreted as symbolizing the antisymmetric C–O and C–C–O stretching vibrations associated with the NC2H4OH group of the choline cation. The ChCl–ZnCl2 showed the peak at 1094 and 986 cm−1 being materialized. The characteristic peaks for CN anti-symmetric stretching vibration were easily detected in the relatively lower bands (1029–1146 cm−1). The –OH portion might be attributed to the bands between 3250 and 3487 cm−1. The confirmation of this DES is consistent with the report made by Fanglong et al.29
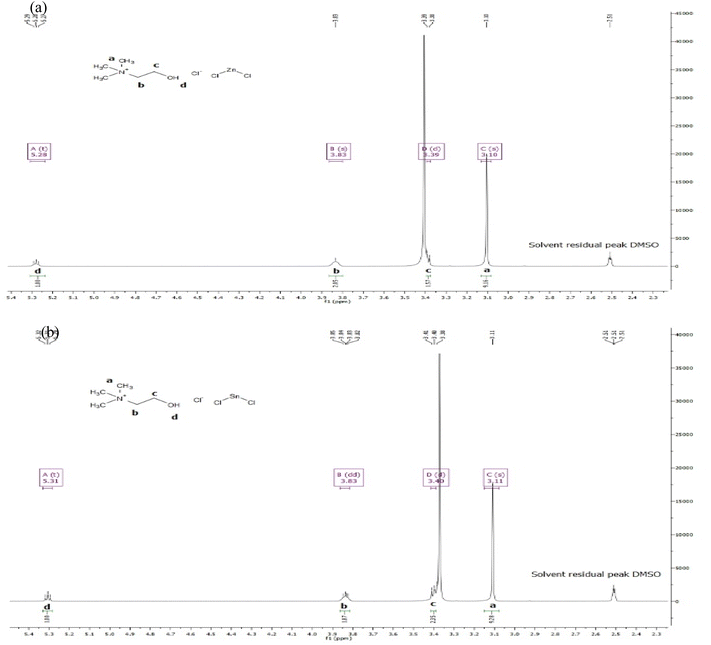
1H NMR (400 MHz, DMSO) δ 5.28 (t, J = 4.6 Hz, 1H), 3.83 (s, 2H), 3.39 (d, J = 5.1 Hz, 2H), 3.10 (s, 9H) were recorded from the experimental spectrum data of ChCl–ZnCl2 and presented in Fig. 2a. The 1H NMR data permits the identification of several atoms or molecules present in the of ChCl–ZnCl2 DES showed various essential structural traits (as shown in Fig. 2a) including the signals of the hydroxyl hydrogen in choline (δ = 5.28 (t, 1H, and Hd)). Strong signals at 3.10 (s, 9H, and Ha) correspond to the protons of methyl groups connected to nitrogen in choline. ChCl contains two methylene groups, one of which is connected to nitrogen and the other to hydroxyl. The signal of 3.83 ppm (s, 2H, and Hb) is assimilated to the protons of the methylene group coupled to nitrogen while as the signal of 3.39 ppm (d, 2H, Hc) corresponds the protons of the methylene group attached to hydroxyl.
1H NMR (400 MHz, DMSO) δ 5.31 (t, J = 4.9 Hz, and 1H), 3.83 (dd, J = 6.1, 3.8 Hz, and 2H), 3.40 (d, J = 5.2 Hz, and 2H), 3.11 (s, 9H) were obtained from the experimental spectrum data of ChCl–SnCl2 and presented in Fig. 2b. We can distinguish the various atoms in the ChCl–SnCl2 mixture using the 1H NMR spectrum. This mixture displayed numerous significant structural features, such as the signals of the hydroxyl hydrogen of the choline ((δ = 5.31 (t, 1H, and Hd)). The strong signals at 3.11 (s, 9H, Ha) represent the protons of the methyl groups linked to the nitrogen of the choline. Moreover, ChCl has two methylene groups, one of which is covalently bonded to nitrogen and the other is covalently bonded to hydroxyl. The signal at 3.83 ppm (dd, 2H, and Hb) represents the protons of the methylene group bound to the nitrogen, whereas the signal at 3.20 ppm (d, 2H, Hc) correlates to the protons of the methylene group that are linked to the hydroxyl.
![[thin space (1/6-em)]](https://www.rsc.org/images/entities/char_2009.gif) :
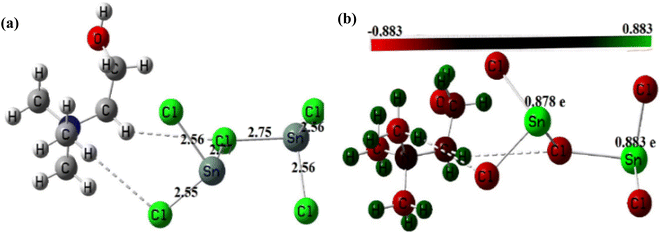
:![[thin space (1/6-em)]](https://www.rsc.org/images/entities/char_2009.gif) 2) ranges 2.30–2.48 Å, whereas the Sn–Cl bond length ranges 2.56–2.77 Å. The high value of the Sn–Cl bond length is because Sn has a greater atomic radius than Zn. These values support the dative nature of the previously mentioned bonds. Fig. 5 and 6 also show graphical representations of the atoms' Mulliken atomic charges. Herein, the atoms with positive charges (electron poor sites) and negative charges (electron-rich sites) are represented by green and red colors, respectively, whereas neutral sites (with a charge close to zero) are represented by black, as shown in Fig. 5 and 6. Hence, it is evident from these figures that the metallic centers have positive charges, which are the highest values of Mulliken charges in all complexes, thereby indicating they are Lewis's acid sites. The charges of Zn and Sn atoms are 0.567–0.668, and 0.878–0.883e. In each of these structures, the metal centers farther from the choline moiety are the most acidic.
2) ranges 2.30–2.48 Å, whereas the Sn–Cl bond length ranges 2.56–2.77 Å. The high value of the Sn–Cl bond length is because Sn has a greater atomic radius than Zn. These values support the dative nature of the previously mentioned bonds. Fig. 5 and 6 also show graphical representations of the atoms' Mulliken atomic charges. Herein, the atoms with positive charges (electron poor sites) and negative charges (electron-rich sites) are represented by green and red colors, respectively, whereas neutral sites (with a charge close to zero) are represented by black, as shown in Fig. 5 and 6. Hence, it is evident from these figures that the metallic centers have positive charges, which are the highest values of Mulliken charges in all complexes, thereby indicating they are Lewis's acid sites. The charges of Zn and Sn atoms are 0.567–0.668, and 0.878–0.883e. In each of these structures, the metal centers farther from the choline moiety are the most acidic.
 | ||
Fig. 5 (a) Optimized structure of ChCl–ZnCl2 (1![[thin space (1/6-em)]](https://www.rsc.org/images/entities/char_2009.gif) : :![[thin space (1/6-em)]](https://www.rsc.org/images/entities/char_2009.gif) 2) and (b) Mulliken's atomic charges of its atoms obtained at DFT/B3LYP/Lan12DZ level of theory. 2) and (b) Mulliken's atomic charges of its atoms obtained at DFT/B3LYP/Lan12DZ level of theory. | ||
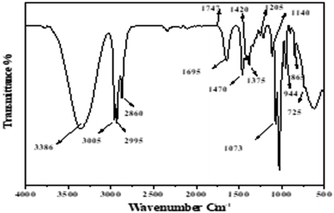
![[double bond, length as m-dash]](https://www.rsc.org/images/entities/char_e001.gif) C–H stretch in the fatty acids of TAGs. Meanwhile, stretching CH3 of acyl chains in fatty acids of TAGs is represented by 2955 cm−1 and 1375 cm−1; stretching CH2 of acyl chains in fatty acids of TAGs is represented by 2925 cm−1, 2850 cm−1, and 745 cm−1; and the peak, 1666–1746 cm−1, represents amide I band (C
C–H stretch in the fatty acids of TAGs. Meanwhile, stretching CH3 of acyl chains in fatty acids of TAGs is represented by 2955 cm−1 and 1375 cm−1; stretching CH2 of acyl chains in fatty acids of TAGs is represented by 2925 cm−1, 2850 cm−1, and 745 cm−1; and the peak, 1666–1746 cm−1, represents amide I band (C![[double bond, length as m-dash]](https://www.rsc.org/images/entities/char_e001.gif) O stretching), N–H bending (amide II). However, the peaks of 1746 cm−1 representing C
O stretching), N–H bending (amide II). However, the peaks of 1746 cm−1 representing C![[double bond, length as m-dash]](https://www.rsc.org/images/entities/char_e001.gif) O stretching in ethyl esters are relatively very low. This may specify that the share of free fatty acids (FFA) is low as compared to the share of triacylglycerols (TAG) in the extracted lipids by previous methods.31,32
O stretching in ethyl esters are relatively very low. This may specify that the share of free fatty acids (FFA) is low as compared to the share of triacylglycerols (TAG) in the extracted lipids by previous methods.31,32
3.2. Screening of the catalyst
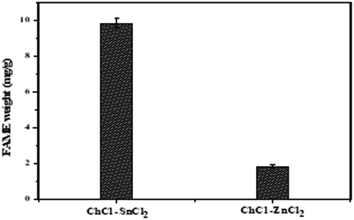
In this study, the catalytic activity of different DES synthesized for biodiesel production was investigated using two-step biodiesel production approach. In brief, DES ChCl–SnCl2 and ChCl–ZnCl2 were tested based on the same conditions of the following parameters: molar ratio methanol to lipid 6, the temperature at 100 °C, time 180 min, and DES dosage in methanol 5 vol%. Fig. 8 shows that the FAME weight of DES ChCl–SnCl2 is 7.80 mg g−1, which is higher than the FAME weight of DES ChCl–ZnCl2, which is 1.80 mg g−1. All DES have the same HBA ChCl, indicating that it was the HBD differences of the Lewis acids (SnCl2, ZnCl2) that enhanced the catalytic performance in the reaction. It has been reported in previous studies that acid strength greatly influences the yield of biodiesel production.15 It is possible that the high catalytic performance of DES ChCl–SnCl2 is due to its higher acidity than DES ChCl–ZnCl2. This is demonstrated by geometric optimization of DES structures (Fig. 5 and 6), which revealed that metal centers farthest from the choline moiety are the most acidic, and the DES ChCl–SnCl2 shows metal centers farther from the choline moiety, the bond lengths of Sn–Cl were between 2.56 and 2.77 Å which was greater than the Zn bond lengths –Cl from 2.30 to 2.48 Å, making DES ChCl–SnCl2 more acid and more suitable for biodiesel production (Tables 1 and 2).| Band (cm−1) | Peak identification | Molecules |
|---|---|---|
| 3005 | C–C unsaturated fatty acids | Lipid |
| 2931 | CH2 asymmetric stretching | Lipid |
| 2869 | CH2 symmetric stretching saturated fatty acid | Lipid |
| 1666–1736 | Amide I band (C![[double bond, length as m-dash]](https://www.rsc.org/images/entities/char_e001.gif) O stretching), N–H bending (amide II) O stretching), N–H bending (amide II) |
Lipid, protein |
| Ester C–O stretching | ||
| 1470 | CH2 deformation | Lipid |
| 1375 | N–H bending (amide II) | Lipid |
| 1140 | C–O–C stretching | |
| 1073 | P–O stretching (symmetric) of ![[double bond splayed left]](https://www.rsc.org/images/entities/char_e009.gif) PO2 PO2 |
Polyphosphate, phospholipid |
| 900–1200 | C–O and C–C stretching, C–O–H and C–O–C deformation | Polyphosphate, phospholipid |
| 865 | P–O–P stretching | Polyphosphate, phospholipid |
| 745 | CH2 deformations | Lipid |
| Fatty acids | Designation compound | FAME weight (mg g−1) | Total weight (mg g−1) |
|---|---|---|---|
| Saturated fatty acid (SFA) | |||
| Hexadecanoic acid | C16:0 | 8.87 ± 0 | 8.87 |
![[thin space (1/6-em)]](https://www.rsc.org/images/entities/char_2009.gif) |
|||
| Monounsaturated fatty acids (MUFA) | |||
| Methyl palmitoleate | C16:1 | 0.85 ± 0.45 | 1.16 |
| Methyl oleates | C18:1 | 0.31 ± 0.32 | |
![[thin space (1/6-em)]](https://www.rsc.org/images/entities/char_2009.gif) |
|||
| Polyunsaturated fatty acids (PUFA) | |||
| Hexadecadienoic acid | C16:2 | 4.21 ± 0.30 | 26.56 |
| 7,10,13-Hexadecatrienoic acid | C16:3 | 4.76 ± 0.17 | |
| 9,12-Octadecadienoic acid | C18:2 | 11.36 ± 0.78 | |
| 9,12,15-Octadecadienoic acid | C18:3 | 6.23 ± 0.74 | |
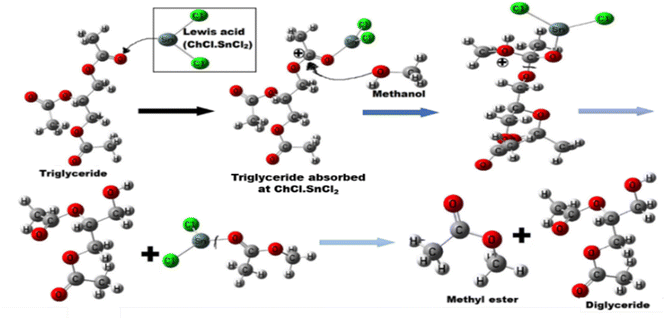
A carbocation is created when the carbonyl oxygen of carboxylic acid from triglyceride interacts with the acid sites of DES. Alcohol's nucleophilic attack on the carbocation forms a tetrahedral intermediate and eliminates HOH to create a diglyceride and methyl ester (Fig. 9). In order to confirm the catalytic ability of the DES used herein, the first step of the above-mentioned mechanism was simulated at DFT/B3LYP/Lanl2DZ level of theory, by replacing the initial triglyceride by acetic acid to reduce the size of the molecular system to compute. The adsorption reaction (of acetic acid on the DES) was simulated herein through a Lewis type acid–base reaction between the carbonyl O-atom (base) of acetic acid and the metal center of each catalyst farther from the choline moiety, previously identified as the most acid sites. This led to dative M–O (M = Sn and Zn) bonds between these atoms. The negative values of the calculated Gibbs free energy of adsorption (ΔG) interestingly show that the reaction is spontaneous in standard conditions with all catalysts. The reaction with ChCl–SnCl2 is the most the spontaneous (ΔG = −18.59 kcal mol−1), surely due the high acidy of the Sn ion as compared to Zn ions (ΔG = −10.88 kcal mol−1). This high acidy leads to stronger interactions between the acetic acid and the Sn ions. The Zn–O and Sn–O bond distances after adsorption are respectively 2.04 and 2.19 Å. Upon adsorption, the activation increases the charge of the carboxylic C-atom, making it more electropositive, and thus facilitate the nucleophilic attack by methanol. The Mulliken atomic charge of that C-atom is found to increase from 0.278 to 0.375 as well as 0.470e in presence of the, Zn and Sn metal ions respectively. Accordingly, the tin-based catalyst better activate this C-atom than the zinc based one and thereby corroborates the best acidity previously mentioned for the former. Therefore, we selected the DES ChCl–SnCl2 for the next step of the experiment.
3.3. Optimization of the FAME extraction and analysis of the FAME profile
 | (4) |
 | (5) |
 | (6) |
However, the transesterification of glycerides can be completed extensively given that the rate of forward reaction is significantly greater than the rate which reverse reaction occurred. As a consequence of this, the process of the aforementioned reaction can be simplified down to the one-step irreversible reaction that is outlined in eqn (7).
It is predicated on several hypotheses, including (a) that kinetics controls the rate of transesterification, (b) that intermediate products can be ignored; (c) that the reaction system is an ideal one; and (d) that reverse reaction is neglected.43,49
 | (7) |
The formula for reaction rate can be written as follows using eqn (7):
 | (8) |
| [TG] = [TG]0(1 − XFAME) | (9) |
Consequently, the forward reaction can be thought of as a pseudo-first-order reaction, and the equations above are then changed to eqn (10) and (11).
 | (10) |
 | (11) |
| −ln(1 − XFAME) = kt | (12) |
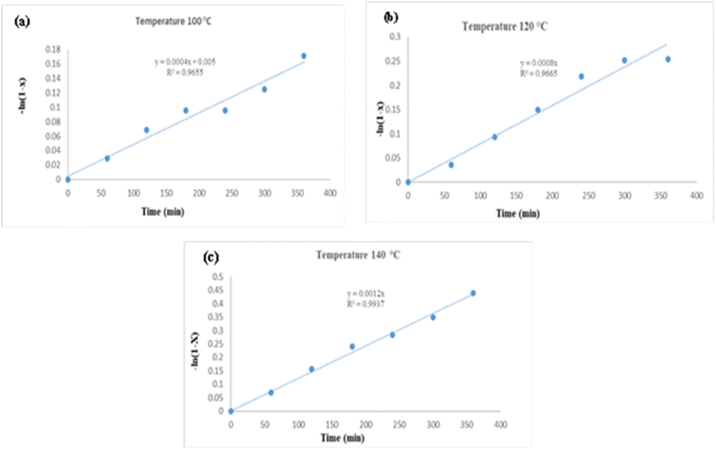 | ||
Fig. 11 Plots of −ln(1 − X) versus time for transesterification of microalgae lipid by DES ChCl–SnCl2 (1![[thin space (1/6-em)]](https://www.rsc.org/images/entities/char_2009.gif) : :![[thin space (1/6-em)]](https://www.rsc.org/images/entities/char_2009.gif) 2) at divers reaction temperatures (a) 100 °C, (b) 120 °C, and (c) 140 °C. 2) at divers reaction temperatures (a) 100 °C, (b) 120 °C, and (c) 140 °C. | ||
A linear relationship was found by plotting ln(1 − XFAME) versus t, thus confirming the theory that the conducted reaction is pseudo-first order. The slope of the regression equation connected to Fig. 11(a–c) was identified as the constant reaction rate at each temperature.
As evidenced, as predicted by the Arrhenius equation, the reaction rate constant rose as the temperature increased.
 | (13) |
 | (14) |
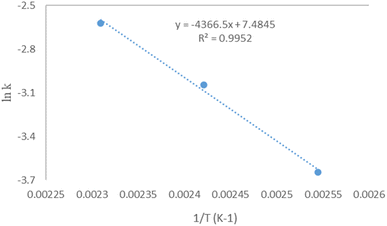
![[thin space (1/6-em)]](https://www.rsc.org/images/entities/char_2009.gif) k was plotted against 1/T as in Fig. 12. It is well-known from the literature that an energy activation in the range of 10–15 kJ mol−1 reveals a reaction rate controlled by mass transfer;52 when the activation energy is greater than 25 kJ mol−1, the reaction is chemically conducted. In this study, DES was used, and the activation energy was found to be 36.3 kJ mol−1. It is clear that mass transfer is not a reaction's limiting factor, demonstrating that reactions are chemically driven rather than being limited by mass transfer.53 The plot of the ln
k was plotted against 1/T as in Fig. 12. It is well-known from the literature that an energy activation in the range of 10–15 kJ mol−1 reveals a reaction rate controlled by mass transfer;52 when the activation energy is greater than 25 kJ mol−1, the reaction is chemically conducted. In this study, DES was used, and the activation energy was found to be 36.3 kJ mol−1. It is clear that mass transfer is not a reaction's limiting factor, demonstrating that reactions are chemically driven rather than being limited by mass transfer.53 The plot of the ln![[thin space (1/6-em)]](https://www.rsc.org/images/entities/char_2009.gif) k dependence of 1/T shows the acquired data, which supports that it is a first-order reaction.53
k dependence of 1/T shows the acquired data, which supports that it is a first-order reaction.53
4. Conclusion
Research on biodiesel transesterification using DESs directly as catalysts and reaction medium are not commonly reported. That is the raison why the catalytic activity of the DESs is reported herein for the first time in this study for the transesterification of microalgae lipid into biodiesel to replace the toxic and corrosive catalyst H2SO4. DES ChCl–SnCl2 showed higher catalytic activity in transesterification due to its stronger acidity compared to the DES ChCl–ZnCl2. This was illustrated by geometric optimization of DES structures which showed that the metal centers though furthest from the choline moiety are the most acidic. The FAME conversion of microalgae lipid was 36.75 mg g−1 under ideal conditions (molar ratio of methanol to lipid of 6 with 8 vol% DES dosage in methanol at 140 °C for 420 min). Furthermore, the pseudo-first-order reaction mechanism was followed by a kinetic analysis of the reaction wherein the activation energy was 36.3 kJ mol−1, it was evident that mass transfer is not the limiting factor of a reaction, proving that reactions are chemically induced not mass transfer limitation using DES as a catalyst in the transesterification of microalgae lipid to biodiesel. In addition, this study can provide data to contribute to the advancement of an innovative, efficient and environmentally friendly industrial biodiesel production technology. However, more studies are needed to scale up the process before going to commercial application.Author contributions
ADPN was responsible for performing the experiment, collecting the data, preparing the graphs, and writing the first draft; JX and MAA were responsible for conceptualization the experiment, validation of data, review and editing, supervision, and the obtaining of funding; AZ, WX, SZ, MS were participated in review and editing. The final draft was read by all of the authors, and they all gave their approval.Conflicts of interest
All the authors declare that “there are no conflicts to declare”.Acknowledgements
The research cost of this fund was received from NSFC (No. 22261132515 and No. 22078308), Innovation Leadership Program in Sciences and Technologies for Central Plains Talent Plan (No. 214200510009), Program for Science & Technology Innovative Research Team in the University of Henan Province (No. 22IRTSTHN007), Innovation Leadership Program in Sciences and Technologies for Zhengzhou Talent Gathering Plan, and Outstanding Contribution Talent Project in Sciences and Technologies for Zhengzhou Talent Gathering Plan (No. 20180400042) and fund from Zhengzhou University.References
- H. Qin, X. Hu, J. Wang, H. Cheng, L. Chen and Z. Qi, Green Energy Environ., 2020, 5, 8–21 CrossRef.
- S. J. Davis, N. S. Lewis, M. Shaner, S. Aggarwal, D. Arent, I. L. Azevedo, S. M. Benson, T. Bradley, J. Brouwer and Y.-M. Chiang, Science, 2018, 360, eaas9793 CrossRef PubMed.
- C. Zhou, Z. Ge, Y. Wang, F. Shang and L. Guo, Carbon Neutrality, 2023, 2, 1–13 Search PubMed.
- V. Fung, Y. Xiao, Z. J. D. Tan, X. Ma, J. F. J. Zhou, S. Panda, N. Yan and K. Zhou, Biomaterials, 2022, 287, 121661 CrossRef CAS PubMed.
- H. C. Ong, Y. W. Tiong, B. H. H. Goh, Y. Y. Gan, M. Mofijur, I. R. Fattah, C. T. Chong, M. A. Alam, H. V. Lee and A. S. Silitonga, Energy Convers. Manag., 2021, 228, 113647 CrossRef CAS.
- A. E.-F. Abomohra, X. Zheng, Q. Wang, J. Huang and R. Ebaid, Bioresour. Technol., 2021, 323, 124640 CrossRef CAS PubMed.
- R. Singh, A. Kumar and Y. C. Sharma, Energy Fuels, 2019, 33, 1175–1184 CrossRef CAS.
- C. Cuautli, I. Romero-Ibarra, J. Vazquez-Arenas and M. Galvan, Fuel, 2021, 298, 120840 CrossRef CAS.
- C. Safi, A. V. Ursu, C. Laroche, B. Zebib, O. Merah, P.-Y. Pontalier and C. Vaca-Garcia, Algal Res., 2014, 3, 61–65 CrossRef.
- X. Tan, P. Sudarsanam, J. Tan, A. Wang, H. Zhang, H. Li and S. Yang, J. Environ. Chem. Eng., 2021, 9, 104719 CrossRef CAS.
- Y. Liu, H. Yan, J. Liu, W. Dong, Z. Cao, X. Hu and Z. Zhou, Renewable Energy, 2020, 162, 1842–1853 CrossRef CAS.
- D. Cai, Y. Xie, L. Li, J. Ren, X. Lin and T. Qiu, Energy Convers. Manag., 2018, 166, 318–327 CrossRef CAS.
- F. Merza, A. Fawzy, I. AlNashef, S. Al-Zuhair and H. Taher, Energy Rep., 2018, 4, 77–83 CrossRef.
- A. P. Abbott, P. M. Cullis, M. J. Gibson, R. C. Harris and E. Raven, Green Chem., 2007, 9, 868–872 RSC.
- L. Tao, D. Yuefeng, G. Shucai and C. Ji, Chin. J. Chem. Eng., 2010, 18, 322–327 Search PubMed.
- W. Chen, Y. Liu, L. Song, M. Sommerfeld and Q. Hu, Algal Res., 2020, 52, 102080 CrossRef.
- J. Cao, B. Qi, J. Liu, Y. Shang, H. Liu, W. Wang, J. Lv, Z. Chen, H. Zhang and X. Zhou, RSC Adv., 2016, 6, 21612–21616 RSC.
- D. Liang, J. Wu, L. Lu, R. Fang, J. Xu and M. A. Alam, Bioresour. Technol., 2022, 364, 128100 CrossRef CAS PubMed.
- F. Jiang, Q. Zhu, D. Ma, X. Liu and X. Han, J. Mol. Catal. A: Chem., 2011, 334, 8–12 CrossRef CAS.
- M. J. Frisch, G. W. Trucks, H. B. Schlegel, G. E. Scuseria, M. A. Robb, J. R. Cheeseman, G. Scalmani, V. Barone, B. Mennucci, G. A. Petersson, H. Nakatsuji, M. Caricato, X. Li, H. P. Hratchian, A. F. Izmaylov, J. Bloino, G. Zheng, J. L. Sonnenberg, M. Hada, M. Ehara, K. Toyota, R. Fukuda, J. Hasegawa, M. Ishida, T. Nakajima, Y. Honda, O. Kitao, H. Nakai,T. Vreven, J. A. Montgomery Jr., J. E. Peralta, F. Ogliaro, M. Bearpark, J. J. Heyd, E. Brothers, K. N. Kudin, V. N. Staroverov, R. Kobayashi, J. Normand, K. Raghavachari, A. Rendell, J. C. Burant, S. S. Iyengar, J. Tomasi, M. Cossi, N. Rega, J. M. Millam, M. Klene, J. E. Knox, J. B. Cross, V. Bakken, C. Adamo, J. Jaramillo, R. Gomperts, R. E. Stratmann, O. Yazyev, A. J. Austin, R. Cammi, C. Pomelli, J. W. Ochterski, R. L. Martin, K. Morokuma, V. G. Zakrzewski, G. A. Voth, P. Salvador, J. J. Dannenberg, S. Dapprich, A. D. Daniels, Ö Farkas, J. B. Foresman, J. V. Ortiz, J. Cioslowski, D. J. Fox, Gaussian, Inc., Wallingford CT, 2009.
- A. D. Becke, J. Chem. Phys., 1992, 96, 2155–2160 CrossRef CAS.
- C. Lee, W. Yang and R. G. Parr, Phys. Rev. B: Condens. Matter Mater. Phys., 1988, 37, 785 CrossRef CAS PubMed.
- P. J. Hay and W. R. Wadt, J. Chem. Phys., 1985, 82, 299–310 CrossRef CAS.
- A. D. P. Ngatcha, G. Muhammad, Y. Lv, W. Xiong, A. Zhao, J. Xu and M. A. Alam, Biomass Convers. Biorefin., 2022, 12, 133–143 CrossRef CAS.
- W. Lu, M. A. Alam, Y. Pan, W. J. Nock, Z. Wang and Z. Yuan, Korean J. Chem. Eng., 2016, 33, 2575–2581 CrossRef CAS.
- S. A. Trujillo, D. Peña-Solórzano, O. R. Bejarano and C. Ochoa-Puentes, RSC Adv., 2020, 10, 40552–40561 RSC.
- S. Abdulkadir and M. Tsuchiya, J. Exp. Mar. Biol. Ecol., 2008, 354, 1–8 CrossRef CAS.
- S. Sadaf, J. Iqbal, I. Ullah, H. N. Bhatti, S. Nouren, J. Nisar and M. Iqbal, Sustain. Cities Soc., 2018, 41, 220–226 CrossRef.
- Q. Fanglong, S. Jinhe, X. Shaolei, S. Chenglong and J. Yongzhong, Int. Proc. Chem., Biol. Environ. Eng., 2015, 90, 70–75 Search PubMed.
- Y.-l. Yang and Y. Kou, Chem. Commun., 2004, 226–227 RSC.
- M. Moggio, S. Errico, N. Diano and M. Lepore, Eng. Proc., 2021, 10, 9 Search PubMed.
- V. Shapaval, J. Brandenburg, J. Blomqvist, V. Tafintseva, V. Passoth, M. Sandgren and A. Kohler, Biotechnol. Biofuels, 2019, 12, 1–12 CrossRef CAS PubMed.
- A. C. M. Loy, A. T. Quitain, M. K. Lam, S. Yusup, M. Sasaki and T. Kida, Energy Convers. Manage., 2019, 180, 1013–1025 CrossRef CAS.
- M. R. Nizah, Y. Taufiq-Yap, U. Rashid, S. H. Teo, Z. S. Nur and A. Islam, Energy Convers. Manage., 2014, 88, 1257–1262 CrossRef.
- G. Muhammad, A. D. P. Ngatcha, Y. Lv, W. Xiong, Y. A. El-Badry, E. Asmatulu, J. Xu and M. A. Alam, Renewable Energy, 2022, 184, 753–764 CrossRef CAS.
- N. Duongbia, S. Chaiwongsar, C. Chaichana and S. Chaiklangmuang, Biomass Convers. Biorefin., 2019, 9, 305–319 CrossRef CAS.
- A. Rezayan and M. Taghizadeh, Process Saf. Environ. Prot., 2018, 117, 711–721 CrossRef CAS.
- X. Han, W. Yan, C.-T. Hung, Y. He, P.-H. Wu, L.-L. Liu, S.-J. Huang and S.-B. Liu, Korean J. Chem. Eng., 2016, 33, 2063–2072 CrossRef CAS.
- H. Pan, H. Li, X.-F. Liu, H. Zhang, K.-L. Yang, S. Huang and S. Yang, Fuel Process. Technol., 2016, 150, 50–57 CrossRef CAS.
- S. Ghosh, S. Banerjee and D. Das, Algal Res., 2017, 27, 12–20 CrossRef.
- J. Cheng, Y. Qiu, R. Huang, W. Yang, J. Zhou and K. Cen, Bioresour. Technol., 2016, 221, 344–349 CrossRef CAS PubMed.
- M. Yadav, V. Singh and Y. C. Sharma, Energy Convers. Manage., 2017, 148, 1438–1452 CrossRef CAS.
- H. Zhang, H. Li, H. Pan, X. Liu, K. Yang, S. Huang and S. Yang, Energy Convers. Manag., 2017, 138, 45–53 CrossRef CAS.
- M. Khalekuzzaman, S. B. Kabir, M. Islam, P. Datta, M. Alam and J. Xu, Biomass Convers. Biorefin., 2021, 11, 767–779 CrossRef CAS.
- G. Knothe, Energy Fuels, 2008, 22, 1358–1364 CrossRef CAS.
- K. Bajwa, N. R. Bishnoi, A. Kirrolia, S. Gupta and S. T. Selvan, Appl. Water Sci., 2019, 9, 1–16 CrossRef CAS.
- A. Kirrolia, N. R. Bishnoi and R. Singh, Ann. Microbiol., 2014, 64, 1133–1147 CrossRef CAS.
- J. K. Suastes-Rivas, R. Hernández-Altamirano, V. Y. Mena-Cervantes, E. J. B. Gómez and I. Chairez, Fuel, 2020, 280, 118633 CrossRef CAS.
- V. K. Booramurthy, R. Kasimani, D. Subramanian and S. Pandian, Fuel, 2020, 260, 116373 CrossRef CAS.
- N. Kaur and A. Ali, RSC Adv., 2014, 4, 43671–43681 RSC.
- I. Lukić, Ž. Kesić, S. Maksimović, M. Zdujić, H. Liu, J. Krstić and D. Skala, Fuel, 2013, 113, 367–378 CrossRef.
- N. Kaur and A. Ali, Renewable Energy, 2015, 81, 421–431 CrossRef CAS.
- N. Kaur and A. Ali, Appl. Catal., A, 2015, 489, 193–202 CrossRef CAS.
Footnote |
| † Electronic supplementary information (ESI) available. See DOI: https://doi.org/10.1039/d3ra00543g |
| This journal is © The Royal Society of Chemistry 2023 |

