DOI:
10.1039/D3RA00495C
(Paper)
RSC Adv., 2023,
13, 6466-6480
Magnetic sodium alginate grafted with waste carbonaceous material for diclofenac sodium removal: optimization of operational parameters and process mechanism†
Received
23rd January 2023
, Accepted 17th February 2023
First published on 27th February 2023
Abstract
As their manufacturing and consumption have increased, pharmaceutical chemicals have increasingly been found in wastewater. It is necessary to look into more effective methods, including adsorption, because current therapies can't completely eliminate these micro contaminants. This investigation aims to assess the diclofenac sodium (DS) adsorption onto an Fe3O4@TAC@SA polymer in a static system. Through Box–Behnken design (BBD), system optimization was carried out, and the ideal conditions – adsorbent mass of 0.01 g and agitation speed of 200 rpm – were chosen. The adsorbent was created utilizing X-ray diffraction (XRD), X-ray photoelectron spectroscopy (XPS), scanning electron microscopy (SEM) and Fourier transform infrared spectroscopy (FT-IR), allowing us to gain a comprehensive understanding of its properties. The analysis of the adsorption process revealed that the external mass transference was the primary rate-controlling step, and the Pseudo-Second-Order model demonstrated the best correlation to kinetic experimental results. An endothermic, spontaneous adsorption process took place. The removal capacity was 858 mg g−1, which is a respectable result when compared to other adsorbents that have been utilized in the past to remove DS. Ion exchange, π–π interactions, electrostatic pore filling and hydrogen bonding all play a role in the adsorption of DS on the Fe3O4@TAC@SA polymer. After careful examination of the adsorbent towards a true sample, it was determined to be highly efficient after three regenerative cycles.
1. Introduction
The popular non-steroidal anti-inflammatory medicine (NSAID) diclofenac sodium (DS) is often prescribed to reduce fevers and assuage pain. Recent research has highlighted a troubling fact: DS has been identified in water supplies, even when wastewater treatment processes have been used. This serves as a stark reminder that we must do more when it comes to removing contaminants from our water sources.1 It is important to note that even minuscule amounts of DS in our waterways can have a detrimental impact on aquatic ecosystems. This damaging substance can cause thyroid cancer, liver damage, renal impairment, and other irregularities with blood flow. We need to take action now to reduce the amount of this hazardous chemical entering our waters.2 Medications, both derived from nature and synthetically produced, almost always contain excipients. These compounds make up the active ingredients that are essential to pharmaceutical products, and can transform them into powerful healing solutions. As minerals also have great potential as carriers, binders, diluents, lubricants or even in therapeutic uses, medicines take on a whole new level of effectiveness! Excitingly, they offer us the chance to bring relief to countless people.3 It's time to pay close attention to pharmaceuticals and personal care products (PPCPs), seeing as they're becoming increasingly omnipresent in aquatic habitats. With this in mind, let's take a closer look at what we can do to address their destructive influence.4 Discover the power of diclofenac sodium. Widely found in surface waters and domestic wastewaters, this medication is often a go-to solution for many.5 A non-steroidal anti-inflammatory drug, widely used, carries potential hazards to people and the planet. To mitigate these risks, researchers have focused on using adsorption and advanced oxidation processes (AOPs) to remove diverse PPCPs from wastewater.6 In their quest to do away with DS, researchers have proposed several chemical and biological approaches, such as membrane filtration, ozone oxidation, and biodegradation. All of these hold immense potential for creating a cleaner world.7 Because of their energy-intensive nature, costly upkeep, and waste production of noxious leftovers, these technologies are not yet widely adopted.8,9 It is imperative to create a process that is both efficient and cost-effective.10 Adsorption methods are proving to be incredibly effective at eliminating pollution from water sources, and their affordability and ease of use make them a highly sought-after solution for grappling with the growing problem of contamination. With such advantages, it's no wonder why these methods have superseded other technologies in combating this serious issue.11 For those in the know, recently developed polymer compounds such as chitosan, cellulose, polyaniline, and polypyrrole are revolutionizing the way we approach pollutant removal. By utilizing these compounds to craft functional nanocomposite hydrogels, cutting-edge advancements in this area of research are literally changing our world for the better.12
Discover why Sodium Alginate (SA) is an extraordinary natural polymer with a wealth of advantages. From being widely available and biodegradable to its affordable cost and simple shaping potential, the fascinating molecule offers a number of carboxyl and hydroxyl groups along its backbone – making it a widely studied material for improving the adsorption of pharmaceutical waste. Experience the benefits this remarkable resource has to offer.13 Given their distinct pore structures and remarkable surface areas, activated carbon (AC) and SA have captivated much attention in the field of wastewater treatment, demonstrating their efficacy as efficient adsorbers of pharmaceuticals.13 Adsorption of SA/AC microspheres from aqueous solutions is an integral part of subsequent applications, given the immense reactive surface area and powerful adsorption capacity these spheres possess. Fe3O4 has become a desirable option for magnetic materials that can be used to deliver quick and effective adsorption capabilities. To tackle the increasing environmental issues present in our world today, a unique, effortless, and eco-friendly synthetic polymerization process is needed.14 It is important to use a non-invasive adsorption process to rid wastewater of both organic and inorganic pollutants.15,16 However, the main obstacle that halts widespread usage of commercially available activated carbon (CAC) is its high price tag, due to its primary components like coal and petroleum products being non-renewable materials. Let's learn how to make the process more engaging.13 A groundbreaking new study has revealed the remarkable power of activated carbon (AC) to eliminate pharmaceutical substances from water and wastewater. To put it simply, carbon-rich solid waste can be substituted for scarce natural resources – a discovery that has sweeping implications.17,18 Adsorbents have long been manufactured using a selection of AC precursors, including wastewater sludge, rice husks, coconuts shells, bagasse, and almond shells.19 In order to enhance the appearance and chemistry of the produced AC, we have implemented a range of physical and chemical processes for activation.20,21
This work explored the potential of Fe3O4@AC@SA polymer to reduce pharmaceutically active substances from aqueous solution. It was created by combining sodium alginate, magnetite, and activated carbon derived from tea waste, making it simple to extract from water. With an impressive surface area of 228 m2 g−1, this adsorbent was found to be endothermic, spontaneous, and kinetically well-suited to the equations of Langmuir isotherm and Pseudo-Second-Order. We further enhanced the outcomes through Box–Behnken-design, enabled up to three regenerations without compromising on its efficiency.
2. Material and methods
2.1. Materials and instruments
Materials and instruments were illustrated with details at ESI.†
2.2. Synthesis of adsorbent
2.2.1. Synthesis of tea activated carbon (TAC). Waste from tea shops has been used to gather the used tea. To remove the colored soluble chemicals, distilled water was used in the first stage to completely wash the tea debris. After being cleaned, the tea waste was dried in a hot air oven at 100 °C. The biomass was then put into the muffle furnace in a silica crucible and heated to 450 °C for 45 min while being treated in a N2 environment to create biochar. The biochar was removed once the procedure was finished and allowed to cool for five hour. Tea waste was handled by a powerful oxidation process using a modified version of Hummer's approach. Ten grams of tea waste were weighed and placed in an Erlenmeyer flask. The flask was then gently filled with 100 mL of concentrated H2SO4, which was continuously stirred. For the purpose of causing the oxidation reaction, potassium permanganate is added to the solution after 20 min of continuous stirring. After 30 min, 100 mL of distilled water is added to the flask, and the resulting combination is then incubated in the incubator for 4 h at 45 °C. After that, 70 mL more H2O2 was injected to stop the reaction. The result was slurry with a brown tint. The resulting slurry was filtered using Whatman filter paper and repeatedly rinsed with distilled water to bring the pH level back to normal. The filtered product is dried overnight in a hot air oven at 60 °C before being carefully crushed into powder.22
2.2.2. Synthesis of Fe3O4@TAC@SA polymer. 1.0 g of sodium alginate was added to 50 mL of distilled water, and the mixture was rapidly agitated for 12 h. A 250 mL neck flask with 0.1 g of Fe3O4 was filled with 50 mL of sodium alginate. Then, the solution was sonicated and agitated for 1 h while three different quantities of TAC, each weighing about 0.2 g, were added. They were then agitated for a further hour without the use of sonication (Fig. 1a). Using a syringe, the combined solution was gradually injected dropwise into a 2 percent CaCl2 solution (1 mL). The cross-linking polymerization of magnetic sodium alginate (MSA) molecules and AC ions produced the dark, spherical gel beads. The polymer gel beads were removed from the solution, cleaned, and dried, and then the desired product Fe3O4@AC@SA polymer bio-sorbent was formed after 180 min of solidification.8
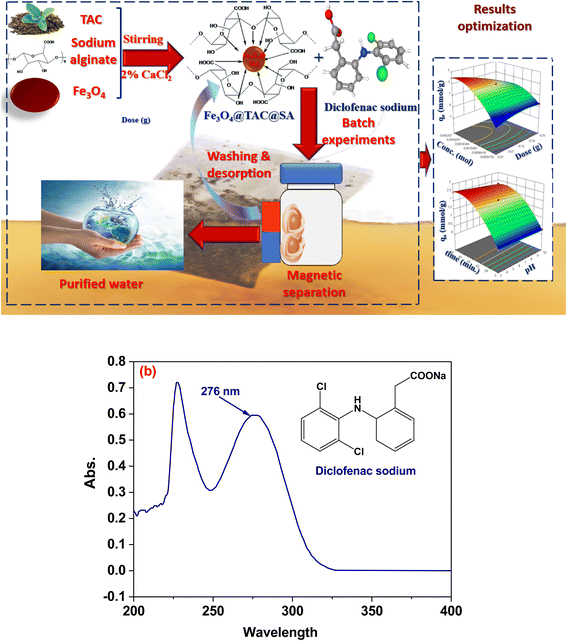 |
| | Fig. 1 Schematic diagram of synthesis Fe3O4@TAC@SA polymer and adsorption of DS, (b) spectra of diclofenac sodium. | |
2.3. Removal and batch studies of Fe3O4@TAC@SA polymer
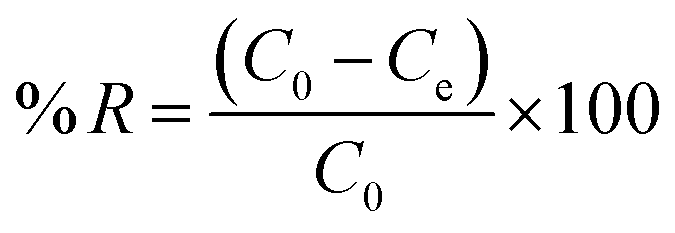
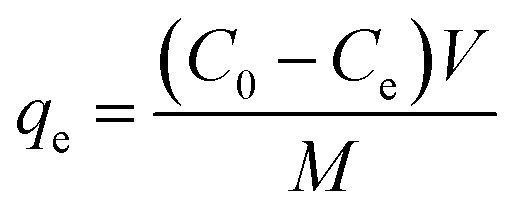
In order to conduct adsorption tests, a known quantity of the organ clay was agitated in 25 mL of diclofenac sodium (DS) solution in a temperature-controlled shaker (Lab Companion, SI-600R) (Fig. 1a). The samples were taken at scheduled intervals, centrifuged for 10 min, and then filtered using 0.45 μm hydrophilic membrane filters.23 We utilized a UV-Visible spectrophotometer to measure the concentration of the DS solution both before and after adsorption (UV-Vis mini 1240, Shimadzu, Brazil) at the wavelength of 276 nm (Fig. 1b). The amount of adsorbed DS, qt (mmol g−1), and removal efficiency was obtained at a given time (t), as eqn (1) and (2) shows:| |
 | (1) |
| |
 | (2) |
2.4. Experimental design
A suitable alternative approach, CCD-based RSM, has been implemented to evaluate the impact of various elements and their interactions as well as to optimize processes. In this investigation, three trials were conducted, and the variables that had the greatest impact on removal effectiveness were the absorbent dosage, initial DS concentration, adsorption period, and pH. Table 1 displayed the operating circumstances' respective ranges and three levels (1, 0, +1). Table 1 also included the experimental design matrix and corresponding response (removal capacity).24
Table 1 Independent variable range and level for CCD runs
| Trial |
Parameter |
Code |
Real values |
| +1 |
0 |
−1 |
| 1 |
pH |
X1 |
3 |
6.5 |
10 |
| Concentration |
X2 |
0.0002755 |
0.00124 |
0.002207 |
| Dose |
X3 |
0.01 |
0.13 |
0.25 |
| 2 |
Temperature |
X1 |
20 |
35 |
50 |
| Time |
X2 |
5 |
52.5 |
100 |
| pH |
X3 |
3 |
6.5 |
10 |
| 3 |
pH |
X1 |
3 |
6.5 |
10 |
| Time |
X2 |
5 |
52.5 |
100 |
| Concentration |
X3 |
0.0002755 |
0.00124 |
0.002207 |
3. Results and discussions
3.1. Characterization of Fe3O4@TAC@SA
3.1.1. Patterns of X-ray diffraction (XRD). The findings of the XRD analysis of the crystallite phases of zeolite, Fe3O4@TAC@SA, TAC, SA, and Fe3O4 are depicted in Fig. 2. The pure Fe3O4 particles were cubic spinel structures with strong diffraction peaks at 30.12°, 35.46°, 43.13°, 53.54°, 57.12°, and 62.58°, which corresponded to the varied crystal planes of (220), (311), (400), (422), (511), and (440) [JCPDS File no. 75-0033]. Fe3O4 was present in the composite, as seen by the main peaks of Fe3O4 particles on the XRD pattern of Fe3O4@TAC@SA.25,26
 |
| | Fig. 2 XRD pattern of SA, TAC, Fe3O4, and Fe3O4@TAC@SA. | |
3.1.2. Brunauer–Emmett–Teller surface area (BET). Fig. 3 shows the Fe3O4@TAC@SA that has been nitrogen adsorption–desorption isotherm at 77 K. The sample has a type IV isotherm, which is distinguished by a saturation level. With the use of mesoporous adsorbents, capillary condensation was used to obtain this adsorption isotherm. Despite the rise in equilibrium pressure, there is no adsorption, according to the saturation level: this is explained by the fact that the mesopores, where capillary condensation occurred, are no longer open to adsorption. The specific surface area for Fe3O4@TAC@SA composite is 228 m2 g−1, pore volume 0.42 cm3 g−1 while the surface area and pore volume after adsorption were 172 m2 g−1, and pore volume 0.27 cm3 g−1. Between relative pressure points 0.38 and 0.97, a pure type H1 hysteresis loop form can be observed. When it comes to adsorbents with a very restricted pore distribution, this kind of hysteresis loop is frequently seen.27,28
 |
| | Fig. 3 N2 adsorption/desorption of Fe3O4@TAC@SA and DS@Fe3O4@TAC@SA. | |
The two samples have type IV isotherms, which are depicted in Fig. 3 as having a saturation level. Mesoporous adsorbents, where capillary condensation takes place, are used to create this kind of isotherm. The samples clearly have a mesoporous microstructure, as seen by the isotherms. The presence of a modest decrease in the pore volumes and the specific surfaces of the composite before and after adsorption, as determined by surface area and pore volume measurements, suggests that the adsorption occurs in the composite's pores.
3.1.3. SEM analysis. SEM is a frequently used method of characterizing materials to view their microscopic features. SEM was used to investigate the variations in Fe3O4@TAC@SA polymer's microscopic morphology. The results are depicted in Fig. 4a. The Fe3O4@TAC@SA polymer's shape can be best described as a cuboid or a collection of cuboid structures with a smooth rectangular surface, according to the SEM pictures. The size of Fe3O4@TAC@SA polymer was about 64.14 nm. The SEM findings suggested that Fe3O4, TAC, and SA were successfully connected, but more characterization is required to support this assertion.29 Fig. 4b represented SEM image after adsorption of DS.
 |
| | Fig. 4 SEM image of Fe3O4@TAC@SA polymer (a) before adsorption, and (b) after adsorption. | |
3.1.4. XPS. The XPS wide scan spectra of Fe3O4@TAC@SA polymer in Fig. S1† clearly showed the presence of characteristic peaks such as C1s, O1s, N1s, Na1s, P2p, S2p and Fe2p, confirming that these elements are the main components of Fe3O4@TAC@SA polymer. Fig. S1a† that C1s spectrum ofcan be decomposed into three peaks with binding energy at 284.8, 286.6, and 288.8 eV, respectively, which should be attributed to the C atom in C–C, C–O, and COO−, respectively.Spectrum of Fe2p Fig. S1b,† given that the Fe3O4@TAC@SA polymer has two symmetrical broadened peaks with binding energies (BEs) of 711.82 and 725.56 eV, respectively, that are attributed to the Fe-2p1/2 and Fe-2p3/2, respectively, it has been demonstrated that Fe2+ and Fe3+ ions exist within the Fe3O4. Further deconvolution indicates mixed Fe2+/Fe3+, which is consistent with Fe3O4 being present in the catalytic hybrid (Fe3O4@TAC@SA). In actuality, the FeO and Fe2O3 mixed state.30,31 These values fit the literature's values extremely well. Additionally, Fe2p1/2 and Fe2p3/2 have two minor satellite peaks at 721.35 eV and 718.8 eV, respectively, in Fig. S1b,† further demonstrate the presence of a very minor amount of γ-Fe2O3 in the Fe3O4@TAC@SA polymer composite. For our Fe3O4@TAC@SA polymer, the XPS pattern of Fe2p effectively confirms the presence of the iron element as Fe3O4, this is in keeping with the Fe3O4@TAC@SA polymer XRD results. While for N1s spectrum one peak appears at 399.79 eV which indicate the presence of –NH– Fig. S1c.† The three peaks of O1s spectrum for Fe3O4@TAC@SA polymer (Fig. S1e†) at 531.37 and 532.67 eV assigned to the O atom in iron–oxide (Fe–O) and COO−. The P2p spectrum has obvious characteristic peaks at 133.47 eV corresponding to P–O–P Fig. S1f.† Through the deconvolution of the S 2p core-level spectrum of Fe3O4@TAC@SA polymer, three peaks were observed at 129.23, 162.16, and 164.47 that corresponding to S–C–, –C–S–C–, and S–O Fig. S1g.† While the survey represented at Fig. S1h† this chart contains all peaks of element represented at this adsorbent.32
3.1.5. FT-IR. Fig. S2† displays the FTIR spectra of SA, TAC, and the Fe3O4@TAC@SA polymer. The FTIR spectra of SA revealed significant bands of absorption for the hydroxyl, ether, and carboxylic functional groups. Stretching vibrations of alginate's O–H bonds were detected between 3000–3600 cm−1. Aliphatic C–H stretching vibrations were noticed at 2920–2850 cm−1 bands were noticed at 1634 and 1458 cm−1 and symmetric stretching vibrations of the carboxylate salt ion, respectively, were attributed. The characterization of the structure of alginate from its constituents and derivatives can be done using the later bands, which are highly significant. The bands at 1107 and 935 cm−1 were attributed to the pyranosyl ring's vibrational C–O stretching and the C–O stretching with contributions from C–C–H and C–O–H deformation. Fe3O4@TAC@SA composite's FTIR spectra revealed the following main bands: 3600 cm−1 (stretching vibrations of –NH and –OH bonds), 2870 cm−1 (stretching vibrations of C–H in –CH and –CH2), 1650 cm−1 (bending vibration of N–H), 1380 cm−1 (stretching vibration of C–N), and 1090 cm−1 (skeletal vibration of C–O). The peak at 553 cm−1 corresponds to Fe–O bond.33,34
3.1.6. Magnetic properties. VSM was used to test the magnetic characteristics of Fe3O4@TAC@SA polymer and naked Fe3O4 nanoparticles. The saturation magnetization values for Fe3O4 and Fe3O4@TAC@SA are presented in Fig. S3† as being 71.6 and 16.8 emu g−1, respectively. It appears that the magnetic saturation was decreased when Fe3O4@TAC@SA and nanoparticles were used together; the Fe3O4@TAC@SA nanoparticles, however, still have enough magnetism to separate quickly in wastewater treatment.25,35
3.2. CCD analysis
The Fe3O4@TAC@SA polymer's DS removal method was optimized using a CCD (central composite design) analysis. Preliminary investigations determined that the study will use four main independent parameters, including adsorbent dose, beginning DS concentration, and pH. Table 2 displays the experimental strategy and anticipated outcomes for DS elimination.36 The following regression equation from a quadratic model revealed a link between response (percent removal) and operating parameters:
| qe = 2.07 − 0.0968 × A + 1.05 × B − 0.0332 × C − 0.0544 × AB + 0.0169 × AC − 0.0136 × BC − 0.0065 × A2 − 0.7141 × B2 + 0.0289 × C2 |
where A, B, and C stand for the coded values of Fe3O4@TAC@SA dose, starting DS concentration, adsorption time, and pH, respectively, and qe (mmol g−1) is the projected DS removal capacity, of which the linear terms are. A2, B2, and C2 in this equation denote quadratic terms, while AB, BC, BA, and CB represent interaction terms. In the equation above, the negative and positive signs represent the parameters' antagonistic and synergistic effects.37
Table 2 ANOVA for DS removal experiments using Fe3O4@TAC@SA
| Source |
Sum of squares |
df |
Mean square |
F-value |
p-value |
|
| Model |
10.45 |
9 |
1.16 |
885.32 |
<0.0001 |
Significant |
| A – pH |
0.0670 |
1 |
0.0670 |
51.09 |
0.0002 |
|
| B – conc |
8.73 |
1 |
8.73 |
6655.49 |
<0.0001 |
|
| C – dose |
0.0236 |
1 |
0.0236 |
17.99 |
0.0038 |
|
| AB |
0.0140 |
1 |
0.0140 |
10.64 |
0.0138 |
|
| AC |
0.0010 |
1 |
0.0010 |
0.7686 |
0.4097 |
|
| BC |
0.0030 |
1 |
0.0030 |
2.28 |
0.1752 |
|
| A2 |
0.0003 |
1 |
0.0003 |
0.2403 |
0.6390 |
|
| B2 |
1.60 |
1 |
1.60 |
1221.04 |
<0.0001 |
|
| C2 |
0.0001 |
1 |
0.0001 |
0.0443 |
0.8393 |
|
| Residual |
0.0092 |
7 |
0.0013 |
|
|
|
| Lack of fit |
0.0092 |
3 |
0.0031 |
86![[thin space (1/6-em)]](https://www.rsc.org/images/entities/char_2009.gif) 765.29 765.29 |
<0.0001 |
Significant |
| Pure error |
1.411 × 10⁻⁷ |
4 |
3.528 × 10⁻⁸ |
|
|
|
| Cor total |
10.46 |
16 |
|
|
|
|
The effectiveness of the proposed model was examined using analysis of variance (ANOVA), and the findings are shown in Table 1. Model terms are considered significant when the p value is less than 0.05. In this instance, important model terms were A, B, C, AB, and B2, and the strong F value of 885.32 suggests that the model is important. An F-value this large could only happen owing to noise in 0.01 percent of cases. Table 2 shows that the linear term for all parameters, the quadratic term for the parameters A, B, C, AB, and B2, and additionally, the quadratic model appears to be applicable and significant based on the high model F value (885.32) and low model p value (0.0001). Low error values, strong correlation coefficient values, and a significant Lack-of-Fit all attest to the design's validity. Indicating that the quadratic model may be used for the prediction of DS removal effectiveness, the pred. R2 (correlation coefficient) of 0.9860 is extremely near to the adj. R2 of 0.9980.38
The excellent concordance between experimental and anticipated responses is seen in Fig. 5a. Remaining's are the discrepancy between experimental and anticipated responses. Fig. 5b demonstrates the residual diagrams for DS removal effectiveness utilizing Fe3O4@TAC@SA in various modes (normal plot, residuals against anticipated values, and residuals against run numbers). The typical probability diagram indicates that (Fig. 5c), indicating the mistakes' typical nature, the data points form a straight line. The residuals vs. run number and residuals versus anticipated efficiency graphs are also included (Fig. 5c) exemplify the random distribution of data points devoid of any trends and the viability of the quadratic model.39,40
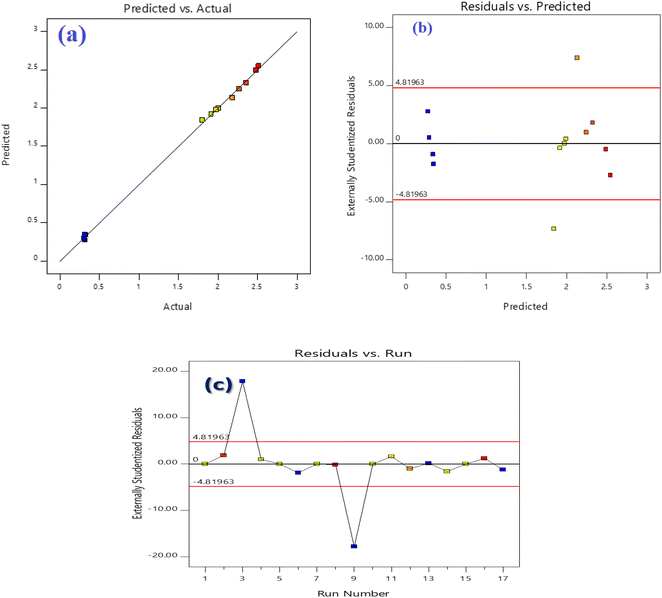 |
| | Fig. 5 Correlation of actual and predicted values (a), normal probability plots of the residuals (b), and residuals versus run number (c) of the fitted model for crystal violet (DS) adsorption. | |
3.3. Response surface plotting
To investigate the impact of each parameter on the response, the predicted responses were created as 2D contour and 3D surface plots, which are displayed in Fig. 6. Two important plotting factors were changed in each plot while the other parameters remained the same. The forecast of the DS elimination percentage for different values of the applied parameters may be found with the aid of the contour and surface plots. The elimination% of DS is shown in Fig. 6 as a function of the initial DS concentration in contour and surface diagrams and pH (a), adsorbent dosage, and concentration (b), pH and contact time (c), and (d) temperature and time. Based on Fig. 6a, higher initial DS concentration resulted in lower adsorption efficiency. Vacant surface sites on the adsorbent are decreased with an increase in the DS concentration, which results in a decrease in adsorption effectiveness when the temperature and adsorbent dosage remain unchanged. Additionally, Fig. 6a shows that the adsorption effectiveness increased as the pH of the solution decreased. The power of electrostatic attraction between positively charged nanocomposite and DS is extraordinary. In acidic pH conditions, the surface of Fe3O4@TAC@SA becomes positively charged with H+ ions, triggering an increased removal percentage. This positively charged active surface allows for more effective adsorption of DS from the solution. The solution pH also rises, further enhancing the effect of the transformation, ultimately resulting in an improved performance. We can see that this reaction of electrostatic attraction provides numerous benefits for the removal of DS, ultimately leading to a cleaner environment. According to Fig. 6b, the removal capability of DS continued to rise when DS concentration increased and nanocomposite dosage for adsorption decreased. The greatest adsorption capacity while the test is shown in Fig. 6c at a lower pH and longer test duration. Last but not least, Fig. 6d shows that the adsorption capacity of DS was high at high temperature and long contact times.40
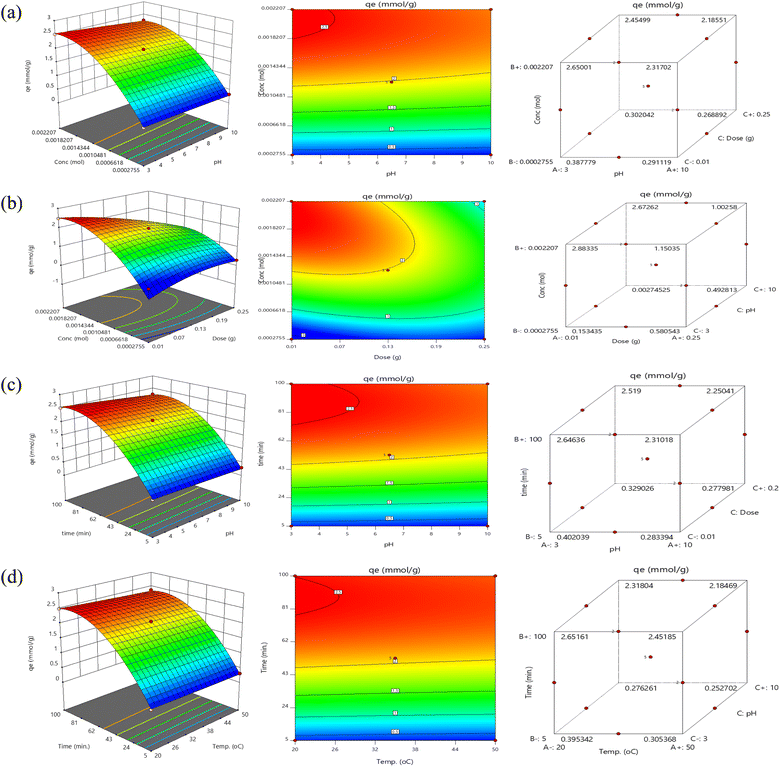 |
| | Fig. 6 Surface and contour plots for DS adsorption by Fe3O4@TAC@SA. | |
3.4. Optimization response
The four experimental parameters–adsorbent dosage, initial DS concentration, adsorption period, temperature, and pH were shown to be best under the following conditions by the RSM: 0.02 g/25 mL, 0.0002755 mol, 100 min, 50 °C and 3, respectively (Table 3). The elimination capacity under these ideal circumstances was calculated to be 2.48 mmol g−1. The experimental figure for DS elimination efficiency under these ideal circumstances was 2.66 mmol g−1. These findings attest to the strong correspondence between experimental and anticipated data.41
Table 3 Optimization of the DS removal by RSM-CCD
| Parameter |
Optimum |
Predict response value (mmol g−1) |
Experimental response value (mmol g−1) |
| A – dose |
0.02 g/25 mL |
2.48 |
2.66 |
| B – DS concentration |
0.0002755 mol |
| C – time |
100 min |
| D – temperature |
50 °C |
3.5. Batch experiments
3.5.1. Effect of pH. The answer a key factor affecting adsorption is pH. Due to electrostatic interactions between the negatively charged anionic form of DS and the positively charged surface charge of Fe3O4@TAC@SA, as depicted in Fig. S4.† In addition, as can be seen from Fig. S4,† the zero-point charge (pHzpc) of Fe3O4@TAC@SA is 5.8. When pH < pHzpc, the Fe3O4@TAC@SA surface is positively charged and can adsorb negatively charged DS. However, when pH > pHzpc, the Fe3O4@TAC@SA surface has a negative charge, which cannot attract DS. Because the repulsion will be take place as in this case the adsorbent and adsorbate both of them have negatively charge so the repulsion will take place instead of attraction. So, it is favourable the adsorption take place at pH lower than pHzpc. DS cannot completely dissolve at pH 2 or 3, pH 5 was selected as the ideal pH in this case; second, because the carboxyl groups on DS are easily dissociated and become negative, and thus can react with the positive species Fe3O4@TAC@SA polymer at high pH (>4.2).30,42
3.5.2. Effect of dose. A series of adsorbent dosages (0.02–0.25 g/25 mL) were used to investigate the impact of Fe3O4@TAC@SA polymer concentration. After adsorption was finished, the adsorption capabilities for various adsorbent doses were calculated. When the adsorbent dosage reached 0.225 g, as depicted in Fig. S5,† the adsorption capacity began to decline. As the dose increases, the equilibrium concentration of DS is decreased, which is due to the increase in the adsorbent surface area of the adsorbent. The surface of the adsorbent is composed of active sites with a spectrum of binding energies. However, because utilizing a high amount of adsorbent enhances the adsorption of low concentrations of DS, the extent of adsorptive removal increased with increasing adsorbent dosage. So, for the following experiment, 0.02 g of DS solution was employed.43
3.5.3. Effect of DS concentration. When the initial concentration is minimal (2.76 × 10⁻⁴ mol L−1), DS was nearly entirely taken out. As the DS concentration rose, the Fe3O4@TAC@SA polymer's adsorption capability increased, but remained nearly unchanged at values greater than 800 mg L−1. This might have occurred as a result of competition between the numerous DS molecules for the few surface adsorption sites on Fe3O4@TAC@SA. Consequently, the adsorptive capability at 2.76 × 10⁻³ mol L−1 (2.66 mg g−1) was determined to be Fe3O4@TAC@SA's saturation adsorption capability.44
3.5.4. Effect of contact time. It was investigated how changing the adsorption time between 5 and 100 min affected the adsorption capacity. As the adsorption duration was extended to 80 min, the qe of Fe3O4@TAC@SA rapidly rose. The reason the adsorption was practically at equilibrium after 60 minutes was that as adsorption duration increases, the Fe3O4@TAC@SA polymer's adsorption sites gradually fill up and the adsorption rate falls, leading to a gradual attainment of adsorption equilibrium. As a result, 60 min was determined to be the ideal adsorption period for Fe3O4@TAC@SA polymer.44
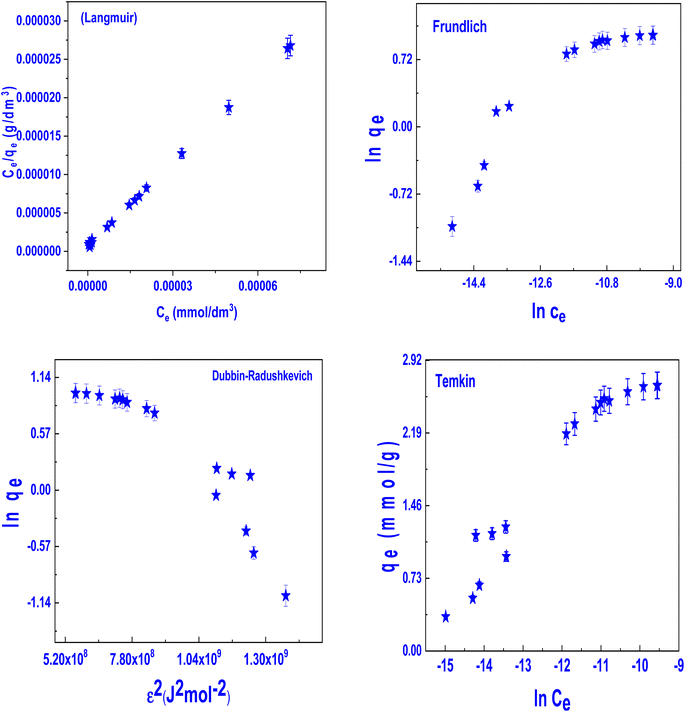
3.5.5. Adsorption isotherm. The resultant isotherms are shown in Fig. 7, which shows how the amounts of DS that were adsorbed onto the materials grew significantly at lower concentrations, and then steadily improved until they ultimately reached the platform. While this was going on, it was seen that the temperature enhanced the adsorption capacity of the Fe3O4@TAC@SA polymer, indicating that the DS was adsorbing onto the material in an endothermic manner. Langmuir,45 Freundlich,46 Dubinin–Radushkevich47 and Temkin48 isotherm models (eqn (S1)–(S4)) (ESI†) were prohibited in order to simulate data. Fig. 7 and Table 4 show linear fitting curves and associated isotherm parameters. The maximal theoretical adsorption capacities were 2.669 mmol g−1 for DS and the Langmuir isotherm model (R2 = 0.999) demonstrated higher goodness of fit than the other three models. The favorable adsorption process was confirmed by the fact that the RL values for DS adsorption on the adsorbents mentioned above were all between 0 and 1. The Freundlich model was disregarded because of the low correlation coefficients. Although the bt value was around 5460.82 L mol−1, the Temkin isotherm model (R2 = 0.928) suggested the chemical adsorption processes. Given that the adsorption energy was found to be 15.05 kJ mol−1, the Dubinin–Radushkevich model suggested that the process was chemisorption Table S1 (ESI†). Fe3O4@TAC@SA offered ample adsorption sites and had a higher adsorption capacity as a result of the numerous functional groups. It's significant to note that Fe3O4@TAC@SA polymer's removal efficiency may almost reach 100% at a low DS concentration.49
 |
| | Fig. 7 Adsorption isotherm models for adsorption of DS on Fe3O4@TAC@SA polymer (pH: 3, dose: 0.02 g/25 mL, and time 90 min). | |
Table 4 Adsorption isotherm parameter for DS on Fe3O4@TAC@SA polymer
| Models |
Parameter |
DS |
| Langmuir |
qm,exp (mmol g−1) |
2.74 |
| qm (mmol g−1) |
2.669 |
| KL (L mmol−1) |
535294.12 |
| RL |
0.05 |
| R2 |
0.999 |
| Freundlich |
n |
2.9095 |
| KF (mmol g−1) (L mmol−1)1/n |
95.488 |
| R2 |
0.841 |
| Dubinin–Radushkevich |
QDR |
2.456 |
| KDR (J2 mol−2) |
−2.21 × 10⁻⁹ |
| Ea (kJ mol−1) |
15.05 |
| R2 |
0.852 |
| Temkin |
bT (L mol−1) |
5460.82 |
| AT (kJ mol−1) |
16.09 |
| R2 |
0.928 |
3.5.6. Adsorption kinetics. Fig. S6† depicts how contact duration affects the adsorption of the Fe3O4@TAC@SA polymer. The adsorption capabilities of the adsorbents on DS grew rapidly in the first 30 min, and then steadily increased until they ultimately reached a stable platform. After 100 min, the adsorbents reached adsorption equilibrium. The parameters are included in Table S4† and include pseudo-first-order,50 pseudo-second-order,51 Webber and Morris,52 and Elovich53 models that were used to fit the adsorption kinetic data in Fig. S13.† Correlation coefficients (R2 > 0.999) of the DS adsorption-derived pseudo-second-order kinetic model were greater (eqn (S5)–(S8)) (ESI†). Additionally, the computed theoretical adsorption capabilities using the pseudo-second-order kinetic model came out to 2.73 mmol g−1, which was in close agreement with the actual data of 2.72 mmol g−1. As a result, the chemisorption process may be dominant in the DS adsorption on the materials mentioned above Table S2 (ESI†). Notably, the Elovich model (R2 = 0.909) was a further model that was appropriate to describe the adsorption of DS and further suggested that chemisorption was the dominating process.54
3.5.7. Adsorption thermodynamics. The Fe3O4@TAC@SA polymer's ability to adsorb diclofenac was studied in relation to temperature. This substance was chosen since the kinetic and equilibrium experiments revealed the best adsorption results from it. The adsorption capacity increased with rising temperature, as depicted in Fig. 8. Eqn (S9) (ESI†) was used to obtain the standard thermodynamic equilibrium constant (Keq), and the values of the standard Gibbs free energy (ΔG°, kJ mol−1, eqn S10) (ESI†), standard adsorption enthalpy (ΔH°, kJ mol−1), and standard adsorption entropy (ΔS°, kJ mol−1) were calculated from the slope and intercept of the graph plotted from the Van't Hoff equation (eqn (S11) and (S12)) (ESI†). With an R2 of 0.99, the graph successfully matched the experimental data (Fig. 8). Table 5 is a list of the calculated thermodynamic parameters.55 The increasing values of Keq in Table 5 demonstrate how temperature affects the adsorption affinity. Negative ΔG° values show that the adsorption of diclofenac happens through a favourable and spontaneous process, one that doesn't require the system to be given external energy. The increase in negative ΔG° with temperature suggests that adsorption was more advantageous at high temperatures. The positive value of ΔH° (Table 5) indicates that the process is endothermic Table S3 (ESI†).
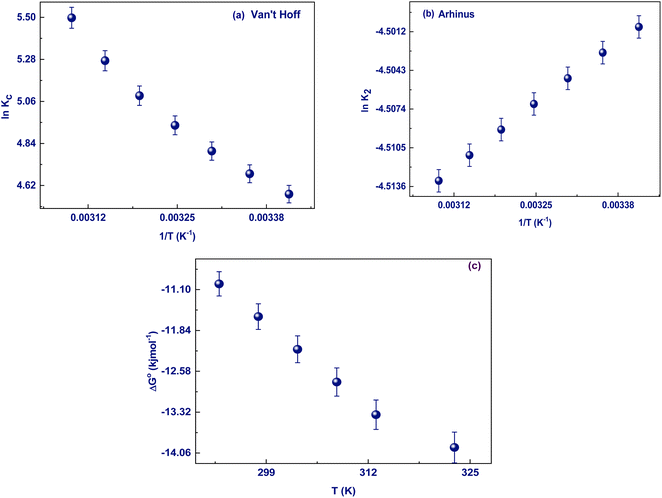 |
| | Fig. 8 Effect of temperature (a) Van't Hoff, (b) Arhinus, and (c) change of ΔG° with increase temperature. (pH: 3, dose: 0.02 g/25 mL, conc. 2.22 × 10⁻³ mol, and time 30 min). | |
Table 5 Thermodynamic parameter of adsorption of DS on Fe3O4@TAC@SA polymer
| Adsorbate |
T (K) |
ΔH° (kJ mol−1) |
ΔS° (J mol−1 K−1) |
Ea (kJ mol−1) |
T0 (K) |
−ΔG° (kJ mol−1) |
| DS |
298 |
23.74 |
118.55 |
32.3 |
200.3 |
10.99 |
| 303 |
12.18 |
| 308 |
12.77 |
| 313 |
13.36 |
| 318 |
13.95 |
3.5.8. Mechanism of interaction. The adsorption of molecules onto the surface of a porous adsorbent can be explained by a variety of mechanisms. Because the repulsion will be taking place as in this case the adsorbent and adsorbate both of them have negatively charge so the repulsion will take place instead of attraction. So, it is favorable the adsorption take place at pH lower than pHzpc. In addition, adsorption sites on the surface of the adsorbent can increase its capacity by leading to more interactions between the adsorbent and the adsorbate, such as acid–base interactions, π–complexation, and π–π stacking. The pH of the solution was a deciding factor in the adsorption of the DS on Fe3O4@TAC@SA. At pH less than 4.5, the –NH groups on the DS were positively charged, and the carboxyl group wasn't dissociated, making the entire DS positively charged. To further understand why this happened, we turn to hydrogen bonding. Hydrogen bonding is a possible mechanism for the adsorption, formed between the –OH of the Fe3O4@TAC@SA and the DS. With the constantly existing positively charged amino groups on Fe3O4@TAC@SA, these hydrogen bonds are created and then strengthened by the positively charged environment. As the pH rose further, the hydrogen ion levels began to drop, causing the sodium on the DS to dissociate and leave the DS with a high negative charge.27 From Fig. 9 represented XPS for Fe3O4@TAC@SA and after adsorption DS@Fe3O4@TAC@SA from the table that consists of the content of both we can observe that chloride appear in the XPS at about binding energy 200 eV this indicate that DS was loaded and adsorbed at the adsorbent.
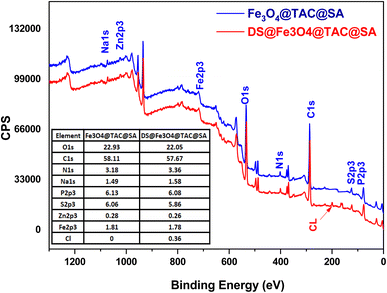 |
| | Fig. 9 XPS for Fe3O4@TAC@SA, and DS@Fe3O4@TAC@SA. | |
3.5.9. Effect on real water samples. Fe3O4@TAC@SA polymer's applicability in actual ambient water samples was investigated. As illustrated in Fig. S7a,† the removal efficiencies were 99.6, 98.8 and 96.7% in pure water, domestic water and lake water with the DS concentration of 10 mg L−1, respectively. The complexity of environmental water samples only slightly decreased the effectiveness of removal. In addition, the combined aqueous solution of five non-steroidal anti-inflammatory medicines maintained (NSAIDs) a clearance efficiency of DS of 90.7 percent, which was significantly higher than that of other NSAIDs (Fig. S7b†). The Fe3O4@TAC@SA polymer's successful performance demonstrates its viability for use in real-world DS water treatment.29
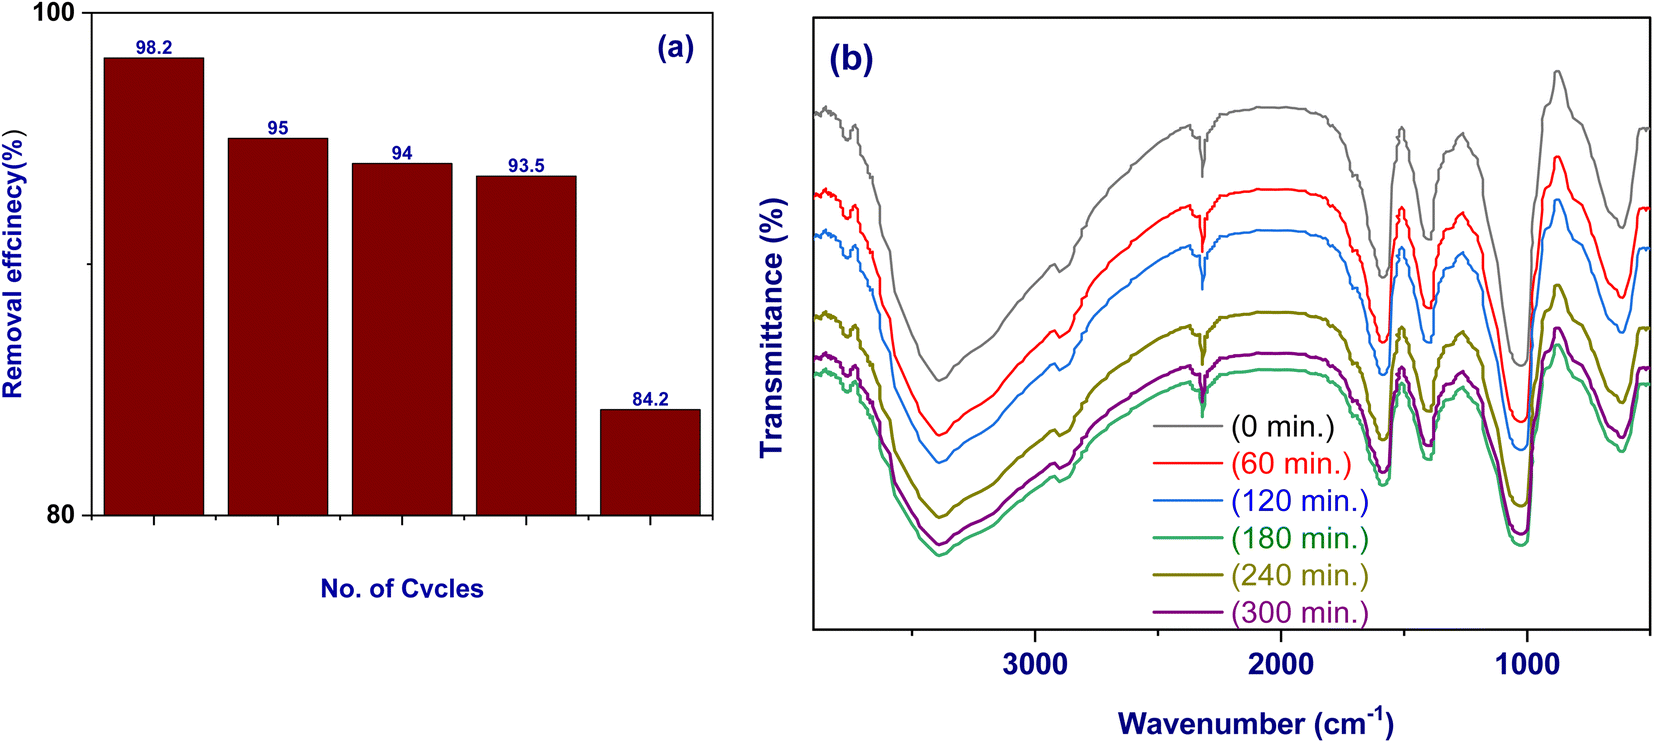
3.5.10. Reusability. It was important to look at DS desorption from Fe3O4@TAC@SA and regeneration of the absorbent in order to lower the cost involved with the removal procedure for prospective practical applications. DS-loaded Fe3O4@TAC@SA were magnetically removed from the solution for the desorption experiment, and the adsorbed DS was then removed using ultrasonication at 50 °C with 50 mL of NaOH (0.1 mol L−1) for 5 min. Following an additional 60 minutes of stirring, the magnetically extracted Fe3O4@TAC@SA was three times rinsed with deionized water before being used for the subsequent cycle of DS adsorption.56As can be seen in Fig. 10a, at the fifth cycle, the removal rate of DS by Fe3O4@TAC@SA polymer was lowered to 84.2 percent. This might have occurred as a result of DS's irreversible adsorption, which caused partial loss or elution of its active sites, rendering them useless for subsequent cycles of adsorption. The removal slope was reduced during the first four cycles, which demonstrated strong adsorption. Fe3O4@TAC@SA can therefore be recycled five times with success. Fe3O4@TAC@SA polymer was immersed in water (pH 5) for varying lengths of time to examine its stability (0, 60, 120, 180, 240 and 300 min). The Fe3O4@TAC@SA polymer was then taken out of the water, dried, and put through FTIR analysis. Fig. 10b presents the findings. As seen in the image, Fe3O4@TAC@SA polymer's infrared spectra have hardly changed over the course of 300 min, showing that it is still stable in water.
 |
| | Fig. 10 (a) Reusability cycles of Fe3O4@TAC@SA polymer; (b) FTIR spectra of Fe3O4@TAC@SA polymer after treatment with water (pH 5) at different time (0, 60, 120, 180, 240, and 300 min). | |
3.5.11. Comparison with other adsorbents. Comparing Table 6s high removal efficiency to that reported in the literature, DS was removed utilizing Fe3O4@TAC@SA polymer.
Table 6 Comparison of adsorption of DS for Fe3O4@TAC@SA polymer with different adsorbents
| Adsorbent |
Kinetic model and experimental conditions |
Equilibrium models |
qm (mg g−1) |
Ref |
| Guazuma ulmifolia Lam. Fruit |
PFO; te = 1440 min; C0 = 100.0 mg L−1 |
Langmuir |
36.90 |
57 |
| Bentonite organoclay Spectrogel® type C |
PFO; te = 500 min; C0 = 0.30 mmol L−1 |
Langmuir |
42.3 |
58 |
| Alginate/carbon-based films |
PFO; te = 360; C0 = 30.0 mg L−1 |
Temkin |
29.9 |
59 |
| Activated hydrochar paper board mill sludge |
PFO; te = 900 min; C0 = 10.0 mg L−1 |
Langmuir |
37.23 |
60 |
| Lignite activated cokes |
PSO; te = 30 min; C0 = 35.0 mg L−1 |
Freundlich |
24.95 |
61 |
| Carbon nanospheres (CN) from α-cellulose |
PSO; te = 60 min; C0 = 0.001 mg mL−1 |
Langmuir |
27.3 |
62 |
| Potato peel waste |
PSO; te = 1020 min; C0 = 50.0 mg L−1 |
Langmuir |
68.5 |
63 |
| Fe3O4@TAC@SA |
PSO; te = 100 min; C0 = 0.0002755 mol L−1 |
Langmuir |
858 |
This work |
4. Conclusion
This research has unveiled how adsorption technology is a promising and efficient solution for the removal of pharmaceuticals from water and wastewater, due to its superiority when compared to traditional treatments. We found great success in utilizing Fe3O4@TAC@SA polymer to remove diclofenac sodium (DS) from aqueous solution, as evidenced by an impressive removal capacity of 858 mg g−1. To gain insight into the adsorbent's properties, we conducted X-ray diffraction (XRD), X-ray photoelectron spectroscopy (XPS), scanning electron microscopy (SEM), and Fourier transform infrared spectroscopy (FT-IR). We further optimized the technique through experimental design (0.01 g of adsorbent mass and 250 rpm of agitation speed). These experiments allowed us to analyze both kinetics and equilibrium. The results showed that the Langmuir isotherm best represented the kinetic data, while the thermodynamic study revealed that the process was endothermic, affirming its spontaneity and rise in disorder. All in all, it is clear that adsorption technology is an excellent choice for removing pharmaceutical microcontaminants.
Data availability
The data that support the findings of this study are available on request from the corresponding author.
Conflicts of interest
The authors declare no conflict of interest, financial or otherwise.
Acknowledgements
Princess Nourah bint Abdulrahman University Researchers Supporting Project number (PNURSP2023R122), Princess Nourah bint Abdulrahman University, Riyadh, Saudi Arabia.
References
- R. Altman, B. Bosch, K. Brune, P. Patrignani and C. Young, Advances in NSAID development: evolution of diclofenac products using pharmaceutical technology, J. Drugs., 2015, 75, 859–877 CrossRef CAS PubMed.
- M. Parolini, Toxicity of the Non-Steroidal Anti-Inflammatory Drugs (NSAIDs) acetylsalicylic acid, paracetamol, diclofenac, ibuprofen and naproxen towards freshwater invertebrates: A review, J. Sci. Total Environ., 2020, 740, 140043 CrossRef CAS PubMed.
- J. Wang and S. Wang, Removal of pharmaceuticals and personal care products (PPCPs) from wastewater: a review, J. Environ. Manag., 2016, 182, 620–640 CrossRef CAS PubMed.
- D. Fatta-Kassinos, E. Hapeshi, A. Achilleos, S. Meric, M. Gros, M. Petrovic and D. Barcelo, Existence of pharmaceutical compounds in tertiary treated urban wastewater that is utilized for reuse applications, J. Water Resour. Manag., 2011, 25, 1183–1193 CrossRef.
- M. Rizwan, S. Ali, T. Abbas, M. Zia-ur-Rehman, F. Hannan, C. Keller, M. I. Al-Wabel and Y. S. Ok, Cadmium minimization in wheat: a critical review, J. Ecotoxicol. Environ. Safety, 2016, 130, 43–53 CrossRef CAS PubMed.
- D. Fatta-Kassinos, S. Meric and A. Nikolaou, Pharmaceutical residues in environmental waters and wastewater: current state of knowledge and future research, J. Anal. Bioanal. Chem., 2011, 399, 251–275 CrossRef CAS PubMed.
- I. Alessandretti, C. V. T. Rigueto, M. T. Nazari, M. Rosseto and A. J. J. o. E. C. E. Dettmer, Removal of diclofenac from wastewater: a comprehensive review of detection, characteristics and tertiary treatment techniques, J. Environ. Chem. Eng., 2021, 9, 106743 CrossRef CAS.
- M. A. K. Purnaningtyas, S. Sudiono and D. Siswanta, Synthesis of activated carbon/chitosan/alginate beads powder as an adsorbent for methylene blue and methyl violet 2B dyes, J. Indones. J. Chem., 2020, 20, 1119–1130 CrossRef CAS.
- S. A. Abdel-Gawad and H. M. Abd El-Aziz, Removal of pharmaceuticals from aqueous medium using entrapped activated carbon in alginate, J. Air, Soil Water Res., 2019, 12 DOI:10.1177/1178622119848761.
- J.-W. Kim, H. Ishibashi, R. Yamauchi, N. Ichikawa, Y. Takao, M. Hirano, M. Koga and K. Arizono, Acute toxicity of pharmaceutical and personal care products on freshwater crustacean (Thamnocephalus platyurus) and fish (Oryzias latipes), J. Toxicol. Sci., 2009, 34, 227–232 CrossRef CAS PubMed.
- H. Hanif, A. Waseem, S. Kali, N. A. Qureshi, M. Majid, M. Iqbal, T. Ur-Rehman, M. Tahir, S. Yousaf and M. M. Iqbal, Environmental risk assessment of diclofenac residues in surface waters and wastewater: a hidden global threat to aquatic ecosystem, Environ. Monit. Assess., 2020, 192, 1–12 CrossRef PubMed.
- S. Tongur and S. Yildiz, Toxicological evaluation of carbamazepine active pharmaceutical ingredient with Lepidium sativum, Daphnia magna and Vibrio fischeri toxicity test methods, Desalination Water Treat., 2020, 201, 438–442 CrossRef CAS.
- A. S. Khan, T. H. Ibrahim, M. I. Khamis, P. Nancarrow, J. Iqbal, I. AlNashef, N. A. Jabbar, M. F. Hassan and F. S. Mjalli, Preparation of sustainable activated carbon-alginate beads impregnated with ionic liquid for phenol decontamination, J. Clean. Prod., 2021, 321, 128899 CrossRef CAS.
- J. Ma, M. Zhang, M. Ji, L. Zhang, Z. Qin, Y. Zhang, L. Gao and T. Jiao, Magnetic graphene oxide-containing chitosan-sodium alginate hydrogel beads for highly efficient and sustainable removal of cationic dyes, Int. J. Biol. Macromol., 2021, 193, 2221–2231 CrossRef CAS PubMed.
- M. Z. Shahid, L. Yu and R. Mehmood, Tailored fabrication of triple-surface-features in well-crystalline BiOCl photocatalyst and their synergistic role in catalytic processes, Catal. Sci. Technol., 2020, 10, 2242–2253 RSC.
- Y. Zhang, K. Zhao, J. Huang, H.-Y. Hsu, J. Xu, R. Luque, W. Niu and G. J. A. A. N. M. Xu, Non-centrosymmetric Hollow BiOCl Nanocaps with Tailored Openings for the Photocatalytic Degradation of Rhodamine B, ACS Appl. Nano Mater., 2022, 5, 2326–2334 CrossRef CAS.
- C. Li, J. Lu, S. Li, Y. Tong and B. Ye, Synthesis of magnetic microspheres with sodium alginate and activated carbon for removal of methylene blue, J. Mater., 2017, 10, 84 CrossRef PubMed.
- H. A. Younes, M. Taha, R. Mahmoud, H. M. Mahmoud and R. M. Abdelhameed, High adsorption of sodium diclofenac on post-synthetic modified zirconium-based metal-organic frameworks: experimental and theoretical studies, J. Colloid Interface Sci., 2022, 607, 334–346 CrossRef CAS PubMed.
- G. A. Kloster, D. Muraca, O. M. Londono, K. R. Pirota, M. A. Mosiewicki and N. E. Marcovich, Alginate based nanocomposites with magnetic properties, Compos. Appl. Sci. Manuf., 2020, 135, 105936 CrossRef CAS.
- H. Weng, Y. Yang, C. Zhang, M. Cheng, W. Wang, B. Song, H. Luo, D. Qin, C. Huang and F. Qin, Insight into FeOOH-mediated advanced oxidation processes for the treatment of organic polluted wastewater: a review, Chem. Eng. J., 2022, 139812 Search PubMed.
- H. Tan, J. Li, M. He, J. Li, D. Zhi, F. Qin and C. Zhang, Global evolution of research on green energy and environmental technologies: a bibliometric study, J. Environ. Manage., 2021, 297, 113382 CrossRef CAS PubMed.
- C. S. Patil, D. B. Gunjal, V. M. Naik, R. D. Waghmare, T. D. Dongale, M. D. Kurkuri, G. B. Kolekar and A. H. Gore, Sustainable conversion of waste tea biomass into versatile activated carbon: application in quick, continuous, and pressure filtration of miscellaneous pollutants, Biomass Convers. Biorefin., 2022, 1–14 CAS.
- X. X. Liang, A. Omer, Z.-h. Hu, Y. g. Wang, D. Yu and X.-k. Ouyang, Efficient adsorption of diclofenac sodium from aqueous solutions using magnetic amine-functionalized chitosan, Chemosphere, 2019, 217, 270–278 CrossRef CAS PubMed.
- Y.-H. Zhang, J.-Z. Han, W.-J. Fu, Y.-F. Zhang, H.-X. Ma, D. He and Y.-M. Dong, Rapid simultaneous determination of coumarins and organic acids in notopterygium by an isocratic micellar liquid chromatography based on Box-Behnken design, Microchem. J., 2022, 179, 107592 CrossRef CAS.
- N. M. El-Metwaly, H. A. Katouah, M. El-Desouky, A. El-Bindary and M. El-Bindary, Fabricating of Fe3O4@Ag-MOF nanocomposite and evaluating its adsorption activity for removal of doxorubicin, J. Environ. Sci. Health, Part A, 2022, 1–17 Search PubMed , in press..
- G. H. Al-Hazmi, M. G. El-Desouky and A. A. El-Bindary, Synthesis, characterization and microstructural evaluation of ZnO nanoparticles by William-Hall and size-strain plot methods, Bull. Chem. Soc. Ethiop., 2022, 36, 815–829 CrossRef CAS.
- G. A. Al-Hazmi, A. A. El-Zahhar, M. G. El-Desouky and A. El-Bindary, Superior adsorption and removal of doxorubicin from aqueous solution using activated carbon via thermally treated green adsorbent: isothermal, kinetic, and thermodynamic studies, J. Environ. Technol., 2022, 1–47 Search PubMed.
- A. S. Al-Wasidi, I. I. S. AlZahrani, H. I. Thawibaraka, A. M. Naglah, M. G. El-Desouky and M. A. El-Bindary, Adsorption studies of Carbon dioxide and Anionic dye on Green Adsorbent, J. Mol. Struct., 2022, 1250, 131736 CrossRef CAS.
- M. El-Desouky and A. El-Bindary, Magnetic metal-organic framework (Fe3O4@ZIF-8) nanocomposites for adsorption of anionic dyes from wastewater, J. Inorg. Nano-Metal Chem., 2021, 1–15 Search PubMed.
- G. A. A. AlHazmi, Kh. S. AbouMelha, M. G. El-Desouky and A. A. El-Bindary, Effective Adsorption of Doxorubicin Hydrochloride on Zirconium Metal-Organic Framework: Equilibrium, Kinetic and Thermodynamic Studies, J. Mol. Struct., 2022, 1258, 132679 CrossRef CAS.
- M. A. El-Bindary, M. G. El-Desouky and A. A. El-Bindary, Metal-organic frameworks encapsulated with an anticancer compound as drug delivery system: synthesis, characterization, antioxidant, anticancer, antibacterial
and molecular docking investigation, Appl. Organomet. Chem., 2022, e6660 CAS.
- T. A. Altalhi, M. M. Ibrahim, G. A. Mersal, M. Mahmoud, T. Kumeria, M. G. El-Desouky, A. A. El-Bindary and M. A. El-Bindary, Adsorption of doxorubicin hydrochloride onto thermally treated green adsorbent: equilibrium, kinetic and thermodynamic studies, J. Mol. Struct., 2022, 1263, 133160 CrossRef CAS.
- G. A. Al-Hazmi, A. A. El-Zahhar, M. G. El-Desouky, M. A. El-Bindary and A. A. El-Bindary, Efficiency of Fe3O4@ ZIF-8 for the removal of Doxorubicin from aqueous solutions: Equilibrium, kinetics and thermodynamic studies, J. Environ. Technol., 2022, 1–48 Search PubMed.
- M. G. El-Desouky, A. A. El-Bindary, M. A. M. El-Afify and N. Hassan, Synthesis, characterization, theoretical calculation, DNA binding, molecular docking, anticovid-19 and anticancer chelation studies of some transition metal complexes, Inorg. Nano-Met. Chem., 2022, 52, 1–16 Search PubMed.
- G. A. A. Al-Hazmi, M. A. El-Bindary, M. G. El-Desouky and A. A. El-Bindary, Efcient adsorptive removal of industrial dye from aqueous solution by synthesized zeolitic imidazolate framework-8 loaded date seed activated carbon and statistical physics modeling, Desalination Water Treat., 2022, 258, 85–103 CrossRef CAS.
- H. Wang, W. Luan, L. Sun, Z. Zeng, W. Xue and Y. Bai, Study on polyvinyl butyral purification process based on Box-Behnken design and artificial neural network, Chem. Eng. Res. Des., 2022, 184, 291–302 CrossRef CAS.
- S. N. Ayyubi and A. Purbasari, The effect of composition on mechanical properties of biodegradable plastic based on chitosan/cassava starch/PVA/crude glycerol: optimization of the composition using Box Behnken Design, Mater. Today Proc., 2022, 63(1), S78–S83 CrossRef CAS.
- H. Chaker, N. Ameur, K. Saidi-Bendahou, M. Djennas and S. Fourmentin, Modeling and Box-Behnken design optimization of photocatalytic parameters for efficient removal of dye by lanthanum-doped mesoporous TiO2, J. Environ. Chem. Eng., 2021, 9, 104584 CrossRef CAS.
- I. Khatib, M. Y. Chow, J. Ruan, D. Cipolla and H.-K. Chan, Modeling of a spray drying method to produce ciprofloxacin nanocrystals inside the liposomes utilizing a response surface methodology: Box-Behnken experimental design, Int. J. Pharm., 2021, 597, 120277 CrossRef CAS PubMed.
- E. Velayi and R. Norouzbeigi, Fabrication of epoxy/SiO2/ZnO superhydrophobic nanocomposite mesh membranes for oil-water separation: correlating oil flux to fabrication parameters via Box-Behnken design, Appl. Surf. Sci., 2023, 611, 155594 CrossRef CAS.
- B. Ye, Z. Zhao and H. Liu, Photocatalytic degradation of Estrone and Congo red by the magnetic antibacterial photocatalyst g-C3N4/CeO2/M-rGO under visible light and optimization by Box-Behnken statistical design (BBD), J. Mol. Struct., 2023, 1272, 134205 CrossRef CAS.
- G. A. Al-Hazmi, A. A. El-Zahhar, M. G. El-Desouky, M. A. El-Bindary and A. A. El-Bindary, Adsorption of industrial dye onto a zirconium metal-organic framework: synthesis, characterization, kinetics, thermodynamics, and DFT calculations, J. Coord. Chem., 2022, 75, 1203–1229 CrossRef CAS.
- M. G. El-Desouky, A. A. El-Bindary and M. A. El-Bindary, Low-Temperature Adsorption Study of Carbon Dioxide on Porous Magnetite Nanospheres Iron Oxide, Biointerface Res. Appl. Chem., 2021, 12, 6252–6268 Search PubMed.
- M. G. El-Desouky, M. A. Khalil, A. A. El-Bindary and M. A. ElBindary, Biological, Biochemical and Thermochemical Techniques for Biofuel Production: an Updated Review, Biointerface Res. Appl. Chem., 2022, 12, 3034–3054 CAS.
- I. Langmuir, The constitution and fundamental properties of solids and liquids. Part I. Solids, J. Am. Chem. Soc., 1916, 38, 2221–2295 CrossRef CAS.
- H. M. F. Freundlich, Over the adsorption in solution, J. Phys. Chem., 1906, 57, 385–471 CAS.
- M. Dubinin, The equation of the characteristic curve of activated charcoal, Proc. Acad. Sci. USSR Phys. Chem. Sect., 1947, 55, 327–329 CAS.
- V. P. M. I. Tempkin, Kinetics of ammonia synthesis on promoted iron catalyst, Acta Phys. Chim. USSR, 1940, 12, 327–356 Search PubMed.
- A. S. Al-Wasidi, I. I. S. AlZahrani, A. M. Naglah, M. G. El-Desouky, M. A. Khalil, A. A. El-Bindary and M. A. El-Bindary, Effective Removal of Methylene Blue From Aqueous Solution Using Metal-Organic Framework; Modelling Analysis, Statistical Physics Treatment and DFT Calculations, ChemistrySelect, 2021, 6, 11431–11447 CrossRef CAS.
- S. K. Lagergren, About the theory of so-called adsorption of soluble substances, Sven. Vetenskapsakad. Handl., 1898, 24, 1–39 Search PubMed.
- Y.-S. Ho and G. McKay, Pseudo-second order model for sorption processes, Process Biochem., 1999, 34, 451–465 CrossRef CAS.
- W. J. Weber Jr and J. C. Morris, Kinetics of adsorption on carbon from solution, J. Sanit. Eng. Div., 1963, 89, 31–59 CrossRef.
- M. Vlad and E. Segal, A kinetic analysis of Langmuir model for adsorption within the framework of Jovanovic theory; a generalization of the Jovanovic isotherm, J. Surf. Sci., 1979, 79, 608–616 CrossRef CAS.
- M. A. El-Bindary, M. G. El-Desouky and A. A. El-Bindary, Adsorption of industrial dye from aqueous solutions onto thermally treated green adsorbent: a complete batch system evaluation, J. Mol. Liq., 2021, 346, 117082 CrossRef.
- M. G. El-Desouky, M. A. El-Bindary and A. A. El-Bindary, Effective adsorptive removal of anionic dyes from aqueous solution, Vietnam J. Chem., 2021, 59, 341–361 CAS.
- N. Hassan, A. Shahat, A. El-Didamony, M. G. El-Desouky and A. A. El-Bindary, Equilibrium, Kinetic and Thermodynamic studies of adsorption of cationic dyes from aqueous solution using ZIF-8, Moroccan J. Chem., 2020, 8(8–3), 2627–2637 Search PubMed.
- L. A. Araujo, C. O. Bezerra, L. F. Cusioli, M. T. Rodríguez, R. G. Gomes and R. Bergamasco, Diclofenac adsorption using a low-cost adsorbent derived from Guazuma ulmifolia Lam. fruit via chemical and thermal treatment, J. Environ. Chem. Eng., 2021, 9, 106629 CrossRef CAS.
- G. S. Maia, J. R. de Andrade, M. G. da Silva and M. G. Vieira, Adsorption of diclofenac sodium onto commercial organoclay: kinetic, equilibrium and thermodynamic study, J. Powder Technol., 2019, 345, 140–150 CrossRef CAS.
- M. S. Shamsudin, S. F. Azha, L. Sellaoui, M. Badawi, A. Bonilla-Petriciolet and S. Ismail, Performance and interactions of diclofenac adsorption using Alginate/Carbon-based Films: experimental investigation and statistical physics modelling, Chem. Eng. J., 2022, 428, 131929 CrossRef CAS.
- S. Oumabady, P. S. Selvaraj, K. Periasamy, D. Veeraswamy, P. T. Ramesh, T. Palanisami and S. P. Ramasamy, Kinetic and isotherm insights of Diclofenac removal by sludge derived hydrochar, J. Sci. Rep., 2022, 12, 2184 CrossRef CAS PubMed.
- L. Wu, C. Du, J. He, Z. Yang and H. Li, Effective adsorption of diclofenac sodium from neutral aqueous solution by low-cost lignite activated cokes, J. Hazard Mater., 2020, 384, 121284 CrossRef CAS PubMed.
- Z. Feng, K. Odelius, G. K. Rajarao and M. Hakkarainen, Microwave carbonized cellulose for trace pharmaceutical adsorption, Chem. Eng. J., 2018, 346, 557–566 CrossRef CAS.
- M. Bernardo, S. Rodrigues, N. Lapa, I. Matos, F. Lemos, M. Batista, A. Carvalho and I. Fonseca, High efficacy on diclofenac removal by activated carbon produced from potato peel waste, Int. J. Environ. Sci. Technol., 2016, 13, 1989–2000 CrossRef CAS.
|
| This journal is © The Royal Society of Chemistry 2023 |
Click here to see how this site uses Cookies. View our privacy policy here. 
 Open Access Article
 This Open Access Article is licensed under a Creative Commons Attribution-Non Commercial 3.0 Unported Licence
 *ef
*ef