
 Open Access Article
 This Open Access Article is licensed under a
 Creative Commons Attribution 3.0 Unported Licence
Grain growth of NpO2 and UO2 nanocrystals†
Viktoria Baumann *ab,
Karin Popab,
Marco Colognab,
Murielle Riveneta and
Olaf Walter*b
*ab,
Karin Popab,
Marco Colognab,
Murielle Riveneta and
Olaf Walter*b
aUniv. Lille, CNRS, Centrale Lille, Univ. Artois, UMR 8181 – UCCS – Unité de Catalyse et Chimie du Solide, F-59000 Lille, France. E-mail: viktoria.baumann@centralelille.fr
bEuropean Commission, Joint Research Centre, Karlsruhe, Germany. E-mail: olaf.walter@ec.europa.eu
First published on 22nd February 2023
Abstract
We report on the crystallite growth of nanometric NpO2 and UO2 powders. The AnO2 nanoparticles (An = U and Np) were synthesized by hydrothermal decomposition of the corresponding actinide(IV) oxalates. NpO2 powder was isothermally annealed between 950 °C and 1150 °C and UO2 between 650 °C and 1000 °C. The crystallite growth was then followed by high-temperature X-ray diffraction (HT-XRD). The activation energies for the growth of crystallites of UO2 and NpO2 were determined to be 264(26) kJ mol−1 and 442(32) kJ mol−1, respectively, with a growth exponent n = 4. The value of the exponent n and the low activation energy suggest that the crystalline growth is rate-controlled by the mobility of the pores, which migrate by atomic diffusion along the pore surfaces. We could thus estimate the cation self-diffusion coefficient along the surface in UO2, NpO2 and PuO2. While data for surface diffusion coefficients for NpO2 and PuO2 are lacking in the literature, the comparison with literature data for UO2 supports further the hypothesis of a surface diffusion controlled growth mechanism.
1 Introduction
In the processing of ceramic materials sintering is one of the most important and energy-intensive steps. Nuclear fuel pellets (UO2 or (U,Pu)O2) are made by cold pressing the powder in a die and then heating to high temperatures until the particles have coalesced. To sinter such powders to the required relative density of 95%, temperatures up to 1700 °C are typically used.1–3The densification rate is a function of particle size and temperature. If the particle size is decreased, the densification rate will increase, and the temperature and duration of the process can be decreased, saving costs and energy.
In the last decade, different syntheses routes of nanocrystalline AnO2 have been presented.5–10 The hydrothermal decomposition of actinide(IV) oxalates to nanocrystalline actinide dioxide powder has shown several advantages11–14 and the potential to decrease drastically the sintering temperature.15,16
In order to control the sintering process and the final microstructure, its associated mechanisms must be well understood. Sintering is accompanied by grain growth and the elimination of pores. Such processes can occur through different mechanisms as surface diffusion, grain boundary diffusion, lattice diffusion or vapor transport.4,17 In crystalline ceramics, grain boundary (GB) and lattice diffusion (L) from grain boundary to pore contribute most to the densification stage, while diffusion from the surface (S) leads to neck-growth but not to densification. The activation energies Q for the diffusion coefficients are typically in the order QL > QGB > QS, and surface diffusion is thus dominating at low temperature, which is one of the reasons why fast-firing techniques employ a rapid heating rate in the low temperatures, to overcome the non-densifying range.18–20
The migration of pores in nuclear fuels is also controlled by a surface diffusion or evaporation–condensation mechanisms.21 In situ-methods can provide valuable information on the mechanisms involved in sintering, grain growth and pore-migration. Environmental scanning electron microscope at high temperature (HT-ESEM) was introduced as an innovative and powerful method to investigate in situ the sintering behaviour of actinide oxide materials.22–25 For example, Clavier et al. used HT-ESEM device to obtain sintering maps of ThO2, as well as an impressive 2-grain scale observation to capture the first stage of sintering.26 Bouëxière et al. measured the crystallite growth of PuO2 nanocrystals in situ with a HT-XRD device, obtaining an activation energy for crystallite growth of 351(5) kJ mol−1.27 In this work we applied the same method to UO2 and NpO2 nanocrystals. The samples were isothermally annealed for 30 hours in the range of 950 °C to 1150 °C for NpO2, and 650 °C to 1000 °C for UO2. During this process, XRD patterns were recorded so that particle growth could be determined over time at the respective temperatures. We calculated activation energies for UO2 and NpO2 and elaborated on the crystallite growth exponent.
2 Experimental
2.1 Synthesis
Nanocrystalline NpO2 and UO2 powders, shown in Fig. 1, were prepared by the hydrothermal decomposition of the corresponding actinide oxalates into actinide dioxide nanoparticles, as described elsewhere.12 The process was reported for the first time by Walter et al.11 and has already been applied in several studies.12,15,28 In summary, the oxalates (U(C2O4)2·6H2O and Np(C2O4)2·6H2O), were directly precipitated from a U(IV) solution (0.47 M, obtained by electroreduction of a UO2(NO3)2 solution in 4 M HNO3 with 0.5 M hydrazine) and from a Np(IV) solution (0.6 M in about 2 M HNO3) with excess of 0.5 M oxalic acid. The oxalic acid dihydrate was supplied by Merck in analytical grade. The respective oxalates were placed in a Teflon-lined hydrothermal synthesis reactor and covered with 3 to 5 ml of distilled water. The reactor was tightly sealed and heated to the desired temperature in a heating jacket made out of steel. While uranium oxalate completely decomposed after only 3.5 hours at a temperature of 170 °C, neptunium oxalate was heated at 160 °C for 18 hours. To avoid possible oxidation of UO2, the work was carried out under argon atmosphere.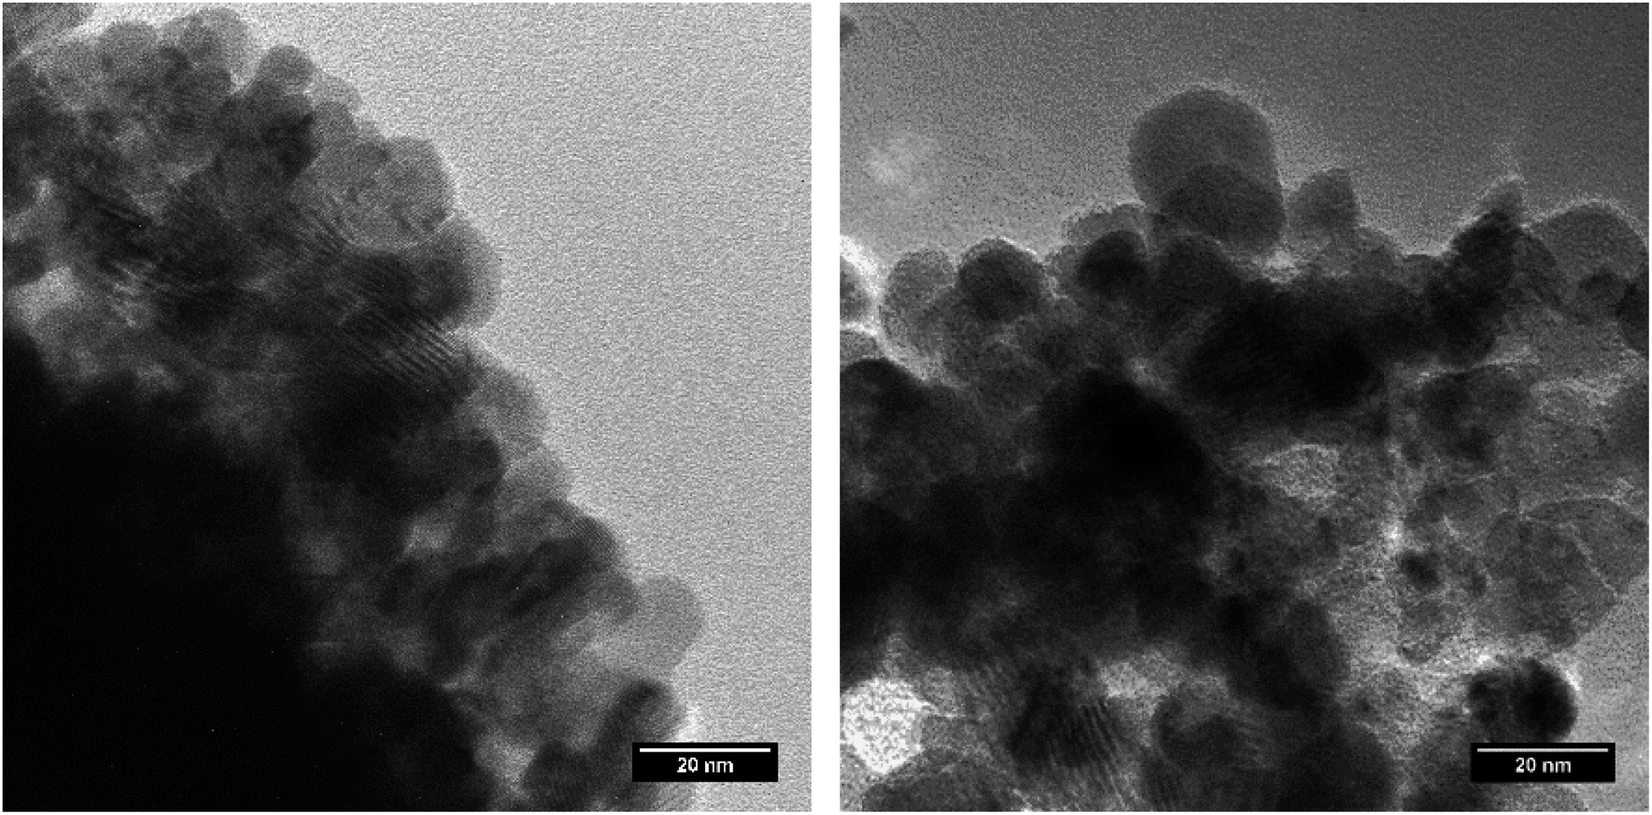 | ||
| Fig. 1 TEM images of NpO2 (left) and UO2 (right) obtained by hydrothermal decomposition of the corresponding actinide oxalates. | ||
2.2 High-temperature XRD
The isothermal HT-XRD measurements were performed under vacuum using a Bruker D8 diffractometer with a Bragg–Brentano configuration, a curved Ge-(1,1,1) monochromator, a ceramic copper tube (40 kV, 40 mA), and an Anton Paar HTK 2000 chamber. Approximately 10 mg of sample was mixed with 1 ml of ethanol and the suspension was placed on the Pt sample holder preheated at 70 °C to ensure homogeneous distribution of the powder during evaporation of ethanol. The chamber was closed, vacuumed and heated to the desired temperature. For the isothermal experiments, a temperature range of 650 °C to 1000 °C was chosen for UO2. For NpO2, a temperature range of 700 °C to 1150 °C was investigated and due to the faster growth, a range of 950 °C to 1150 °C was selected for the isothermal tests.The neptunium sample was first heated at 950 °C with a heating rate of 10 °C min−1 and held at this temperature for 30 hours, and then annealed at 1050 °C and 1150 °C following the same procedure. 50 diffractograms were recorded at each temperature in the range of 45° < 2Θ < 61°, with each measurement lasting 36 minutes. A similar procedure was performed with uranium sample. However, because of the broader peak at 46.8°, the three XRD patterns were recorded in the range of 43° < 2Θ < 60°. In contrast to NpO2, fresh UO2 nanocrystals were used for each isothermal annealing. In this case, after reaching the desired temperature (which was maintained for 30 hours), the HT-XRD device was cooled to room temperature and the powder was then replaced with new sample before being heated to the next higher temperature. The isothermal measurement for UO2 was performed at 650 °C, 700 °C, 800 °C, 900 °C and 1000 °C.
2.3 Crystallite size measurements
The crystallite size (G) was calculated from the broadening of the three measured peaks. Profile fitting was performed using HighScore software (version 3.0.4) and the full width at half maximum intensity (FWHM) was calculated to determine the crystallite size using the Scherrer equation (eqn (1)):
 | (1) |
2.4 Grain growth model
We analyzed the grain growth kinetics of NpO2 and UO2 nanocrystallites with the classical grain growth model for porous single phase materials, as previously done for PuO2 nanocrystallites.12 The grain size data as a function of annealing time at different temperatures were fitted with (eqn (2)):4,29| Gn = G0n + kt | (2) |
 | (3) |
 | (4) |
The subsequent plot of ln(k) as a function of 1/T gives the value of −Q/R as the slope of the straight line, which, multiplied by R, corresponds to the activation energy Q of the mechanism for grain growth.
3 Results
The XRD patterns of AnO2 (An = Np and U) recorded at different temperatures are shown in Fig. 2. For NpO2 at lower temperatures the growth is slow and T = 950 °C, 1050 °C and 1150 °C were chosen for the kinetic studies.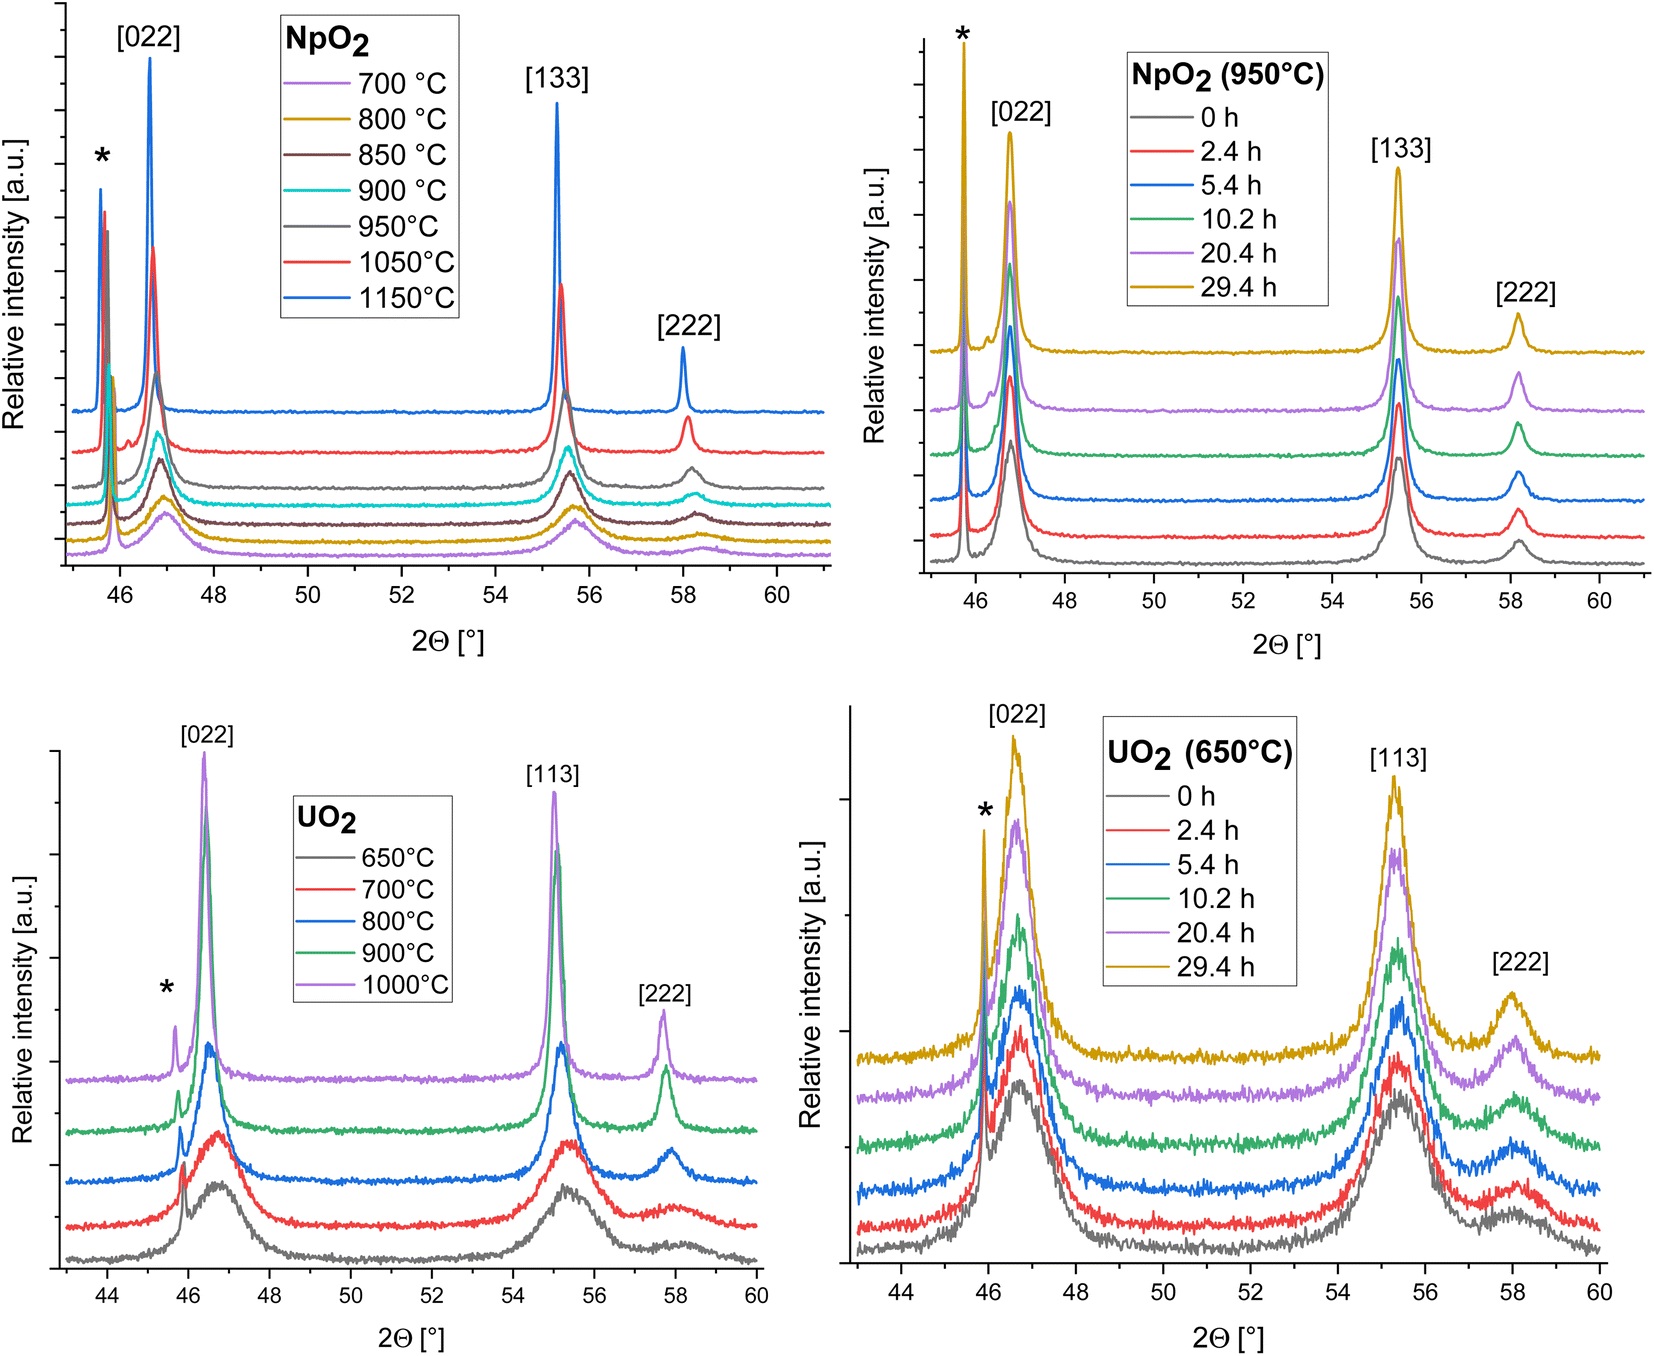 | ||
| Fig. 2 Evolution of the XRD patterns of NpO2 (top) and UO2 (down) as a function of temperature (at t0) (left) and time (at a temperature of 950 °C for NpO2 and 650 °C for UO2) (right); peaks marked by * arise from the Pt sample holder. | ||
The powder formed after hydrothermal conversion of actinide oxalates had a fluorite-type cubic structure and crystallized in the space group Fm![[3 with combining macron]](https://www.rsc.org/images/entities/char_0033_0304.gif) m (225). A spherical nearly shape was found for both crystallites from the transmission electron micrographs (Fig. 1). The XRD data of the isotherms measured at 950 °C (for NpO2) and at 650 °C (for UO2) are given on the right side of Fig. 2 as a function of time. The time t0 corresponds to the time after the acquisition of the first XRD spectrum (36 minutes) and consequently t1 = 72 min. The patterns of both samples showed a sharpening of the peaks with temperature and time, caused by crystallite growth. The crystallite size, as a function of time for the first 6 hours are presented in Fig. 3 and in Table 1, the full range (30 h) is shown in Fig. S1.†
m (225). A spherical nearly shape was found for both crystallites from the transmission electron micrographs (Fig. 1). The XRD data of the isotherms measured at 950 °C (for NpO2) and at 650 °C (for UO2) are given on the right side of Fig. 2 as a function of time. The time t0 corresponds to the time after the acquisition of the first XRD spectrum (36 minutes) and consequently t1 = 72 min. The patterns of both samples showed a sharpening of the peaks with temperature and time, caused by crystallite growth. The crystallite size, as a function of time for the first 6 hours are presented in Fig. 3 and in Table 1, the full range (30 h) is shown in Fig. S1.†
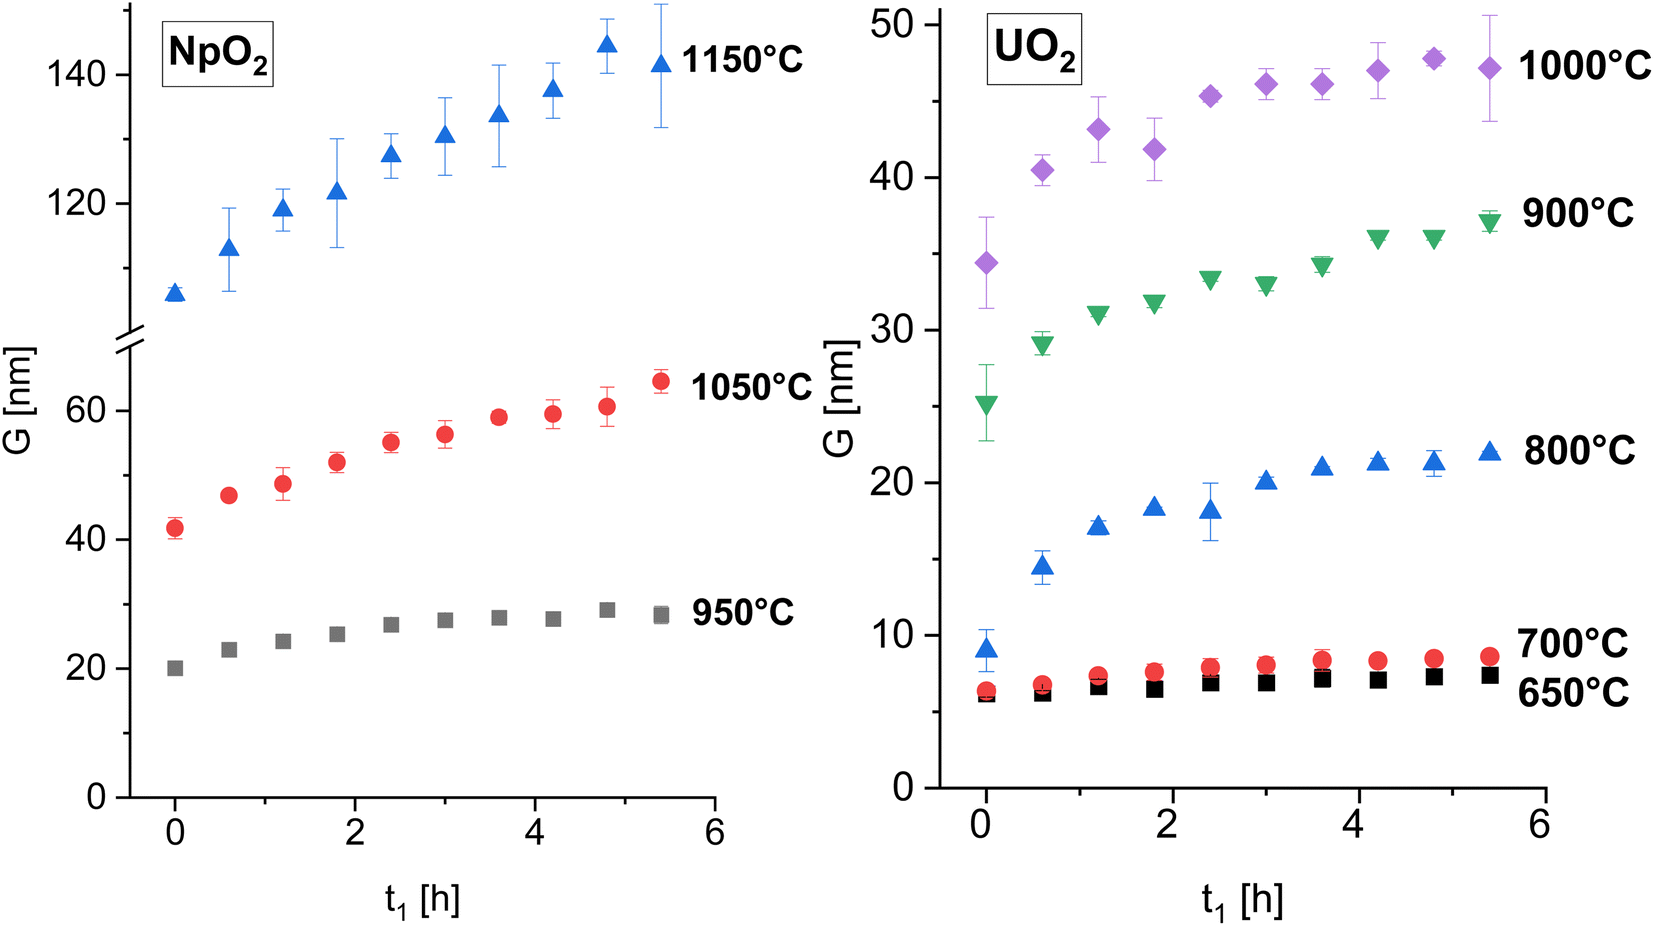 | ||
| Fig. 3 The average crystallite size of NpO2 (left) and UO2 (right) as a function of time for various temperature for the first 6 hours. The full time interval is shown in Fig. S1.† | ||
| Time [min] | NpO2 | UO2 | ||||||
|---|---|---|---|---|---|---|---|---|
| Crystallite size [nm] | Crystallite size [nm] | |||||||
| 950 °C | 1050 °C | 1150 °C | 650 °C | 700 °C | 800 °C | 900 °C | 1000 °C | |
| 36 | 20.1(0.9) | 41.8(1.7) | 105.9(1.1) | 6.2(0.2) | 6.4(0.1) | 9.0(1.4) | 25.2(2.5) | 34.4(3.0) |
| 72 | 22.9(0.5) | 46.8(0.2) | 112.9(6.5) | 6.2(0.2) | 6.8(0.3) | 14.4(1.1) | 29.1(0.8) | 40.5(1.0) |
| 108 | 24.2(0.6) | 48.7(2.5) | 119.0(3.3) | 6.7(0.5) | 7.3(0.3) | 17.0(0.5) | 31.1(0.2) | 43.1(2.2) |
| 144 | 25.4(0.6) | 52.0(1.6) | 121.6(8.5) | 6.5(0.2) | 7.6(0.5) | 18.3(0.2) | 31.9(0.4) | 41.8(2.1) |
| 180 | 26.8(0.7) | 55.1(1.6) | 127.4(3.5) | 6.9(0.4) | 7.9(0.6) | 18.1(1.9) | 33.4(0.3) | 45.3(0.4) |
| 216 | 27.5(0.3) | 56.3(2.2) | 130.4(6.0) | 6.9(0.4) | 8.1(0.5) | 20.0(0.4) | 33.0(0.5) | 46.1(1.0) |
| 252 | 27.9(0.3) | 59.0(1.0) | 133.6(7.9) | 7.2(0.6) | 8.4(0.7) | 20.9(0.2) | 34.3(0.5) | 46.1(1.0) |
| 288 | 27.7(0.9) | 59.5(2.2) | 137.5(4.3) | 7.1(0.4) | 8.3(0.4) | 21.2(0.4) | 36.1(0.3) | 47.0(1.8) |
| 324 | 29.1(0.8) | 60.7(3.1) | 144.4(4.2) | 7.3(0.4) | 8.5(0.3) | 21.3(0.8) | 36.1(0.3) | 47.8(0.5) |
| 360 | 28.3(1.3) | 64.6(1.8) | 141.4(9.6) | 7.4(0.4) | 8.6(0.3) | 21.9(0.2) | 37.1(0.7) | 47.2(3.5) |
After the initial rapid growth phase in the first hours, growth with slower kinetics was observed at most annealing temperatures, so that the data after 6 hours were not included in the analysis of the rate constant. Miao et al. also observed a similar phenomenon for the annealing of UO2.30 The grain growth exponent n and the growth constant k were determined from eqn (2) applied to the first 6 hours of annealing, by plotting Gn − G0n vs. time at constant temperature and performing a linear regression with a fixed intercept at 0. The exponent n was restricted in the range n = 2 to 4. The value of n = 4 was chosen because it gave the best linear fit of the experimental points as measured by the adjusted R2 values (Fig. S2 and S3†). The grain growth constant k is the slope of the straight line, and is listed in Table 2 together with the results of the linear fit. The activation energy was then obtained from eqn (4) as the slope of the linear fit of the natural logarithm of k as a function of the reciprocal temperature (1/T) (Fig. 4). In the case of UO2 we neglected the data at T = 1000 °C in the calculation of Q because the linear fit was significantly worse than those obtained for the other temperatures (Table 2), which is as well true for all other exponents n. The activation energies for n in the range n = 2 to 4 are given in Fig. S4† and the fitted crystallite size extrapolated to the full experimental range of 30 h in Fig. S5.†
| Temperature [°C] | D0 [nm] | n | k [nm4 h−1] | R2 | |
|---|---|---|---|---|---|
| NpO2 | 950 | 20.1 | 4 | 127![[thin space (1/6-em)]](https://www.rsc.org/images/entities/char_2009.gif) 243(4952) 243(4952) |
0.99 |
| 1050 | 41.8 | 4 | 2319034(51642) |
0.99 | |
| 1150 | 105.9 | 4 | 57871100(1661392) |
0.99 | |
| UO2 | 650 | 6.2 | 4 | 288(13) | 0.98 |
| 700 | 6.4 | 4 | 788(28) | 0.99 | |
| 800 | 9.0 | 4 | 45438(177) |
0.99 | |
| 900 | 25.2 | 4 | 288485(1130) |
0.99 | |
| 1000 | 34.4 | 4 | 835046(64084) |
0.94 |
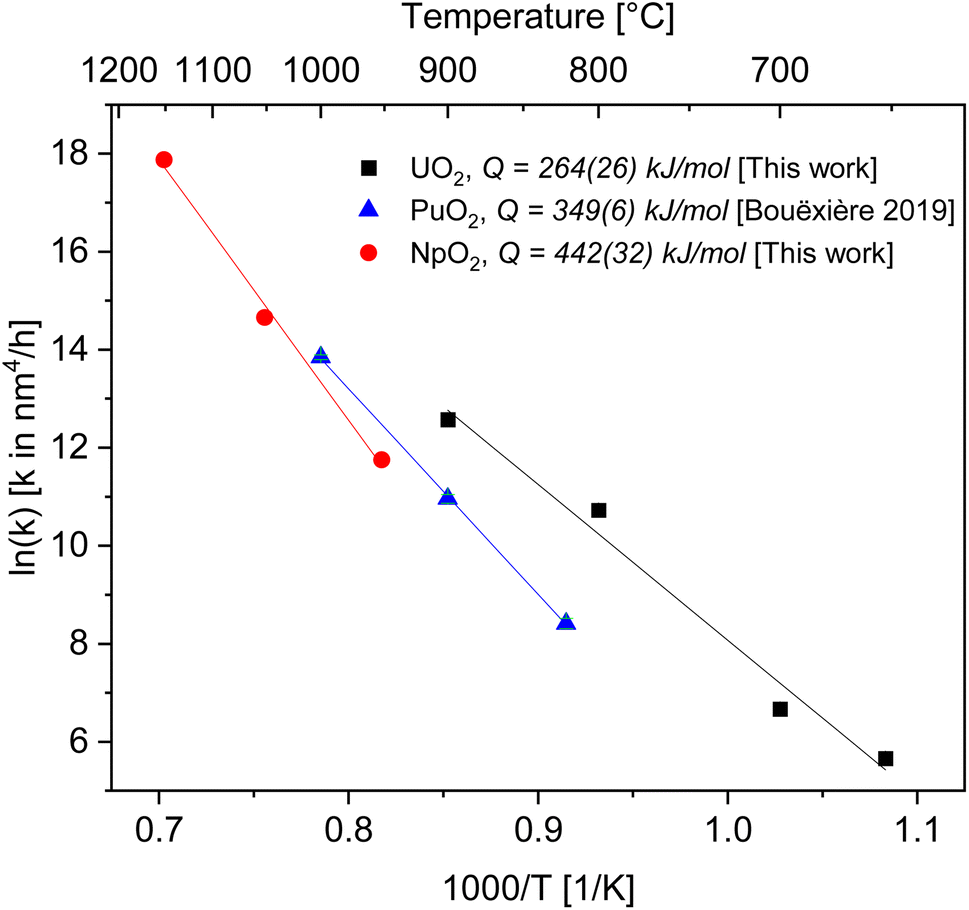 | ||
| Fig. 4 Arrhenius plot for the grain growth constant k using the exponent n = 4 for UO2 (black), PuO2 (ref. 27) (blue) and NpO2 (red). | ||
As a result, we obtained activation energies for crystallite growth of 264(26) kJ mol−1 and 442(32) kJ mol−1 for nanocrystalline UO2 and NpO2, respectively. Fig. 4 shows also data for PuO2 (ref. 27) with a recalculated activation energy of 349(6) kJ mol−1.
4 Discussion
4.1 Grain growth exponent n
Grain growth in porous ceramics is commonly analysed with a simplified approach, which assumes quasi-spherical isolated pores attached at the grain boundaries.4 Under such assumptions, different equations can be derived for the grain growth kinetics of pure, single-phase porous systems, depending on the rate-controlling atomic diffusion mechanism and if the movement of the boundary is limited by the pore mobility (pore control), or not (boundary control). An exponent of n = 2 is characteristic of growth by boundary control (as in dense materials) or by pore control via vapour transport, n = 3 of pore control via vapour transport or lattice diffusion, while n = 4 is given only by pore control by surface diffusion.Here the exponent n = 4 gave the best linear fit for both UO2 and NpO2 in agreement with what observed in PuO2,27 suggesting that in our conditions the growth of AnO2 (An = U, Np, Pu) nanopowder is controlled by the mobility of the pores, which are migrating via a surface diffusion mechanism. This is not surprising, as pore migration by surface diffusion is favoured at small grain size and low temperatures as the conditions investigated here, whereas pore migration by evaporation–condensation typically dominates at larger pore sizes and temperatures.21,31
4.2 Activation energy
In ceramic oxides both the cation and the anion need to be transported to allow diffusive processes (e.g. grain growth, sintering, creep) to occur. The slowest species along its fastest path controls the kinetics. Since in ceramic nuclear fuels the diffusion of the metal atom is orders of magnitude slower than oxygen,32 the activation energy Q in eqn (3) represents here the one for diffusion of the actinide cation (slower specie) along the pore surface (fastest path).The calculated activation energies with n = 4 are 264(26) kJ mol−1 for U in UO2, 442(32) kJ mol−1 for Np in NpO2, and 349(6) kJ mol−1 for Pu in PuO2. Thus the activation energy for the growth of AnO2 nanocrystallites (possibly equivalent to the activation energy for cation surface diffusion) increases in the order Np < Pu < U.
The comparison of our results with the activation energy from the literature is not straightforward: data on activation energy for surface diffusion or for grain growth in PuO2 and NpO2 are scarce or lacking, while data on UO2 are existing, but obtained mostly at higher temperatures and very likely larger pore sizes, where different diffusion mechanisms become dominant.
The activation energy for grain growth of UO2 nanocrystallites controlled by pore migration found here (264 kJ mol−1) is in the broad range of activation energies for grain growth reported in the literature, which is very scattered in the 100–600 kJ mol−1 range.21,33–36 A direct comparison is however not sensible because of the different mechanisms taking place for grain growth at different temperature and sizes (grain boundary, volume or evaporation–condensation) and the grain growth exponent is often assumed or measured between 2 and 4. It is important to note that the choice of the exponent n is crucial in determining the activation energy Q: for example, by varying from n = 2 to 4 in our analysis, the associated activation energies can be twice as high (Fig. S4†). This value of 264 kJ mol−1 is instead to be compared with the activation energy for surface diffusion, which was determined from old experiments and more recently molecular dynamic (MD) simulations. Matzke reviewed nine experiments and proposed an activation energy for surface diffusion of 454 kJ mol−1 in the 1200–1700 °C range.32 This surprisingly high value could be a consequence of the contribution of concurrent mechanisms at such temperatures, as grain boundary, volume and evaporation–condensation. Indeed Zhou and Olander performed more sophisticated experiments by isolating the contribution of evaporation–condensation and obtained a much lower value of 300(60) kJ mol−1 in the 1760–2100 °C range, which is in the same range of what found here.37 More recent molecular dynamics simulations for diffusion of U on the surface of nanocrystals or nanopores consistently confirm a value in the 260–320 kJ mol−1 range.38–40
4.3 Surface diffusion coefficient
For a better comparison, we calculate the diffusion coefficient for surface diffusion Ds, with the word of caution that we are performing an order-of-magnitude estimate, so the error could be in the range of 1 to 2 orders of magnitude. If, in our system, pore migration occurs by surface diffusion of U, then the grain boundary velocity vb, which can be approximated as the grain growth rate dG/dt, can be written as:41
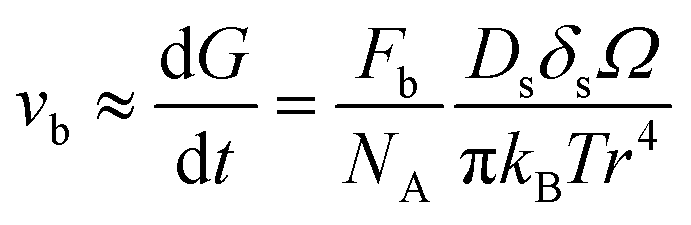 | (5) |
 , with D0s the diffusion pre-exponential factor and Qs the activation energy for surface diffusion, δs the thickness of the surface diffusion layer (taken equal to the lattice parameter a, 0.54 nm),38 Ω the atomic volume (4.09 × 10⁻²⁹ m3), kB the Boltzmann constant, and r the pore radius. Assuming coarsening by grain growth and pore coalescence (r ∼ G), eqn (5) becomes:
 | (6) |
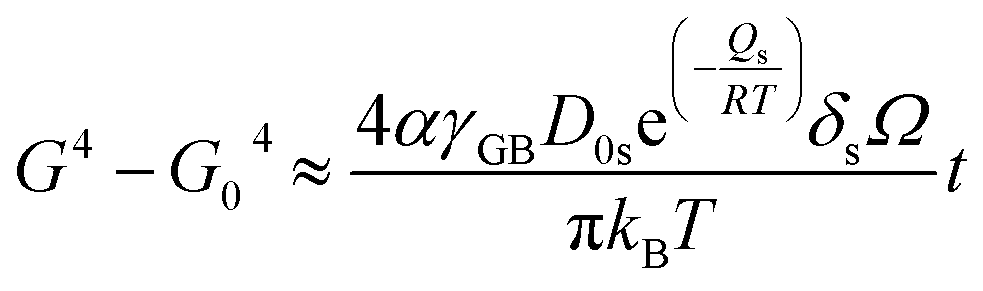 | (7) |
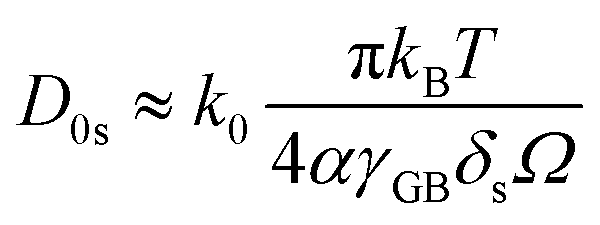 | (8) |
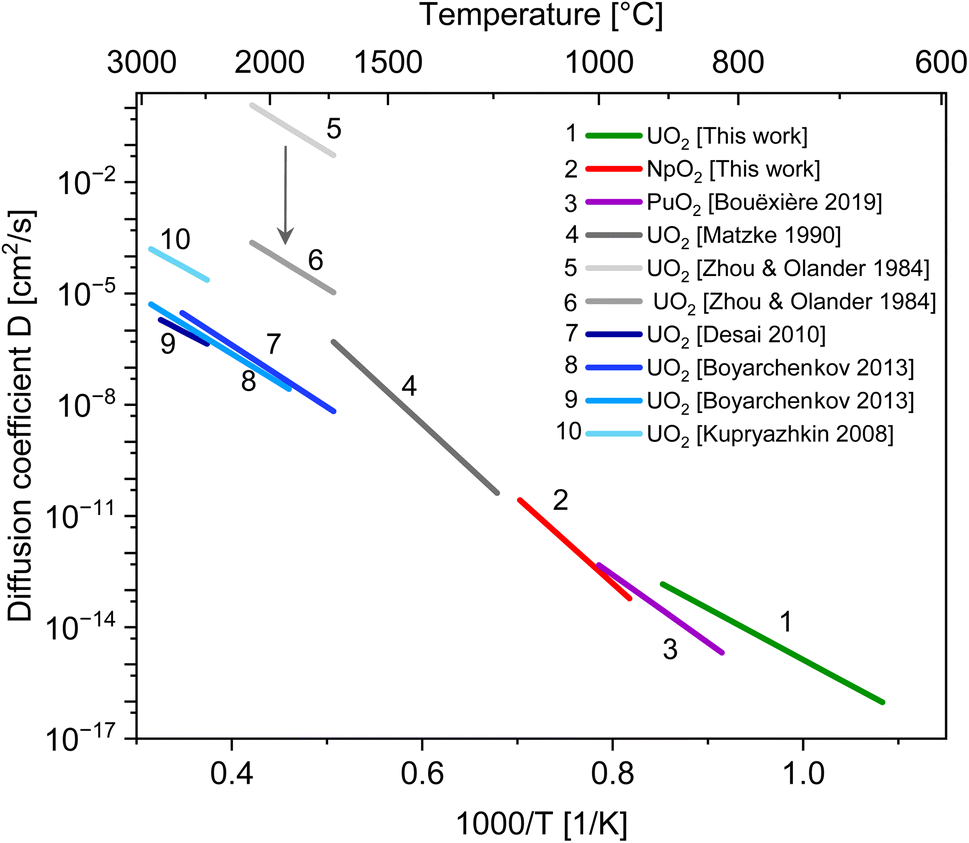 | ||
| Fig. 5 Diffusion coefficients for cation self-diffusion along the surface of actinide oxides. Values at low temperatures for U, Np and Pu are estimated from nano-grain growth experiments, lines 4 to 6 from previous experiments and lines 7 to 10 from MD simulation. | ||
| Actinide dioxide | Temperature range (°C) | D0s (cm2 s−1) | Qs (kJ mol−1) | Method | Reference |
|---|---|---|---|---|---|
| UO2 | 650–900 | 8 × 10⁻² | 264 | Nanocrystals growth | This work |
| NpO2 | 950–1150 | 4 × 10⁵ | 442 | Nanocrystals growth | This work |
| PuO2 | 820–1000 | 1 × 10² | 349 | Nanocrystals growth | 27 |
| UO2 | 1200–1700 | 5.00 × 10⁵ | 454 | Review (species: UO2, UO3) | 32 |
| UO2 | 1760–2100 | 5.00 × 10⁶ | 301 | Tracer diffusion (specie: UO2) | 37 |
| UO2 | 1760–2100 | <103 | 301 | Tracer diffusion (specie: U4+) | 37 |
| UO2 | 2427–2827 | 4.49 × 10⁻² | 257 | MD simulation, nanopores | 39 |
| UO2 | 1747–2597 | 1.91 × 100 | 319 | MD simulation, nanocrystals | 40 |
| UO2 | 1927–2907 | 4.80 × 10⁻¹ | 302 | MD simulation, nanocrystals | 40 |
| UO2 | 2351–2907 | 4.40 × 100 | 270 | MD simulation, nanocrystals | 38 |
The data for UO2 compares very well with the molecular dynamics simulations. The agreement with older experimental data is less good. One of the reason could be that competing diffusion mechanisms are involved at high temperature, as previously mentioned. The large scattering in published experimental data may also be due to the reported significant difficulties in the theoretical interpretation of tracer diffusion experiments.32,37 Such models were based on the assumption that the migrating species are UO2 and UO3 molecules with rotational degrees of freedom. If U4+ ions are assumed as the migrating species, the pre-exponential factor D0 is reduced by more than 3 orders of magnitude (see the arrow in Fig. 5).37
5 Conclusion
Activation energies of 264(26) kJ mol−1 and 442(32) kJ mol−1 were determined for UO2 and NpO2 by kinetic studies of particle growth of nanometric powder by isotherm HT-XRD measurements. For both actinide dioxides, the best linear fit was obtained with an exponent of 4, which suggests that grain growth of the nanocrystallites is controlled by the mobility of the pores (pore control), which migrate via a surface diffusion mechanism. Under such hypothesis, we estimated the pre-exponential term D0 of the self-diffusion coefficients Ds for U, Np and Pu in the corresponding oxides as 8 × 10⁻² cm2 s−1 for U, 4 × 10⁻² cm2 s−1 for Np and 1 × 10⁻² cm2 s−1 for Pu. The satisfactory order-of-magnitude comparison of the obtained diffusion coefficient for U with literature data supports the conclusion that growth of actinides oxides nanocrystallites in the studied conditions is controlled by surface diffusion.Conflicts of interest
There are no conflicts to declare.Acknowledgements
We are very grateful to Mr Daniel Bouëxière for performing XRD measurements on the NpO2 and UO2 nanocrystals. V. B. acknowledge ORANO and JRC Karlsruhe for the financial support of this work.References
- A. J. Carrea, J. Nucl. Mater., 1963, 8, 275–277 CrossRef CAS
.
- H. Assmann and H. Stehle, Nucl. Eng. Des., 1978, 48, 46–67 CrossRef
- T. Abe and K. Asakura, Uranium oxide and MOX production, in Comprehensive Nuclear Materials, ed. R. J. M. Konings, T. R. Allen, R. E. Stoller and S. Yamanaka, Elsevier, Amsterdam, 2012, p. 393, DOI:10.1016/B978-0-08-056033-5.00036-7
- M. N. Rahaman, Ceramic Processing, CRC Press, Boca Raton, 2nd edn, 2017 Search PubMed
- T. M. Nenoff, B. W. Jacobs, D. B. Robinson, P. P. Provencio, J. Huang, S. Ferreira and D. J. Hanson, Chem. Mater., 2011, 23, 49 CrossRef
- D. Hudry, C. Apostolidis, O. Walter, T. Gouder, E. Courtois, C. Kübel and D. Meyer, Chem.–Eur. J., 2012, 18, 8283–8287 CrossRef CAS
- G. I. Nkou Bouala, N. Clavier, R. Podor, J. Cambedouzou, A. Mesbah, H. P. Brau, J. Léchelle and N. Dacheux, CrystEngComm, 2014, 16, 6944–6954 RSC
- V. Tyrpekl, J. F. Vigier, D. Manara, T. Wiss, O. Dieste Blanco and J. Somers, J. Nucl. Mater., 2015, 460, 200–208 CrossRef CAS
- V. Trillaud, J. Maynadié, J. Manaud, N. Dacheux and N. Clavier, CrystEngComm, 2018, 20, 7749–7760 RSC
- C. Tabata, K. Shirasaki, A. Sunaga, H. Sakai, D. Li, M. Konaka and T. Yamamura, CrystEngComm, 2021, 23, 8660–8672 RSC
- O. Walter, K. Popa and O. Dieste Blanco, Open Chem., 2016, 14, 170–174 CAS
- K. Popa, O. Walter, O. D. Blanco, A. Guiot, D. Bouëxière, J.-Y. Colle, L. Martel, M. Naji and D. Manara, CrystEngComm, 2018, 20, 4614–4622 RSC
- J. Manaud, J. Maynadie, A. Mesbah, M. O. J. Y. Hunault, P. M. Martin, M. Zunino, N. Dacheux and N. Clavier, Inorg. Chem., 2020, 59, 3260–3273 CrossRef CAS
- J. Manaud, J. Maynadie, A. Mesbah, M. O. J. Y. Hunault, P. M. Martin, M. Zunino, N. Dacheux and N. Clavier, Inorg. Chem., 2020, 59, 14954–14966 CrossRef CAS
- L. Balice, D. Bouëxière, M. Cologna, A. Cambriani, J. F. Vigier, E. De Bona, G. D. Soraru, C. Kubel, O. Walter and K. Popa, J. Nucl. Mater., 2018, 498, 307–313 CrossRef CAS
- E. De Bona, L. Balice, L. Cognini, M. Holzhäuser, K. Popa, O. Walter, M. Cologna, D. Prieur, T. Wiss and G. Baldinozzi, J. Eur. Ceram. Soc., 2021, 41, 3655–3663 CrossRef CAS
- D. L. Johnson, Solid-state sintering, in Concise Encyclopedia of Advanced Ceramic Materials, ed. R. J. Brook, Pergamon, 1991, pp. 454–458, DOI:10.1016/B978-0-08-034720-2.50124-6
- M. P. Harmer and R. J. Brook, Trans. J. Br. Ceram. Soc., 1981, 80, 147–148 CAS
- M. C. Manière, C. Harnois and S. Marinel, J. Eur. Ceram. Soc., 2023, 43(5), 2057–2068 CrossRef
- M. Cologna and R. Raj, J. Am. Ceram. Soc., 2011, 94, 391–395 CrossRef CAS
- L. Bourgeois, P. Dehaudt, C. Lemaignan and J. P. Fredric, J. Nucl. Mater., 2001, 295, 73–82 CrossRef CAS
- R. Podor, N. Clavier, J. Ravaux, L. Claparede and N. Dacheux, J. Am. Ceram. Soc., 2012, 95, 3683–3690 CrossRef CAS
- N. Clavier, R. Podor, L. Deliere, J. Ravaux and N. Dacheux, Mater. Chem. Phys., 2013, 137, 742–749 CrossRef CAS
- G. I. Nkou Bouala, N. Clavier, S. Martin, J. Léchelle, J. Favrichon, H. P. Brau, N. Dacheux and R. Podor, J. Phys. Chem. C, 2016, 120, 386–395 CrossRef CAS
- G. I. Nkou Bouala, N. Clavier, J. Léchelle, J. Monnier, C. Ricolleau, N. Dacheux and R. Podor, J. Eur. Ceram. Soc., 2017, 37, 727–738 CrossRef CAS
- N. Clavier, G. I. Nkou Bouala, J. Léchelle, J. Martinez, N. Dacheux and R. Podor, Radiochim. Acta, 2017, 137, 879–892 CrossRef
- D. Bouëxière, K. Popa, O. Walter and M. Cologna, RSC Adv., 2019, 9, 6542–6547 RSC
- J.-F. Vigier, D. Freis, O. Walter, O. Dieste Blanco, D. Bouëxière, E. Zuleger, N. Palina, T. Vitova, R. J. M. Konings and K. Popa, CrystEngComm, 2022, 24, 6338–6348, 10.1039/D2CE00527A
- R. J. Brook, Treatise on Materials Science and Technology, ed. F. J. Wang, 1976, vol. 9, pp. 331–363 Search PubMed
- Y. Miao, T. Yao, J. Lian, J.-S. Park, J. Almer, S. Bhattacharya, A. M. Yacout and K. Mo, Scr. Mater., 2017, 131, 29–32 CrossRef CAS
- C. M. Kapadia and M. H. Leipold, The mechanism of grain growth in ceramics, Report No.: NASA-CR-135719, Kentucky University, Lexington, 1972, pp. 1–51, http://ntrs.nasa.gov/archive/nasa/casi.ntrs.nasa.gov/19730023733.pdf Search PubMed
- H.-J. Matzke, J. Chem. Soc., Faraday Trans., 1990, 86, 1243–1256 RSC
- T. Yao, K. Mo, D. Yun, S. Nanda, A. M. Yacout and J. Lian, J. Am. Ceram. Soc., 2017, 100, 2651–2658 CrossRef CAS
- V. Trillaud, R. Podor, S. Gossé, A. Mesbah, N. Dacheux and N. Clavier, J. Eur. Ceram. Soc., 2020, 40, 5891–5899 CrossRef CAS
- J. Manaud, R. Podor, X. F. Le Groff, J. Maynadié, N. Dacheux and N. Clavier, J. Eur. Ceram. Soc., 2021, 41, 6697–6707 CrossRef CAS
- H. Matzke, J. Nucl. Mater., 1983, 114, 121–135 CrossRef CAS
- S. Y. Zhou and D. R. Olander, Surf. Sci., 1984, 136, 82–102 CrossRef CAS
- A. Y. Kupryazhkin, A. N. Zhiganov, D. V. Risovany, K. A. Nekrassov, V. D. Risovany and V. N. Golovanov, J. Nucl. Mater., 2008, 372, 233–238 CrossRef CAS
- T. G. Desai, P. Millett, M. Tonks and D. Wolf, Acta Mater., 2010, 58, 330–339 CrossRef CAS
- A. S. Boyarchenkov, S. I. Potashnikov, K. A. Nekrasov and A. Y. Kupryazhkin, J. Nucl. Mater., 2013, 442, 148–161 CrossRef CAS
- M. N. Rahaman, Ceramic Processing and Sintering, Taylor and Francis, 2nd edn, 2003, p. 602 Search PubMed
- E. Bourasseau, A. Mouret, P. Fantou, X. Iltis and R. C. Belin, J. Nucl. Mater., 2019, 517, 286–295 CrossRef CAS
Footnote |
| † Electronic supplementary information (ESI) available. See DOI: https://doi.org/10.1039/d3ra00487b |
| This journal is © The Royal Society of Chemistry 2023 |