
 Open Access Article
 This Open Access Article is licensed under a Creative Commons Attribution-Non Commercial 3.0 Unported Licence
Back to the future: asymmetrical DπA 2,2′-bipyridine ligands for homoleptic copper(I)-based dyes in dye-sensitised solar cells†
Guglielmo Risi a,
Mike Devereuxb,
Alessandro Prescimonea,
Catherine E. Housecrofta and
Edwin C. Constable*a
a,
Mike Devereuxb,
Alessandro Prescimonea,
Catherine E. Housecrofta and
Edwin C. Constable*a
aDepartment of Chemistry, University of Basel, BPR 1096, Mattenstrasse 24a, 4058 Basel, Switzerland. E-mail: edwin.constable@unibas.ch
bDepartment of Chemistry, University of Basel, Klingelbergstrasse 80, CH-4056 Basel, Switzerland
First published on 31st January 2023
Abstract
Metal complexes used as sensitisers in dye-sensitised solar cells (DSCs) are conventionally constructed using a push–pull strategy with electron-releasing and electron-withdrawing (anchoring) ligands. In a new paradigm we have designed new DπA ligands incorporating diarylaminophenyl donor substituents and phosphonic acid anchoring groups. These new ligands function as organic dyes. For two separate classes of DπA ligands with 2,2′-bipyridine metal-binding domains, the DSCs containing the copper(I) complexes [Cu(DπA)2]+ perform better than the push–pull analogues [Cu(DD)(AA)]+. Furthermore, we have shown for the first time that the complexes [Cu(DπA)2]+ perform better than the organic DπA dye in DSCs. The synthetic studies and the device performances are rationalised with the aid of density functional theory (DFT) and time-dependent DFT (TD-DFT) studies.
Introduction
In recent years, the imperative to replace fossil fuels with alternative and more sustainable, especially carbon-neutral, energy sources has resulted in the evaluation of numerous potential new technologies.1,2 One of the most promising is solar energy conversion based on photovoltaic devices.3,4 A photovoltaic device converts light energy into electrical energy by generating an electron–hole pair upon irradiation. Photovoltaic devices operating in the biosphere are constrained by the light falling upon the surface of the Earth after passage through the atmosphere and typically harvest light in the visible region of the electromagnetic spectrum. Classical photovoltaic materials are semiconductors with a band gap corresponding to energy in the visible region of the spectrum, with silicon as a typical example. Materials with larger band gaps could harvest light in the ultraviolet region but would appear to be excluded from exploiting the visible region of the spectrum. This shortcoming can be addressed by the use of coloured photosensitisers, which possess a ground state lying below the conduction band of the semiconductor and an excited state lying above. The excited state possesses an electron–hole pair and is accessed by the absorption of visible light. In photosensitised devices, the critical separation of the electron and the hole, ultimately leading to the photocurrent, arises from the injection of an electron into the conduction band of the semiconductor.The injection of the electron into the conduction band is facilitated by the covalent binding of the photosensitiser to the surface of the semiconductor. This both optimizes the stability of the device and provides a low-energy pathway for the transport of the electron from photosensitiser to the semiconductor. Functionality used for the covalent binding of the photosensitiser to the surface (anchoring groups) includes carboxylic acids, phosphonic acids, phenols and polyphenols. In addition to the anchoring group, the molecular design of photosensitisers is predicated upon a dipolar species with the negative pole in the direction of the anchoring group. Using these design criteria, three main classes of photosensitisers have been investigated: organic molecules,5–7 metal-containing macrocycles such as porphyrins and phthalocyanines8 and metal complexes. This paper is concerned with investigating a new design paradigm in the latter class of sensitisers.
Photosensitisation of crystalline TiO2 and SnO2 by ruthenium(II) complexes was reported in 1979 (ref. 9) but the potential was first fully developed in 1991 when Grätzel described a dye-sensitised solar cell (DSC) in which semiconductor electrodes, prepared by the sintering of TiO2 (anatase) nanoparticles, were sensitised with a ruthenium(II) complex.10 The use of the sintered nanoparticles resulted in an electrode with a very large surface area which could bind a large amount of the photosensitiser. After the first modest results, there has been a steady improvement in the performance of DSCs containing ruthenium photosensitisers through tuning of the ligands and anchoring groups, the electrolyte and the chemical and electronic structure of the semiconductor. The prototypical ruthenium(II) photosensitisers are six-coordinate and have two 2,2′-bipyridine (bpy) or 1,10-phenanthroline (phen) ligands bearing anchoring groups bound to the metal centre and two ancillary donors which both define the dipole and tune the redox and photophysical properties of the complexes.11 The design principle has been more generally extended to other coordination12 and organometallic13,14 compounds of ruthenium. The incorporation of the dipole within the photosensitiser through ligand design is often described as the “push–pull” strategy in which one ligand is electron-releasing and the other is electron withdrawing. State-of-the-art ruthenium dyes have attained maximum photoconversion efficiencies (PCE) of up to 12% in DSCs.8,15–22 It is argued that metal complexes have inherent advantages over organic photosensitisers as they are likely to exhibit higher thermal and photochemical stability. Nevertheless, the use of ruthenium complexes as photosensitisers has a significant, potentially critical, disadvantage. Ruthenium is present in the Earth's crust in low abundance (ca. 0.001 ppm)23 and is expensive, raising questions about both the sustainability and the commercial viability of the technology. As a consequence, significant effort has been invested in the search for photosensitisers based on other metal centres which would be more sustainable and lower cost.
Design principles for copper photosensitisers
Copper is abundant in the Earth's crust (ca. 50 ppm),23 and copper(I) centres possess a d10 electron configuration and a favoured coordination number of four. Complexes with two ligands containing 2,2′-bipyridine or 1,10-phenanthroline metal-binding domains possess similar photophysical properties to those of ruthenium(II) sensitisers.24 The excited states of these copper(I) complexes possess significant metal-to-ligand charge transfer (MLCT) character with the consequence that the equilibrium geometry of the excited state is changed from four-coordinate tetrahedral to five- or six-coordinate. This imposes the additional constraint in the molecular design of incorporating substituents at the 6,6′-positions of bpy ligands or the 2,9-positions of phen ligands to prevent the flattening of the state geometry, consequently lengthening the excited state lifetime.24–30In 1994, Sauvage and coworkers reported a DSC with a TiO2 photoanode sensitised with a Cu(phen)2+ complex.31 Subsequently, we designed a series of homoleptic copper(I) complexes with bpy ligands containing carboxylic acids as anchoring groups and reported a PCE which corresponds to 23.7% relative to a device with a reference ruthenium(II) dye N719.32 Since then, homoleptic copper(I) complexes have attracted interest with improvements in PCEs by tailored modifications of the ligands.33–35 This type of complex is shown in Scheme 1a. The anchoring ligand is conveniently described as Lanchor and is typically also an electron-withdrawing substituent.
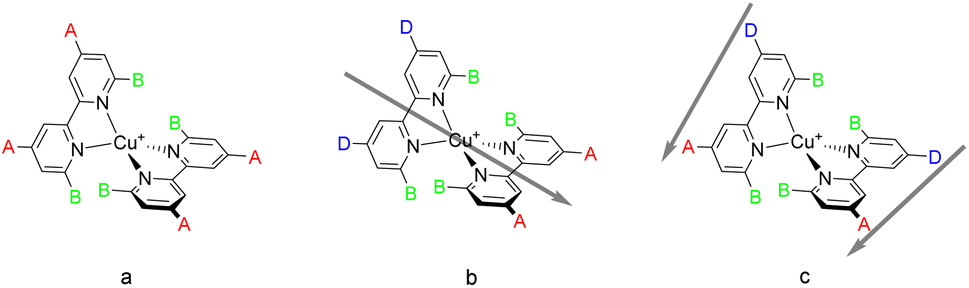 | ||
| Scheme 1 (a) The initial design of a homoleptic copper(I) bpy complex for use in a DSC that incorporates substituents, B, at the 6- and 6′-positions to minimise flattening in the excited state and substituents, A, such as –CO2H which can anchor the complex to the semiconductor surface; (b) heteroleptic complexes incorporating one anchoring ligand with an electron-withdrawing substituent and an ancillary ligand with electron-releasing substituents, D, exhibits the push–pull architecture with the direction of electron flow indicated by the bold arrow; (c) the [Cu(DπA)2]+ homoleptic design with the direction of electron flow again indicated by the bold arrow. | ||
Heteroleptic complexes of the type [Cu(Lanchor)(Lancillary)]+ in which the second, ancillary, ligand, Lancillary is electron-releasing (Scheme 1b) possess the push–pull architecture expected to improve the electron injunction into the conduction band of the semiconductor.24 Copper(I) complexes are labile and attempts to isolate homoleptic [Cu(Lanchor)(Lancillary)]+ complexes typically lead to a statistical mixture of [Cu(Lanchor)(Lancillary)]+, [Cu(Lanchor)2]+ and [Cu(Lancillary)2]+. Elegant strategies have been developed to isolate heteroleptic complexes including the HETPHEN36,37 approach developed by Schmittel in which bulky substituents direct the preferential formation of a heteroleptic complex.38–40 We have introduced the SALSAC approach,24,41 based on the stepwise assembly of heteroleptic copper(I) complexes by immobilising Lanchor on the semiconductor, followed by formation of the heteroleptic complex as a surface-bound species. These approaches have allowed the evaluation of a wide range of Lanchor and Lancillary combinations to be evaluated.42–54
Chemisorption on the photoanode of a DSC does not completely prevent the dissociation of Lancillary and this phenomenon contributes to deterioration of device performance following prolonged contact with the electrolyte, a phenomenon described as ‘bleaching’.55–58
In this paper we describe a new strategy for the design of push–pull complexes to address these issues. Instead of using heteroleptic complexes with two different ligands containing electron-withdrawing and electron-accepting (anchoring) ligands respectively, we considered a single asymmetrical ligand type bearing both electron-withdrawing (donor) and electron-accepting (acceptor) substituents (Scheme 1c). We describe this as a donor–π–bridge–acceptor (DπA) architecture. This strategy has been little investigated and has not delivered convincing results to date.59–61 We also note that the DπA ligands themselves possess the characteristics of a purely organic photosensitiser and it is instructive to compare the performance of the ligand as an organic dye sensitiser with that of the homoleptic [Cu(DπA)2]+ complexes.
The core of our investigation was the comparison of [Cu(Lanchor)(Lancillary)]+ complexes with their isotopic [Cu(DπA)2]+ congeners. Thus, the ligands 3 and 6 were designed as the DπA partners for the Lanchor and Lancillary pairs 1 and 2, or 4 and 5, respectively (top panel, Scheme 2). The complexes [Cu(3)(3–H)] and [Cu(6)(6–H)] were compared with the heteroleptic push–pull [Cu(1)(2)]+ and [Cu(4)(5)]+, respectively (bottom panel, Scheme 2). The photophysical and electrochemical properties of the compounds and the DSC performances of devices were studied, complemented by DFT and TD-DFT calculations.
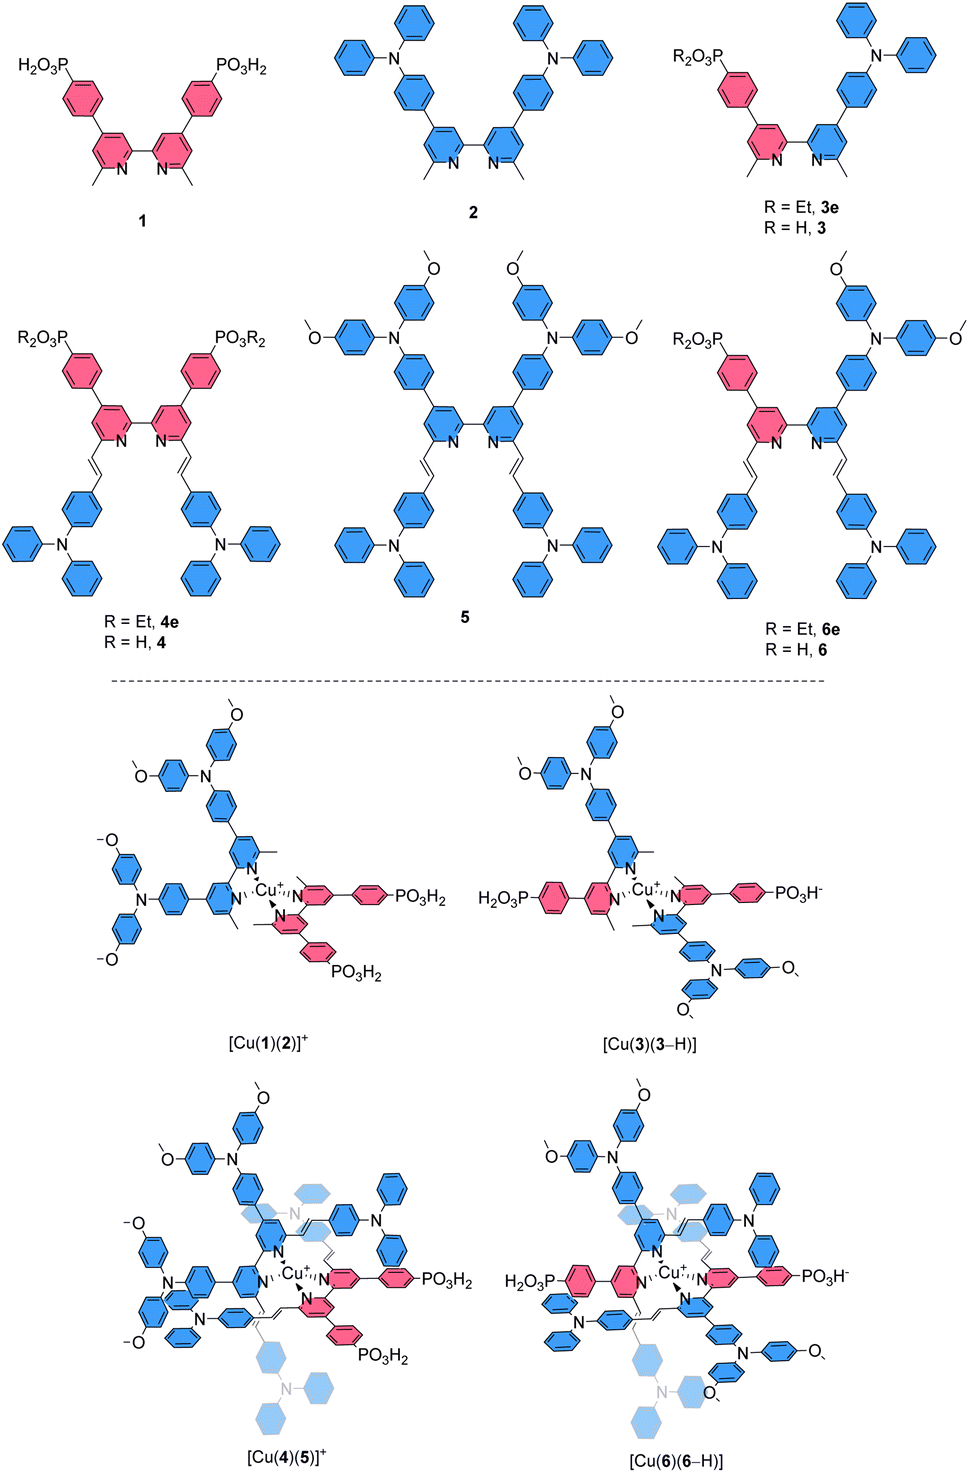 | ||
| Scheme 2 Ligands used in this study (top) and employed for the isolation of copper(I) complexes and assembly of dyes in [Cu(Lanchor)(Lancillary)]+ and [Cu(DπA)2]+ design and the copper(I) dyes investigated (bottom). | ||
Experimental
Syntheses and characterisations
Details of syntheses, 1H, 13C{1H}, and 31P{1H} NMR spectra (Fig. S1–S45†) and assignments, IR spectroscopic data (Fig. S46–S60†), high resolution mass spectrometric data (Fig. S61–S75†), are given in the ESI.†Materials and methods
1H, 13C{1H} and 31P{1H} NMR spectra were performed on a Bruker Avance III-500 spectrometer equipped with a BBFO probehead at 298 K and a Bruker Avance III HD four-channel NMR spectrometer (operating at 600.13 MHz proton frequency). The DOSY experiments were performed on the latter; the instrument was equipped with a cryogenic 5 mm four-channel QCI probe (H/C/N/F) with self-shielded z-gradient. The experiments were performed at 298 K and the temperature was calibrated using a methanol standard showing accuracy within ±0.2 K. For the PFGSE (pulsed field gradient spin echo) diffusion experiment, the sample was placed in a 3 mm outer diameter tube and the 3 mm tube was then inserted in a standard 5 mm round bottom tube and securely kept in place by a simple home-made device. This setup ensured a negligible temperature gradient on the sample even inside a cryogenic probe. The PFGSE experiments were performed using a longitudinal encoded-decoded bipolar gradient pulse sequence with two spoil gradients (ledbpgp2s)62 16 Increments were recorded with 8 scans and the gradient strength was linearly increased from 5 to 95%. The diffusion time was set to 35 ms, a recycling delay of 2 s and an encoding gradient duration of 1.5 ms were applied. The sigmoidal intensity decrease was fitted with a two-parameter fit (I0 and diffusion coefficient D) with the DOSY routine implemented in Topspin 3.5 (Bruker Biospin GmbH, 2017). A Bruker maXis 4G QTOF instrument and a Bruker Daltonics solariX instrument were used to record HR-ESI and HR-MALDI-ToF-MS mass spectra, respectively. FT-infrared (IR) and absorption spectra were measured using PerkinElmer UATR Two, Agilent Cary-5000 and Shimadzu UV-2600 spectrophotometers, respectively. Melting points were determined using a Büchi Melting Point M-560. Electrochemical measurements were performed using an Ametek VersaSTAT 3F potentiostat with [nBu4N][PF6] (0.1 M) as supporting electrolyte and a scan rate of 0.1 or 0.05 V s−1; the solvent was HPLC grade CH2Cl2 and solution concentrations were ca. 2 × 10⁻³ mol dm−3. The solutions were constantly degassed with argon bubbling. The working electrode was glassy carbon, the reference electrode was a leakless Ag/AgCl (eDAQ ET069-1, filling electrolyte aqueous KCl, conc. 3.4 mol L−1) and the counter-electrode was a platinum wire. Final potentials were internally referenced with respect to the Fc/Fc+ couple. All reactions were carried out with chemicals used as received from Alfa Aesar, Sigma Aldrich, Fluorochem, TCI, or Combi-blocks without further purification.DSC fabrication
FTO/TiO2 electrodes (Solaronix Test Cell Titania Electrodes) were washed with EtOH, heated at 450 °C for 30 min, and then cooled down to rt. The electrodes were immersed in a dye solution for 19 h, after which they were removed, washed with corresponding solvent and allowed to dry; to functionalise electrodes with ligands 3, 4 and 6, 1.0 mM bath solutions were prepared in MeOH, DMSO and CH2Cl2/MeOH (in ratio 4![[thin space (1/6-em)]](https://www.rsc.org/images/entities/char_2009.gif) :1), respectively. Likewise, with dyes [Cu(3)(3–H)] and [Cu(6)(6–H)], the bath solutions were prepared in MeOH and CH2Cl2/MeOH (in ratio 4:1), respectively. To assemble dye [Cu(4)(5)]+, an electrode functionalised with ligand 4, was immersed in a 0.1 mM solution of [Cu(5)2][PF6] for about 72 h. To assemble the homoleptic complexes on surface, a ligand-functionalised electrode was immersed in a CH2Cl2 solution of [Cu(CH3CN)4][PF6] (0.1 mM to assemble the [Cu(DπA)2]+ dyes on surface, 0.01 or 1.0 mM in concentration screening) for 16 h at room temperature, removed, washed with CH2Cl2 and let dry. For solid-state absorption spectroscopy, electrodes were immersed in bath solutions as described above with dipping times of 3–10 minutes each step. For the reference dye N719 (Solaronix), FTO/TiO2 electrodes (Solaronix Test Cell Titania Electrodes) were immersed in a solution of N719 (EtOH, 0.3 mM) for 19 h. Then the electrodes were removed, washed with EtOH and let dry. Counter electrodes (Solaronix Test Cell Platinum Electrodes) were washed with EtOH and then heated at 450 °C for 30 min.
:1), respectively. Likewise, with dyes [Cu(3)(3–H)] and [Cu(6)(6–H)], the bath solutions were prepared in MeOH and CH2Cl2/MeOH (in ratio 4:1), respectively. To assemble dye [Cu(4)(5)]+, an electrode functionalised with ligand 4, was immersed in a 0.1 mM solution of [Cu(5)2][PF6] for about 72 h. To assemble the homoleptic complexes on surface, a ligand-functionalised electrode was immersed in a CH2Cl2 solution of [Cu(CH3CN)4][PF6] (0.1 mM to assemble the [Cu(DπA)2]+ dyes on surface, 0.01 or 1.0 mM in concentration screening) for 16 h at room temperature, removed, washed with CH2Cl2 and let dry. For solid-state absorption spectroscopy, electrodes were immersed in bath solutions as described above with dipping times of 3–10 minutes each step. For the reference dye N719 (Solaronix), FTO/TiO2 electrodes (Solaronix Test Cell Titania Electrodes) were immersed in a solution of N719 (EtOH, 0.3 mM) for 19 h. Then the electrodes were removed, washed with EtOH and let dry. Counter electrodes (Solaronix Test Cell Platinum Electrodes) were washed with EtOH and then heated at 450 °C for 30 min.
The working and counter-electrode for each DSC were joined together using thermoplast hot-melt sealing foil (Solaronix Test Cell Gaskets, 60 μm) and the gap between them was filled with electrolyte (LiI (0.1 M), I2 (0.05 M), 1-methylbenzimidazole (0.5 M), 1-butyl-3-methylimidazolinium iodide (0.6 M) in 3-methoxypropionitrile) by vacuum backfilling through a hole in the counter-electrode. Finally, the hole was sealed (Solaronix Test Cell Sealings and Solaronix Test Cell Caps).
DSC and EQE measurements
The DSCs were all masked before measurements. The mask was made from a black-coloured copper sheet with an accurately calibrated aperture smaller than the surface area of TiO2. Cells were also masked on the top and on the sides using black tape. Performance measurements were made by irradiating the DSC from behind with a LOT Quantum Design LS0811 instrument (LOT-QuantumDesign, 100 mW cm−2 = 1 sun, AM1.5 G conditions) and the simulated light power was calibrated with a silicon reference cell. EQE measurements used a Spe Quest quantum efficiency setup (ReRa Systems) with a 100 W halogen lamp (QTH) and a lambda 300 grating monochromator (LOT-Oriel). The monochromatic light was modulated to 3 Hz using a chopper wheel (ThorLabs Inc.), and the cell response was amplified with a large dynamic range IV converter (Melles Griot) and measured with a SR830 DSP Lock-In amplifier (Stanford Research Systems).Crystallography
Single crystal data were collected on a Bruker APEX-II diffractometer (CuKα radiation) with data reduction, solution and refinement using the programs APEX,63 ShelXT v. 2018/2,64 Olex2,65 and ShelXL v. 2018/3.66 Structure analysis and structural diagrams used the program CSD Mercury 2022.1.0.67C62H44Br2N4, Mr = 1004.83, yellow plate, monoclinic, space group P21/c, a = 6.5334(6), b = 25.031(2), c = 15.1033(13) Å, β = 102.382(3)°, V = 2412.5(4) Å3, Dc = 1.383 g cm−3, T = 150 K, Z = 2, μ(CuKα) = 2.478 mm−1. Total 14983 reflections, 4367 unique (Rint = 0.0246). Refinement of 3963 reflections (307 parameters) with I > 2σ(I) converged at final R1 = 0.0280 (R1 all data = 0.0313), wR2 = 0.0751 (wR2 all data = 0.0776), gof = 1.063. CCDC 2203243.
Results and discussion
Ligand syntheses and characterisation
The synthetic routes to the ligands used in this work are presented in Scheme 3. Ligands 1 and 2 and [Cu(2)2][PF6] were prepared in accordance with the procedures developed previously in our group.42,68 Ligand 3e was synthesised starting from 4,4′-dibromo-6,6′-dimethyl-2,2′-bipyridine (7),42 carrying it through two consecutive steps of Suzuki–Miyaura cross coupling reaction with the boronate ester of the acceptor and boronic acid derivative of the donor units, respectively.69 Compound 3e was deprotected with TMSBr followed by precipitation with Et2O to give the desired phosphonic acid 3 in 79% yield.70 For the preparation of ligands 4, 4e, 5, 6e and 6, a common precursor was identified in 9.68 The latter was reacted in a Knoevenagel reaction with 4-(N,N′-diphenylamino)benzaldehyde to give the dibromo compound 10. Using this as a building block led to the isolation of 4e, 5 and 6e by means of either Pd-catalysed C–P cross coupling reaction or Pd-catalysed aryl amination or a combination of the two. The phosphonic acid analogues were isolated by deprotecting the corresponding esters under the same conditions as with 3. The isolation of all the homoleptic Cu(I) complexes described in this work was achieved by addition of [Cu(CH3CN)4][PF6] in a 1:2 complex:ligand ratio to the reaction mixture, then precipitated following the addition of either Et2O or nhexane.
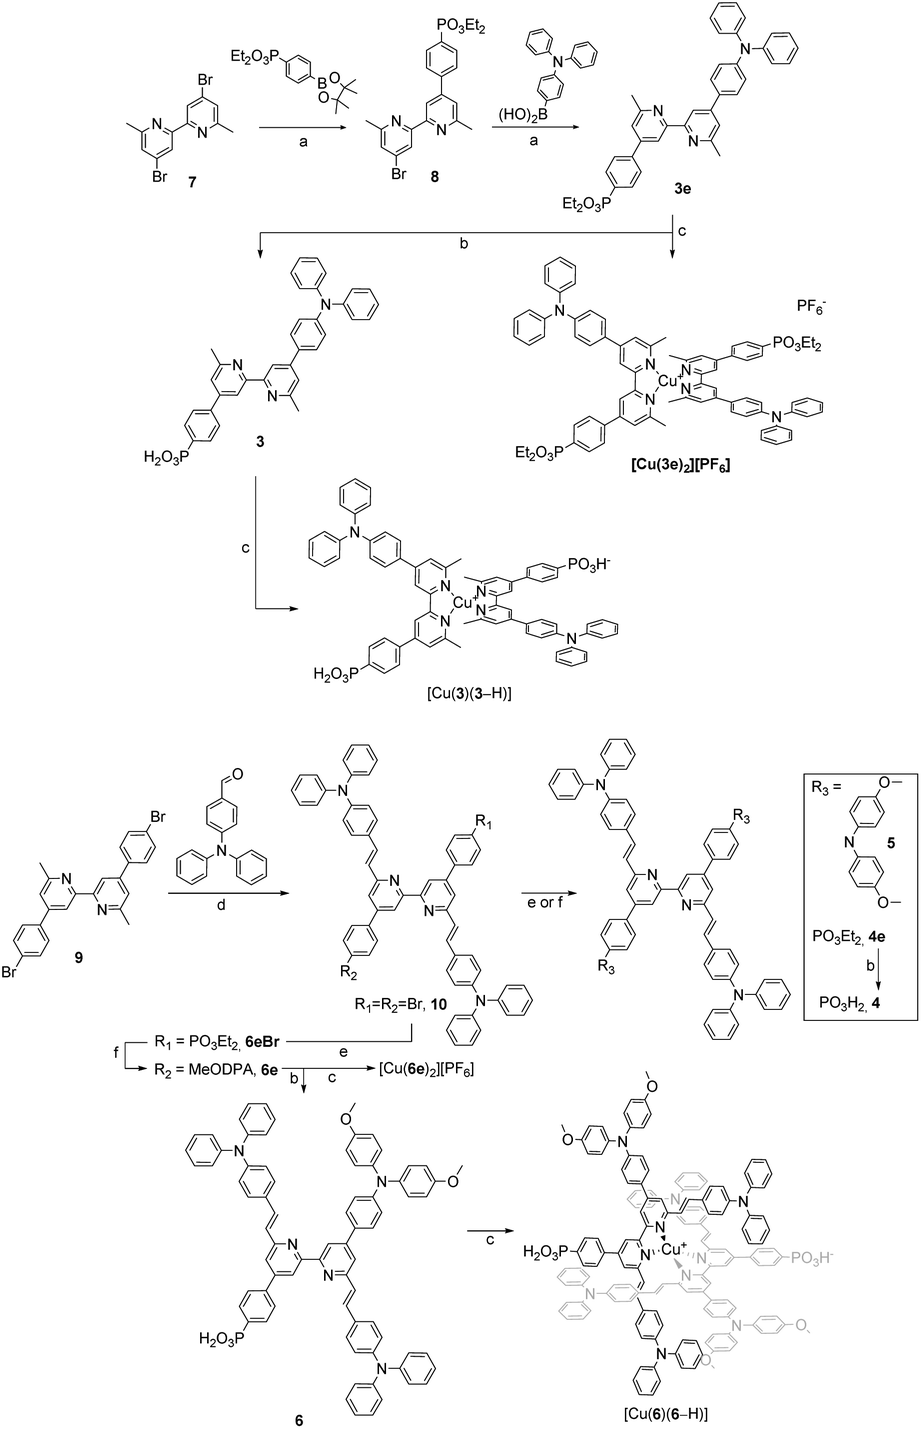 | ||
| Scheme 3 Synthetic routes to ligands and homoleptic copper(I) complexes. (a) Pd(PPh3)4, Na2CO3, Tol/H2O 9:1, 80 °C, on.; (b) TMSBr, CH2Cl2, rt, 3–24 h; (c) [Cu(CH3CN)4][PF6], MeOH or CH2Cl2 or CH2Cl2/MeOH 4:1 or CH2Cl2/CH3CN 1:1, rt, 1–18 h; (d) TMSCl, DMF, 170 °C, 48 h; (e) Pd(dppf)Cl2, Cs2CO3, Et2HPO3, toluene, 110 °C, 15–18 h; (f) Pd(dba)2, RuPhos, tBuONa, 15–18 h, THF or toluene, 90 °C. | ||
Single crystals of 10 were grown by slow evaporation of a CH2Cl2 solution. Yellow plates of 10 crystallise in the monoclinic space group P21/c with half of the molecule present in the asymmetric unit; the second half is generated by inversion (Fig. 1a) and thus, as the pyridine ring is near-planar, the bpy unit is necessarily planar. Selected bond lengths and angles are given in the caption to Fig. 1. The substituents at the alkene unit describe the (E)-stereoisomer, and the arene ring containing C10 is essentially coplanar with the pyridine ring (angle between the least squares planes = 14.0°). However, the conjugated substituents are somewhat ‘bowed’ as illustrated in Fig. 1b. The angle between the planes of the pyridine ring and arene ring containing C4 is 36.0°, consistent with alleviating repulsive H⋯H contacts between the rings.
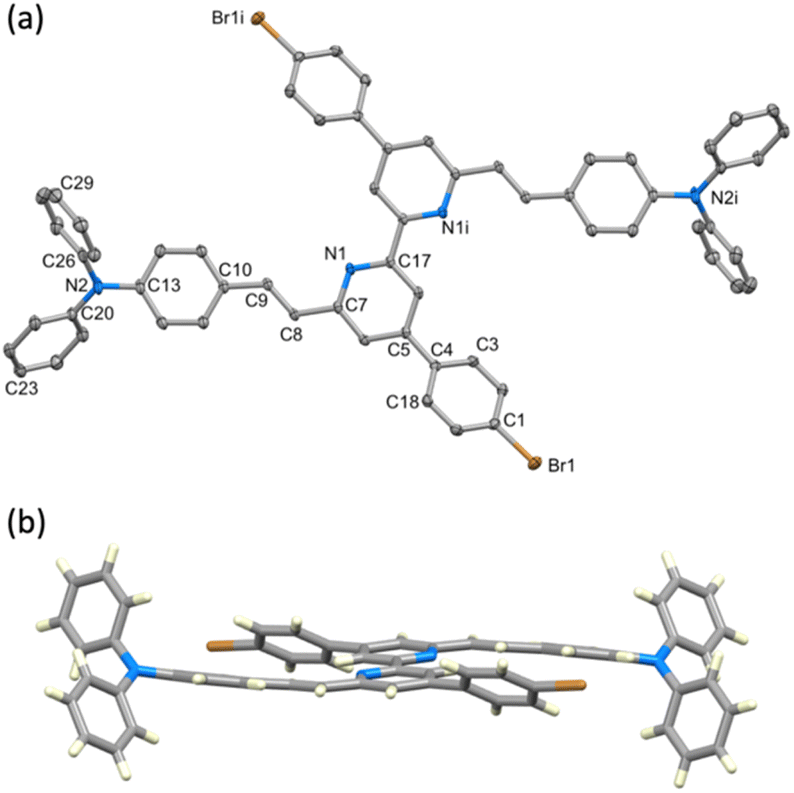 | ||
| Fig. 1 (a) Structure of 10 with H atoms omitted and ellipsoids plotted at a 40% probability level. Symmetry code c = –x, 1 − y, 1 − z. Selected bond parameters: Br1–C1 = 1.8964(17), N1–C17 = 1.341(2), N1–C7 1.348(2), N2–C20 = 1.405(2), N2–C26 = 1.431(2), N2–C13 1.419(2), C7–C8 = 1.475(2), C8–C9 = 1.335(2), C10–C9 = 1.466(2) Å; C20–N2–C26 = 120.63(14), C20–N2–C13 = 121.86(15), C13–N2–C26 = 117.51(14), C9–C8–C7 = 122.65(15), C8–C9–C10 = 127.92(16)°. (b) View of the structure of 10 showing the ‘bowing’ of the conjugated substituents. | ||
Most compounds were obtained in yields of around 60%, with the exception of 10 (31%) and 5 (90%). The steric hindrance of the 6,6′-substituted 2,2′-bipyridine systems reduces the N–HOSi bonding interactions between the pyridine rings and silica particles, making the purification by column chromatography a viable option in the case of ligands 4e, 5 and 6e. Note that the presence of a phosphonate ester is the cause of loss of material because of the bonding interactions (following hydrolysis of the ester) between the phosphonic acid groups and the silica. The phosphonic acid derivatives were used after precipitation without further purification. However, for the phosphonic acids and their copper(I) complexes, it was not possible to obtain satisfactory elemental analysis. The 31P NMR spectra of the phosphonate esters 3e and 6e (δ = 17.9 and 18.3 ppm, respectively) exhibited an upfield shift upon deprotection (δ = 14.9 and 11.9 ppm, respectively). Similar shifts are seen on comparing the complexes of the phosphonate esters to those of the phosphonic acids (see the Experimental section in ESI†). In the copper(I) complexes of ligands 3 and 6, the absence of the PF6− anion was verified, thus indicating that at least one proton has been lost from the phosphonic acid substituents, negating the need for an anion. With no further evidence, we assumed one of the two phosphonic acid to be deprotonated (with the ligands this referred to as [3–H]− and [6–H]−) and the copper(I) complexes to be zwitterions (i.e. [Cu(3)(3–H)] and [Cu(6)(6–H)]). Furthermore, a low stability of the complexes in solution was observed after their isolation, and after one week, the 1H NMR spectra showed broadening and loss of resolution of the signals. We did not conduct time stability studies in this work. Instead, we based the photophysical and electrochemical characterisation of the compounds on their ester analogues given their long-term stability in solution. The 1H and 13C{1H} NMR spectra of all compounds were assigned using two-dimensional (2D) methods. It is interesting to analyse the nature of 6e from the 1H NMR spectrum as representative of the asymmetrical ligands (Fig. 2): the presence of a donor group and an acceptor group breaks the symmetry of the molecule, generating a larger number of signals. The comparison of peaks with spectra of ligands 4e and 5, reveals the presence of two patterns compatible with those of these ancillary and anchoring ligands.
 | ||
| Fig. 2 Comparison of room temperature 1H NMR spectra of 5, 6e and 4e. Solvent: CDCl3. Assignments in 6e of signals generated by desymmetrisation are consistent with an approximate combination of the observed for ligands 4e and 5. | ||
The chemical shifts of protons in pyridine rings B and C are well separated (HB3 and HC3, HB5 and HC5), with the ring C signals shifted downfield. The same is true for 13C NMR assignments in 6e, where the signals of ring C are shifted downfield with respect to ring B (see the Experimental section in ESI†). The same is found in the case of ligand 3e and similar conclusions are drawn for all asymmetric ligands and their complexes described in this work. The differences in the chemical environments between the moieties in the 2,2′-bipyridine scaffold are consistent with the asymmetry, leading to a chemical shift distribution oriented from the donor (downfield) through the acceptor unit (upfield). The full assignment for the 6,6′-substituents of the asymmetric 2,2′-bipyridine ligands and corresponding copper(I) complexes could not be made unambiguously; whereas the alkenyl protons could be assigned in most cases, the TPA units found in 3e, 6e and derivatives experience a similar chemical environment, resulting in not unequivocal signal assignment. The deprotection of the esters was easily confirmed by the disappearance of the HEt-CH2 and HEt-CH3 signals.
The NMR assignments for the ligands can be compared to their homoleptic copper(I) complexes [Cu(3)(3–H)] and [Cu(6)(6–H)] and their ester counterparts. The 1H and 13C{1H} NMR assignments indicate that the electron density distribution within the 2,2′-bipyridine is nonuniform and oriented from the donor through the acceptor unit. Additionally, L and L–H cannot be distinguished due to fast proton exchange. In turn, it implies that the new copper(I) complexes preserve the chemical environment of the ligands when engaged in coordination to the metal, regardless of the conformational change of the bpy domain from transoid to cisoid.
During the isolation of [Cu(6)(6–H)], we observed the presence of another species present in solution (Fig. 3). Some signals (δ = 7.87 ppm, δ = 7.35 ppm, and δ = 7.1 ppm) can be ascribed to a species compatible with the free ligand in solution. We were, therefore, interested in investigating the ligand-complex binding dynamics in solution in order to assess how the bulky chelating site found in the phosphonic esters and acids affects the binding equilibria during complexation.
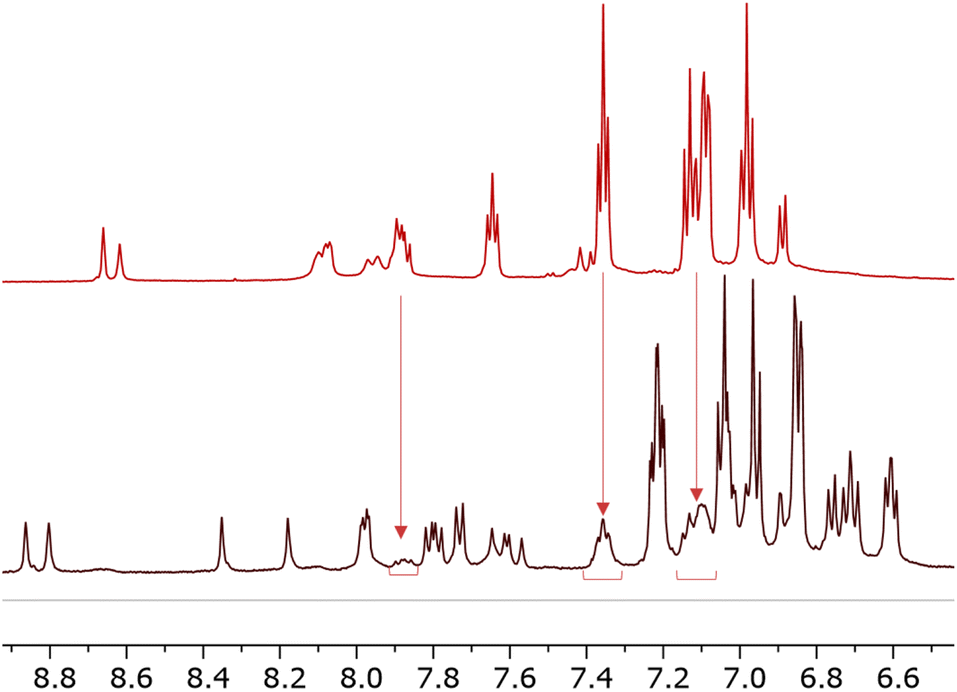 | ||
| Fig. 3 Comparison of 1H NMR spectra 6 (top) and [Cu(6)(6–H)] (bottom). Solvent: DMSO-d6. The spectrum of [Cu(6)(6–H)] reveals a second pattern of peaks of low intensity compatible with that of 6. | ||
For this purpose, we conducted DOSY experiments in CD2Cl2 for solutions containing ancillary ligand 5 and [Cu(CH3CN)4][PF6] as copper(I) source (Table S1†). Diffusion coefficients of 5.037 × 10⁻¹⁰ m2 s−1 and 4.466 × 10⁻¹⁰ m2 s−1 were found for 5 and [Cu(5)2]+ (1:0.5 ligand to copper ratio), respectively, resulting in a slower diffusion for the homoleptic complex. As anticipated, the nature of CuL2 was clarified by comparing the hydrodynamic radii of the two species (≈42% larger volume for [Cu(5)2]+ as compared to 5 assuming ideal spheres without a solvation shell). We screened two additional combinations of ligand and [Cu(CH3CN)4][PF6], namely 1:1 and 1:2 ratios. In both cases, [Cu(5)2]+ was the predominant species in solution with an essentially constant diffusion coefficient (D = 4.455 × 10⁻¹⁰ m2 s−1 and 4.525 × 10⁻¹⁰ m2 s−1, respectively). Additionally, we could identify a species with D = 4.929 × 10⁻¹⁰ m2 s−1 compatible with [CuL]+ and with only ≈7% volume excess with respect to 5. This not only confirms the solution stability of [Cu(5)2]+ at high molar ratios of copper(I), but also confirms that, in spite of the bulky substituents of 2,2′-bipyridine ligands, the formation of the homoleptic complexes occurs.
Photophysical and electrochemical properties
Solution absorption spectra of the compounds measured in CH2Cl2 are illustrated in Fig. 4 and an energy level diagram determined from a combination of photophysical and electrochemical data (Table 1) is presented in Fig. 5. The extended conjugation in alkenyl-TPA-decorated ligands 4e, 5 and 6e shifts the absorption maxima to longer wavelength (401, 385 and 391 nm respectively), with respect to ligand 3e with λmax of 353 nm. The λonset follows a similar trend with 4e, 5, 6e, (446, 440 and 439 nm, respectively) and 3e (393 nm). The effect of the alkenyl-TPA donors is tangible when 3e is compared to 6e, producing a bathochromic shift about 40 nm.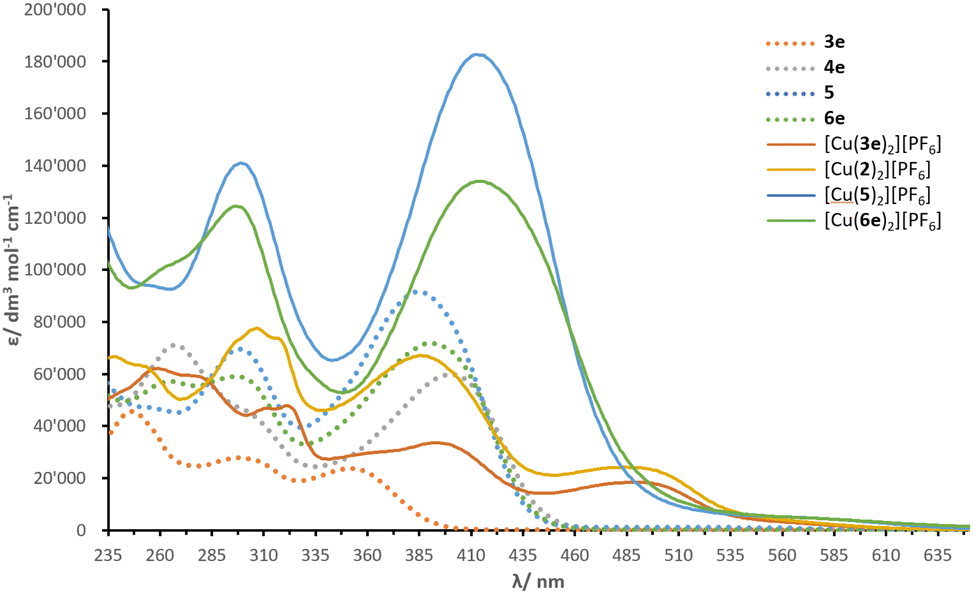 | ||
| Fig. 4 Solution absorption spectra of investigated compounds (CH2Cl2, 10−5 mol dm−3, 6 × 10⁻⁶ mol dm−3 for [Cu(2)2][PF6]). | ||
| vs. NHE | Epa/V | Epc/V | λmax/nm (ε/dm3 mol−1 cm−1) | λonset/nm | EHOMO/eV | ELUMOb/eV | Eoptga/eV |
|---|---|---|---|---|---|---|---|
| a Obtained using formula Eoptg = 1240/λonset.b Calculated subtracting Eoptg to EHOMO. | |||||||
| 3e | +1.23 | +1.13 | 246 (45650); 298 (27840); 353 (23740) |
393 | 1.23 | −1.93 | 3.16 |
| 4 | +0.96 | +0.90 | 267 (71150); 401 (59850) |
446 | 0.96 | −1.82 | 2.78 |
| 5 | +0.95 | — | 298 (69600); 385 (91570) |
439 | 0.95 | −1.87 | 2.82 |
| 6e | +0.92 | — | 265 (57240); 296 (59080); 391 (71880) |
440 | 0.92 | −1.90 | 2.82 |
| [Cu(3e)2][PF6] | +1.04 | +0.92 | 259 (62130); 321 (47890); 494 (33630) |
545 | 1.04 | −1.23 | 2.27 |
| [Cu(2)2][PF6] | +1.03 | — | 310 (57223); 360 (49511); 492 (16801) |
546 | 1.03 | −1.24 | 2.27 |
| [Cu(5)2][PF6] | +0.87 | — | 299 (141040); 413 (141040) |
487 | 0.87 | −1.68 | 2.55 |
| [Cu(6e)2][PF6] | +1.03 | +0.98 | 297 (124240); 414 (134030) |
495 | 1.03 | −1.48 | 2.51 |
 | ||
| Fig. 5 Energy level diagram of ligands and complexes according to EHOMO and ELUMO found in Table 1. | ||
The phosphonate esters and N,N-bis(4-methoxyphenyl)phenylamine (MeOTPA) substituents in 4e, 5 and 6e do not appear to have a significant impact on the low energy band, with a distribution of λmax values within a range of 15 nm. Instead, the second lowest energy band is more affected: ligand 4e (with phosphonate esters) presents a λmax of 267 nm compared to 298 nm in ligand 5 (with MeOTPA). Ligand 6e features a band with two peaks centred at 265 and 296 nm (combination of phosphonate ester and MeOTPA substituents, respectively). In addition, an increase in ε is noticed in ligand 5 as the number of MeOTPA groups is doubled. The high energy bands are attributed to the π* ← π transitions, while the most red-shifted are ascribed to intra-ligand charge transfer (ILCT) between the TPA groups and the bpy domain.
Upon coordination of ligands 3e, 5 and 6e to copper(I), the absorption maxima of [Cu(3e)2][PF6], [Cu(5)2][PF6] and [Cu(6e)2][PF6] undergo a significant red-shift. This is rationalised with the interaction between electrons of the metal d-manifold and the ligand π-system, resulting in a more electron-rich system, in turn reducing the HOMO–LUMO gap. The complexes have the following λmax in decreasing order: 494 ≥ 492 > 414 ≥ 413 nm for [Cu(3e)2][PF6], [Cu(2)2][PF6], [Cu(6e)2][PF6] and [Cu(5)2][PF6], respectively. In the spectra of [Cu(3e)2][PF6], [Cu(2)2][PF6], these absorptions are attributed to the MLCT transitions. Whereas for [Cu(6e)2][PF6] and [Cu(5)2][PF6], the lowest energy band appears as an extension towards higher wavelengths of the ILCT bands found in spectra of 6e and 5. It is not possible to unambiguously ascribe the lowest energy transitions to either ILCT or MLCT, thus a contribution of both is likely; this was followed by an investigation with TD-DFT calculations (see later subsection).
The values of λonset present a similar trend to that seen with λmax, with 546, 545, 495 and 487 nm for [Cu(2)2][PF6], [Cu(3e)2][PF6], [Cu(6e)2][PF6] and [Cu(5)2][PF6], respectively. However, in comparison to ligands 3e, 5 and 6e, the complexes exhibit an opposite trend. In fact, with a red-shift of λmax ≈ 141 nm, ligand 3e dominates over the increase in λmax when ligands 5 and 6e are coordinated to copper(I) (Δλ ≈ 28 and 23 nm for [Cu(5)2][PF6] and [Cu(6e)2][PF6], respectively). This can be rationalised in terms of the steric hindrance induced by the ligands around the metal centre: the methyl groups in 3e allow a partial distortion of the complex which is closer to that typical of copper(II), decreasing the MLCT energy and causing a red-shift, whereas the alkenyl-TPA groups in ligands 5 and 6e entangle the metal in a constrained geometry.
The electrochemical behaviour of ligands and complexes was investigated by cyclic voltammetry in CH2Cl2 with 0.1 mol dm−3 [nBu4N][PF6] as supporting electrolyte. The cyclic voltammograms are summarised in Fig. S76.† All were referenced to the Fc/Fc+ redox couple, and then all the values transposed against NHE.71 Ligands 4e, 5 and 6e show multiple forward irreversible oxidations. The complex pattern of the voltammograms follows from the structure of the ligands. The presence of aromatic amines (easily subjected to oxidation) may be source of subsequent chemical transformations, modifying the electrochemistry of the compound and hampering the its reversibility (ECE processes). The copper(I) complexes also present a pattern of multiple irreversible oxidation processes. This is consistent with that observed for the ligands, which are an integral part of the complexes. For these reasons, we based our analysis exclusively on Epa of the first forward oxidations. Ligands 4e, 5 and 6e present similar Epa values of +0.96, +0.95 and +0.92 V, while 3e shows a more positive Epa of +1.23 V. This difference is attributable to the alkenyl-TPA-substituted bpys bearing multiple electrondonating amine. Overall, alkenyl-TPA groups play an important role in the electrochemical properties of ligands 4e, 5 and 6e, whereas the 4,4′-phenylene substituents do not seem to have a significant effect.
The complexes show positive Epa values of +1.04, +1.03, +1.03, +0.87 V for [Cu(3e)2][PF6], [Cu(2)2][PF6], [Cu(6e)2][PF6] and [Cu(5)2][PF6] respectively.
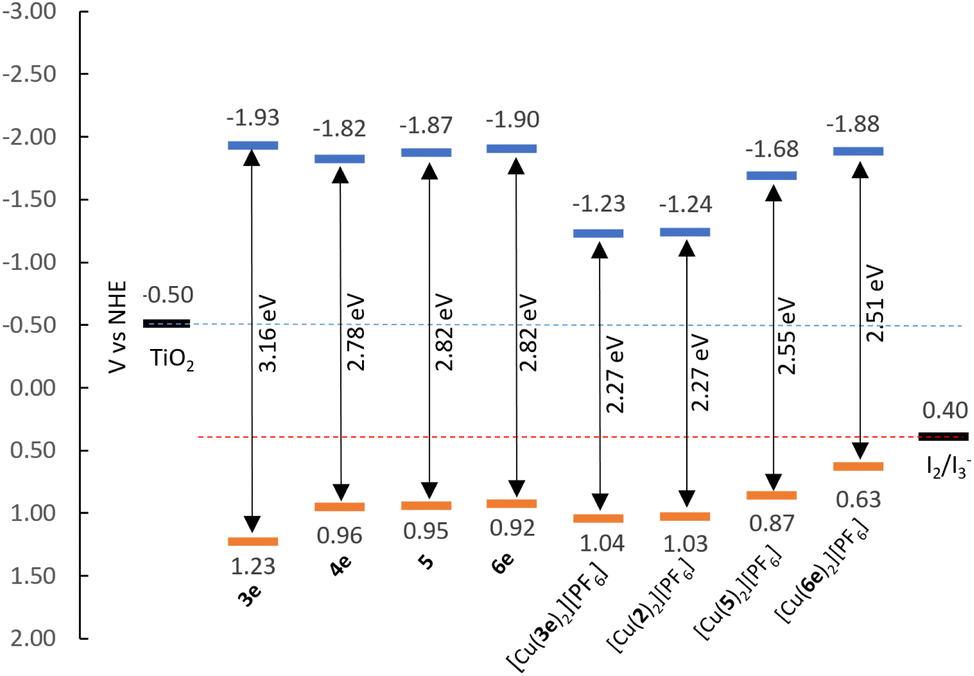
Assuming the Epa for the first oxidation is representative of the HOMO levels of the compounds, we can derive the LUMO energies by means of the optical bandgap (Eoptg, by extrapolating the intersecting abscissa from the linear section of the lowest energy band in UV-visible spectra) and assemble the energy diagram displayed in Fig. 5. It is possible to take the [Cu(Lancillary)2]+ homoleptic complex as representative for the properties of corresponding [Cu(Lanchor)(Lancillary)]+ heteroleptic complex; therefore, we considered [Cu(1)(2)]+ and [Cu(4)(5)]+ photophysical and electrochemical properties represented by compounds [Cu(2)2][PF6] and [Cu(5)2][PF6] as extensively seen in the literature.72
The EHOMO of compounds 3e, 4, 6e, [Cu(2)2][PF6], [Cu(3e)2][PF6], [Cu(6e)2][PF6] and [Cu(5)2][PF6] show values between 0.87–1.23 eV, below the redox potential of the I2/I3− (≈+0.40 eV vs. NHE73), thus, indicating a good driving force for the regeneration of the dyes. The ELUMO are more negative than the redox potential of TiO2 (≈−0.50 eV vs. NHE73), being beneficial for the electron injection. These observations suggest that these new dyes are good candidates for applications in DSC devices.
The Eoptg values of the ligands range from 2.78 to 3.16 eV, whereas the complexes display values between 2.27 and 2.55 eV. In general, this can be explained as the result of both destabilisation of the HOMO and stabilisation of the LUMO occurring upon coordination of the ligands to copper(I). Exception is made for ligand 6e, where the complexation stabilises both the HOMO and LUMO energies (Table 1, from +0.92 and −1.90 eV to +1.03 and −1.48 eV for EHOMO and ELUMO of 6e and [Cu(6e)2][PF6], respectively).
DFT calculations
The character of the MOs in [Cu(Lanchor)(Lancillary)]+ and [Cu(DπA)2]+ dye architectures was investigated by means of DFT calculations with Spartan software.74 To provide a consistent comparison with the [Cu(Lanchor)(Lancillary)]+ complexes, [Cu(3)2]+ and [Cu(6)2]+ were studied in place of [Cu(3)(3−H)] and [Cu(6)(6−H)].The structures were minimised at MM2 level and this geometry was used as the input for a single point DFT calculation (B3LYP 6-31G* basis set level with polar solvent) to determine the orbital distributions. Ligands 3 and 6 exhibit analogous HOMO and LUMO characteristics (Fig. S77†): the HOMO is localised on the TPA and the MeOTPA units, reaching the vicinal pyridine ring. Both LUMOs extend through the bpy domain to the phosphonic acid, which is beneficial for the anchor character of the dyes. This MO distribution is in line with the chemical environment found in NMR analysis of ligands 3 and 6 and consistent with the architecture of DπA dyes. An inspection of the HOMO-manifold of 6 reveals orbitals distributed over the alkenyl-TPA units. The symmetry in [Cu(3)2]+ and [Cu(6)2]+ was found to affect the energies of the MOs, delivering pairs of degenerate orbitals at the beginning of both manifolds (Table S2†). The HOMO/HOMO−1 are centred on the metal in both complexes. The degenerate HOMO/HOMO−1 of [Cu(6)2]+ show equal contributions from the MeOTPA groups from both ligands besides that of the metal (Fig. 6c and d). The HOMO/HOMO−1 of [Cu(4)(5)]+, likewise degenerate, with both MeOTPA from 5 taking part to the delocalisation (Fig. 6g and h). The donor contribution of alkenyl-TPA units is found in [Cu(4)(5)]+ and [Cu(6)2]+ in the lower HOMO-manifold (Fig. S78†). In LUMO/LUMO+1 orbitals of [Cu(4)(5)]+ and [Cu(6)2]+ a neat difference between the two complex architectures is found. The LUMO/LUMO+1 in [Cu(4)(5)]+ are non-degenerate: whereas the LUMO is fully localised over the bpy domain and the acceptor groups of Lanchor 4, the LUMO+1 is limited to the bpy domain of Lancillary 5 (Fig. 6e). The [Cu(6)2]+ LUMO/LUMO+1 are degenerate orbitals, instead, each of which is delocalised between the bpy domain and the phosphonic acid (Fig. 6a and b). The same conclusions can be made assessing both [Cu(3)2]+ and [Cu(1)(2)]+ MOs. This may be detrimental for transitions to LUMO+1 (devoid of anchor character) in ‘push–pull’ architecture, in contrast with [Cu(DπA)2]+ architecture where the LUMO/LUMO+1 degeneracy makes it possible to deliver electron injection from both orbitals.
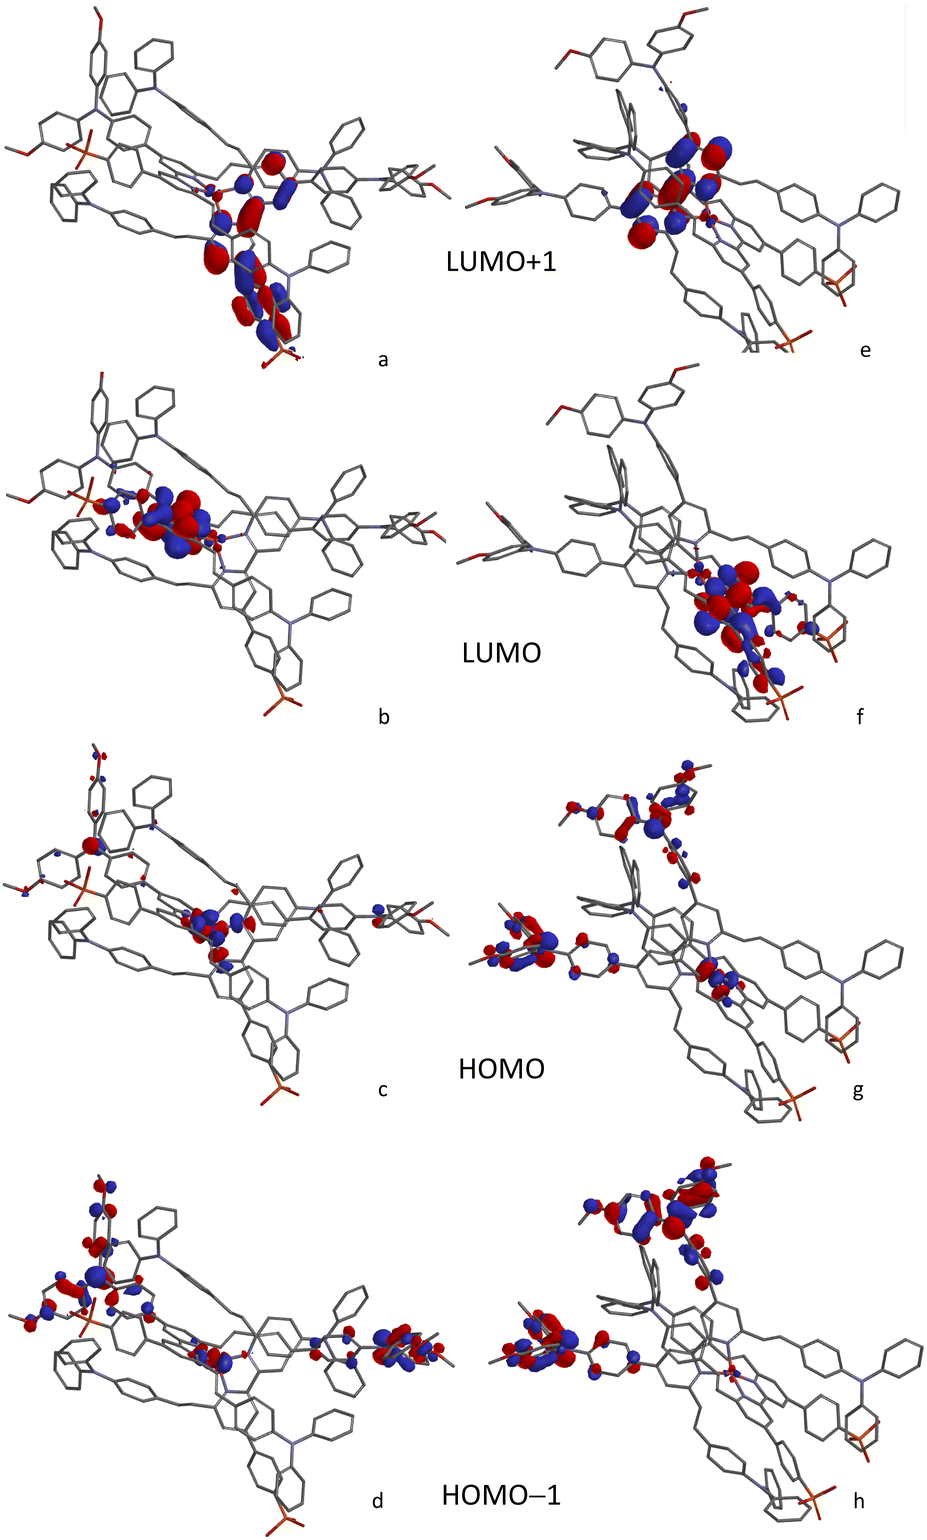 | ||
| Fig. 6 Character of MOs from LUMO+1 to HOMO−1 for [Cu(6)2]+ (left column, (a–d) and [Cu(4)(5)]+ (right column, (e–h) calculated at a DFT level 6-31G* basis set in polar solvent. | ||
TD-DFT calculations
TD-DFT calculations were carried out to gain insight into the nature of the notably different UV-visible spectra of [Cu(3e)2]+ and [Cu(6e)2]+ visible in Fig. 4. The Gaussian 16 software suite75 was used at the B3LYP/6-311+G(2d,p) level of theory,76,77 found to be reliable for related complexes in recent work.78 Geometry optimisations in the presence of a polarisable continuum solvent model79 for dichloromethane (ε = 8.93) were followed by TD-DFT calculations for the first 25 singlet excitations of each complex. Natural Transition Orbitals80 (NTOs) were generated to visualise and characterise the electronic excitations of interest. Fig. 7 shows that [Cu(3e)2]+ exhibits a strong red-shifted transition at ca. 519 nm, in agreement with the measured data, that the lower panel of Fig. 7 shows arises from MLCT to the adjacent bpy domains of both coordinated ligands. In contrast, Fig. 8 for [Cu(6e)2]+ demonstrates that multiple transitions comprise a broad absorption band starting around 500 nm, in qualitative agreement with the measured data. While a single transition at ca. 538 nm of reasonable intensity is visibly red-shifted, its intensity is lower than the equivalent transition in [Cu(3e)2]+ and its character is primarily ILCT. Examination of the strongest transitions between ca. 475 and 500 nm revealed a mixture of primarily ILCT-based absorptions. It should also be noted that the symmetry of [Cu(6e)2]+ is broken by geometry-optimisation, likely due to its increased size and conformational flexibility producing a complex conformational surface. This flexibility will likely lead to further broadening and potential changes in relative energies and intensities of ILCT and MLCT transitions. The TD-DFT results therefore indicate that while [Cu(6e)2]+ provides a relatively simple picture above 500 nm, with a single MLCT transition dominating the spectrum, the larger and more flexible ligands of [Cu(6e)2]+ create a substantially more complex situation in this region with contributions from various ILCT transitions, that are likely also sensitive to conformational change.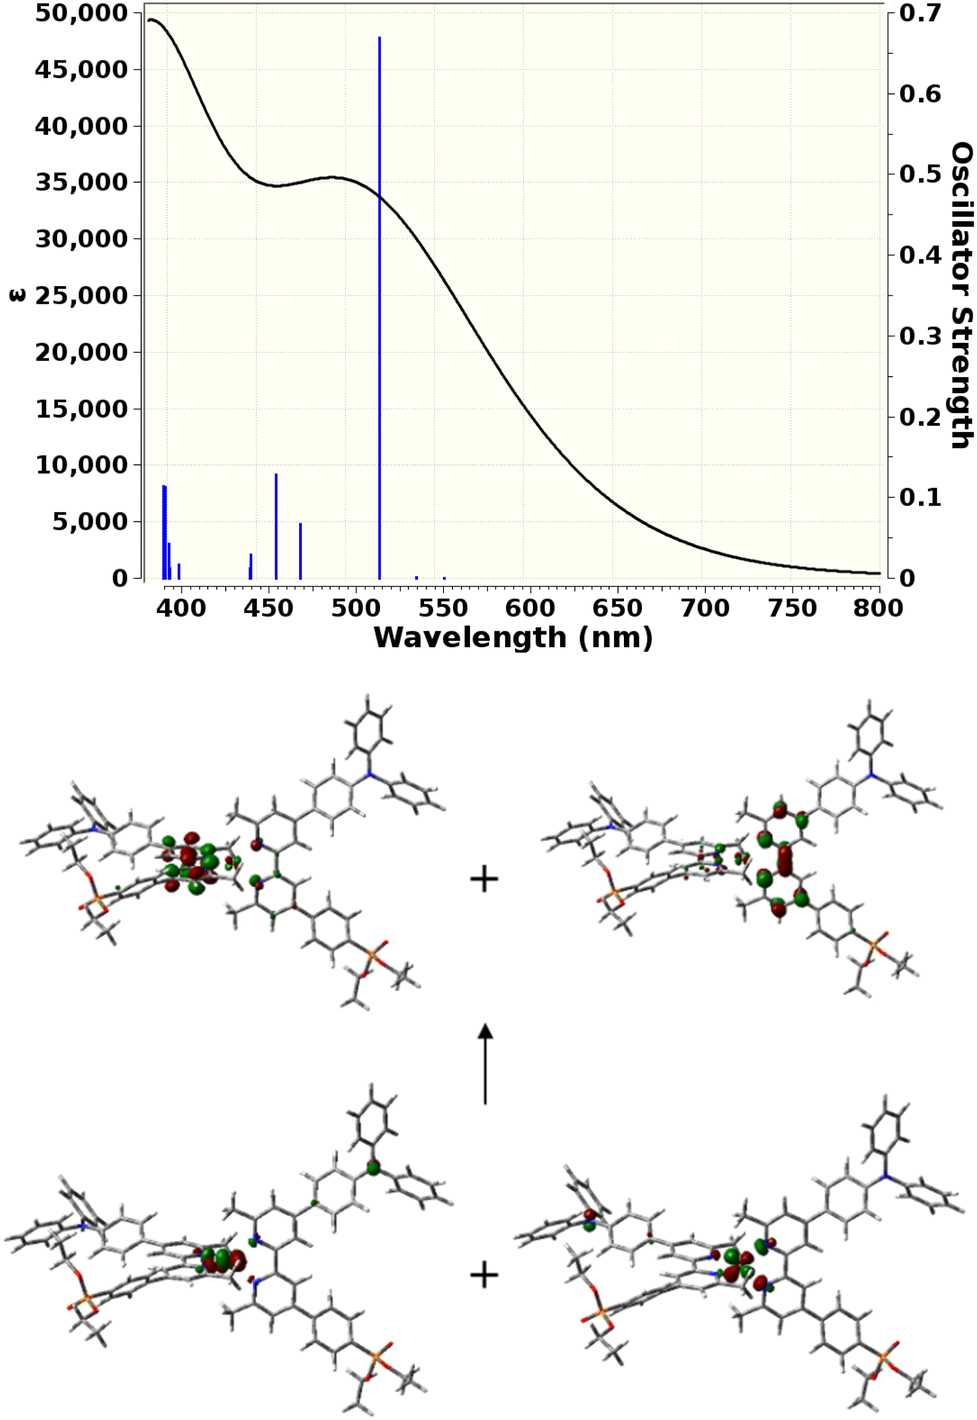 | ||
| Fig. 7 Top: TD-DFT-simulated UV-visible absorption spectrum of [Cu(3e)2]+. Black curve: estimated lineshape including broadening. Blue lines: calculated singlet transitions with corresponding oscillator strengths. Bottom: 0.05 a.u. isocontour surfaces of NTOs that describe the [Cu(3e)2]+ electronic transition at 519 nm. Two symmetry-equivalent donor orbitals (bottom) and two symmetry-equivalent acceptor orbitals (top) fully describe the transition density. | ||
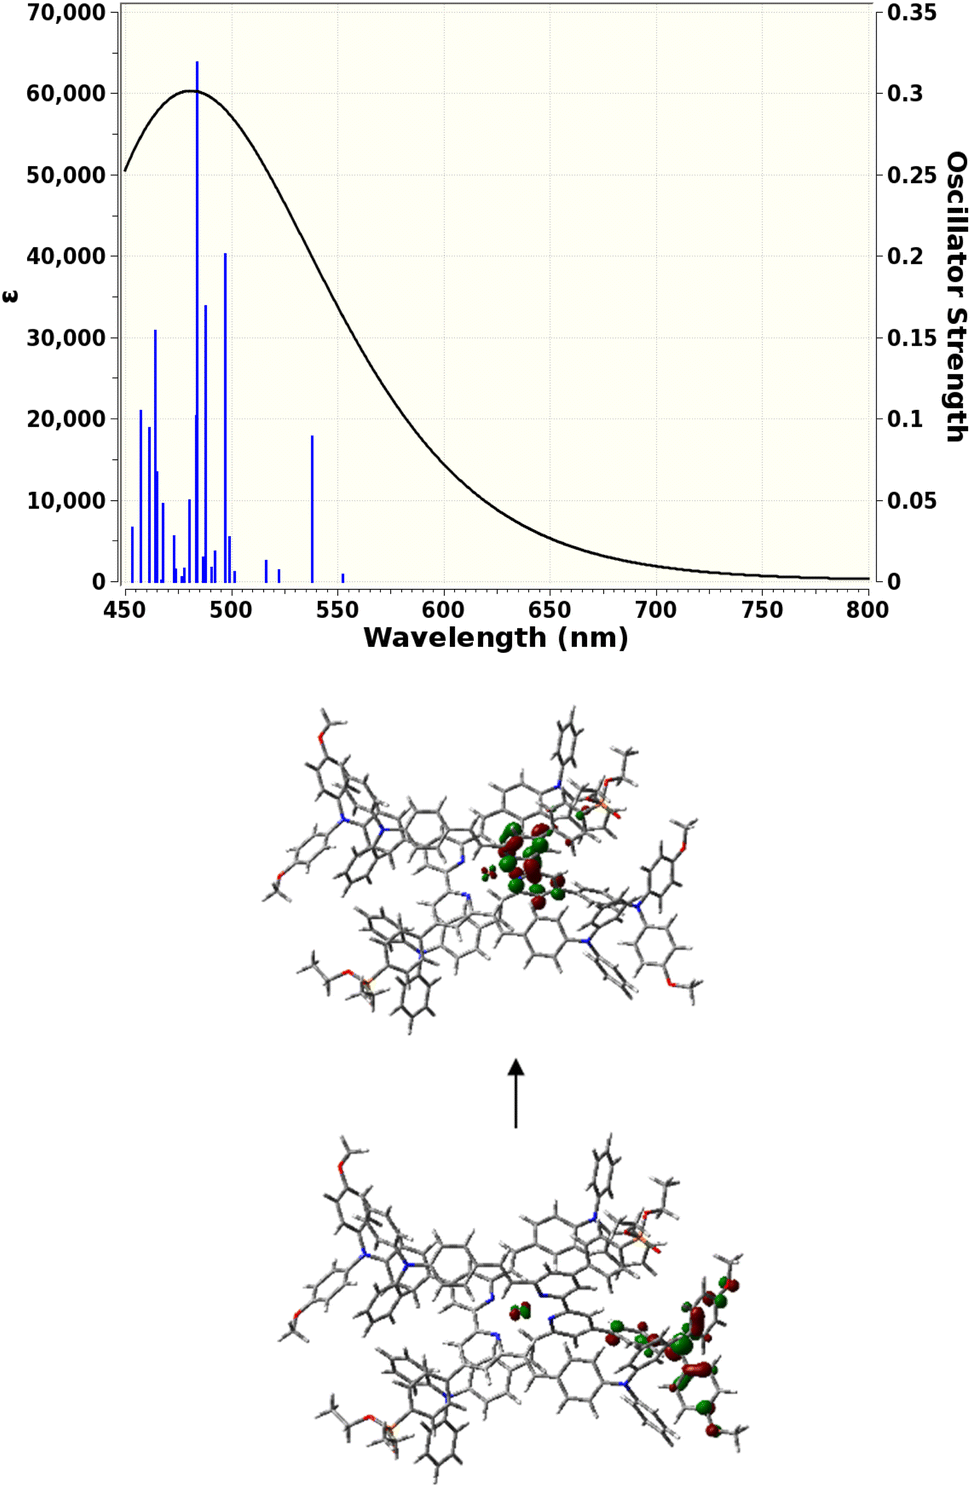 | ||
| Fig. 8 Top: TD-DFT-simulated UV-visible absorption spectrum of [Cu(6e)2]+. Black curve: estimated lineshape including broadening. Blue lines: calculated singlet transitions with corresponding oscillator strengths. Bottom: 0.05 a.u. isocontour surfaces of NTOs that describe the [Cu(6e)2]+ electronic transition at 538 nm. One donor orbital (bottom) and one symmetry-equivalent acceptor orbitals (top) adequately describe the transition density with coefficient 0.94. | ||
Electrode functionalisation and DSC performances
DSCs were built for ligands (3, 4 and 6 as organic dyes), [Cu(DπA)2]+ and [Cu(Lanchor)(Lancillary)]+ complexes and were characterised by means of J–V measurements and EQE spectra. The electrodes were functionalised according to the methods illustrated in Fig. 9. A particular emphasis is put on the relation between asymmetrical DπA ligands as organic dyes and their homoleptic complexes.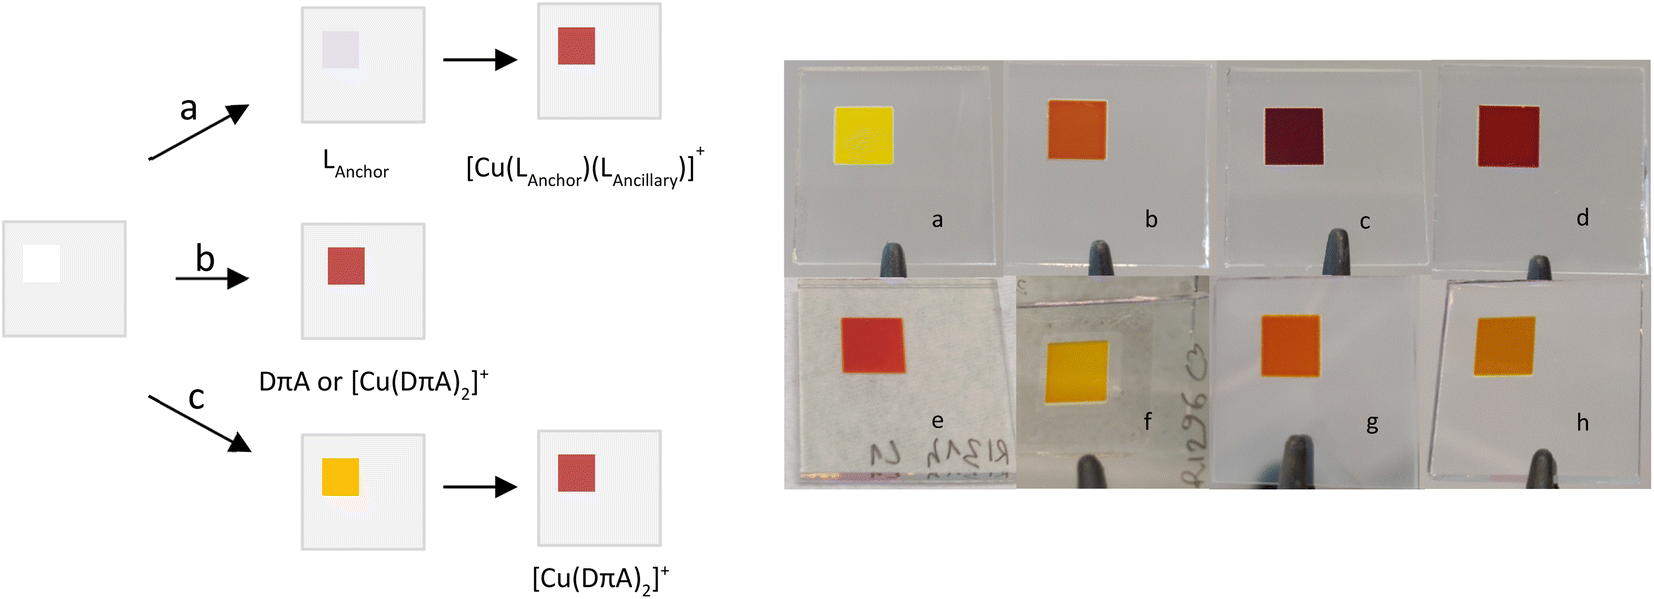 | ||
| Fig. 9 Electrode functionalisation methods used in this work. Method (a) SALSAC, [Lanchor] = 1.0 mM for 19 h, then [Cu(Lancillary)2][PF6] = 0.1 mM for ca. 72 h; method (b) [DπA] or [Cu(DπA)2] = 0.1 mM for 19 h; method (c) [DπA] = 1.0 mM for 19 h, then [Cu(CH3CN)4][PF6] for 16 h. (a–f) Photographs of functionalised electrodes: (a) 3; (b) 4; (c) 6; (d) method b [Cu(6)(6–H)]; (e) [Cu(4)(5)]+; (f) 3 + [Cu(I)] = 0.01 mM; (g) 3 + [Cu(I)] = 0.1 mM; (h) 3 + [Cu(I)] = 0.1 mM. | ||
Performances of organic dyes 3, 4 and 6
The J–V curves and parameters for cells with dyes 3, 4 and 6 on the day of sealing (day 0) are reported in Fig. 10 and Table 2. Increasing values of PCE are observed in the sequence 3, to 4 to 6 (η: 0.91%, 1.82% and 1.97% respectively). The differences in PCE are in part attributed to variations in the open circuit voltage (VOC), being lowest in 4 (517 mV) and highest in 3 (570 mV), but the short circuit current density (JSC) is predominantly responsible for the differences. Whereas dye 3 shows an average JSC of 2.45 mA cm−2, a drastic increase is observed with dyes 4 and 6, with values of 4.91 and 5.28 mA cm−2, respectively. The higher JSC values of dyes 4 and 6 are ascribed to the alkenyl-TPA donor substituents. In particular, the presence of the MeOTPA donor of 6 in place of one of the phosphonic acid substituent in 4 shows a moderate yet higher JSC. As visible from the J–V curves in Fig. 10, ligands with only one phosphonic acid substituent (3 and 6), show higher VOC than one with two phosphonic acid substituents (4). This demonstrates how rational structural changes of the ligands may impact the performance, indicating a high versatility and tunability of the properties of 2,2′-bipyridine-based DπA photosensitisers. Furthermore, extending the π-system and augmenting the number of donor groups (4 and 6 compared to 3) is beneficial in terms of the J–V performances of DSC devices.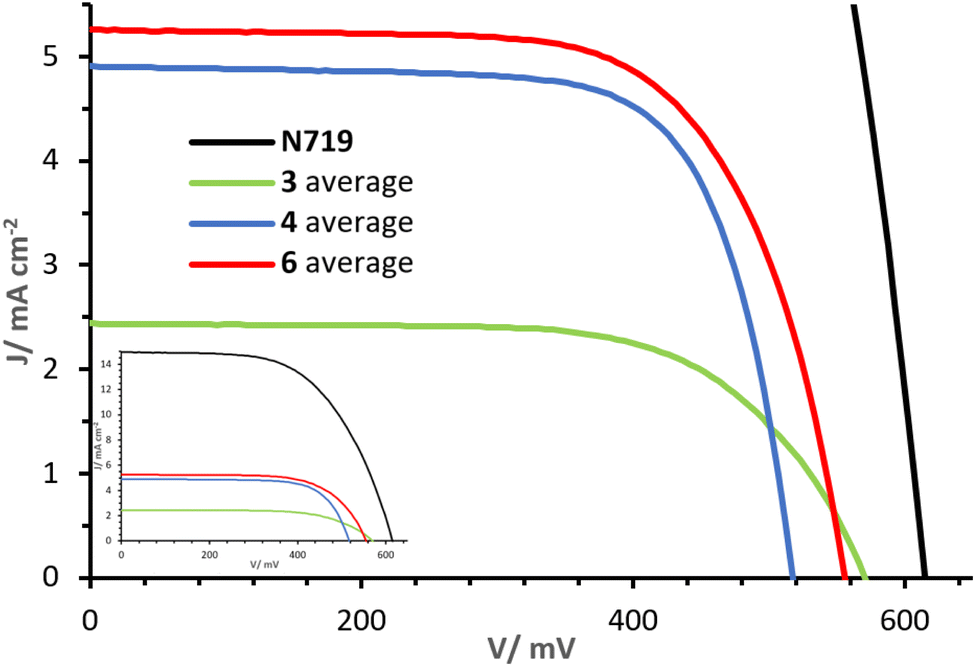 | ||
| Fig. 10 Day 0 J–V curves measured for cells with dyes 3, 4 and 6. The inset shows curves referred to that of N719. | ||
| Dye | JSC/mA cm−2 | VOC/mV | FF/% | η/% | ηrel./% |
|---|---|---|---|---|---|
| N719 | 15.02 | 615 | 59 | 5.42 | 100.0 |
| 3 c1 | 2.47 | 565 | 65 | 0.91 | 15.7 |
| 3 c2 | 2.51 | 578 | 65 | 0.94 | 16.2 |
| 3 c3 | 2.52 | 570 | 65 | 0.94 | 16.2 |
| 3 c4 | 2.32 | 567 | 66 | 0.86 | 14.9 |
| 3 Average | 2.45 ± 0.09 | 570 ± 6 | 65 | 0.91 ± 0.04 | 16.8 ± 0.7 |
| 4 c1 | 4.74 | 527 | 72 | 1.79 | 33.0 |
| 4 c2 | 5.19 | 516 | 72 | 1.92 | 35.5 |
| 4 c3 | 5.05 | 514 | 71 | 1.85 | 34.2 |
| 4 c4 | 4.68 | 512 | 72 | 1.72 | 31.8 |
| 4 Average | 4.91 ± 0.24 | 517 ± 7 | 72 | 1.82 ± 0.09 | 33.6 ± 1.6 |
| 6 c1 | 5.28 | 551 | 66 | 1.93 | 35.7 |
| 6 c2 | 5.33 | 563 | 67 | 2.01 | 37.1 |
| 6 c3 | 5.54 | 546 | 67 | 2.01 | 37.1 |
| 6 c4 | 4.96 | 563 | 69 | 1.92 | 35.5 |
| 6 Average | 5.28 ± 0.24 | 556 ± 8 | 67 ± 1 | 1.97 ± 0.05 | 36.4 ± 0.9 |
Performances of homoleptic and heteroleptic complexes
The J–V curves and parameters of complexes [Cu(3)(3–H)], [Cu(1)(2)]+, [Cu(6)(6–H)] and [Cu(4)(5)]+ are reported in Fig. 11 and Table 3. The congener dyes [Cu(3)(3–H)] and [Cu(1)(2)]+ exhibit close PCE values, with η of 1.82% and 1.78%.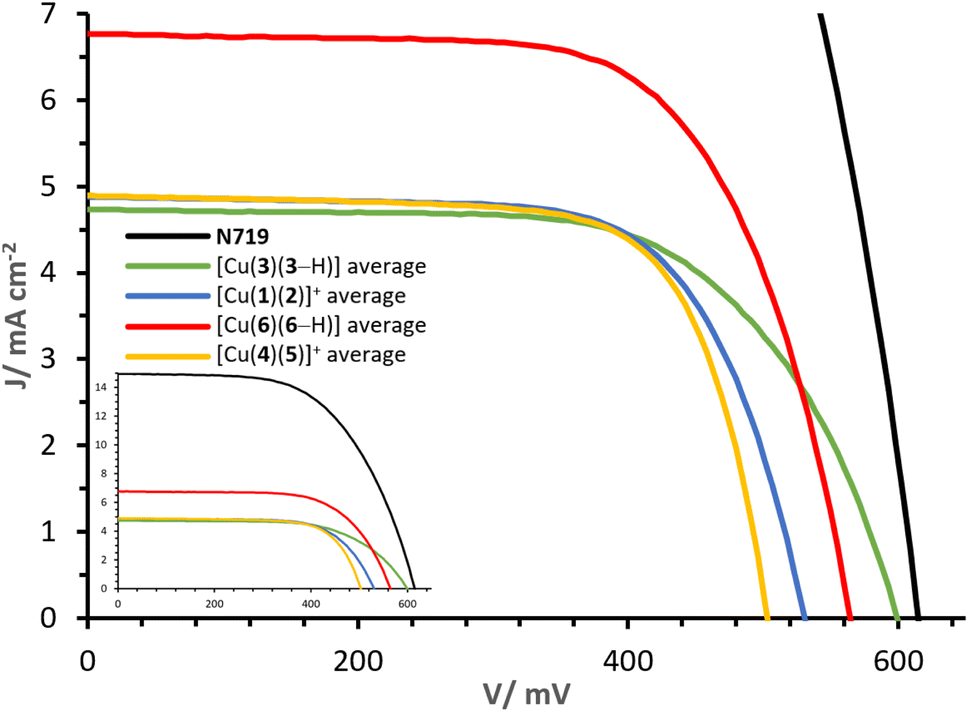 | ||
| Fig. 11 Day 0 J–V curves measured for cells with dyes [Cu(3)(3–H)], [Cu(1)(2)]+, [Cu(6)(6–H)] and [Cu(4)(5)]+. The inset shows curves referred to that of N719. | ||
| Dye | JSC/mA cm−2 | VOC/mV | FF/% | η/% | ηrel./% |
|---|---|---|---|---|---|
| a From electrodes functionalised with method b, see Fig. 7.b Set and parameters from our previous work.29c From electrodes functionalised with method a. | |||||
| N719 | 15.02 | 615 | 59 | 5.42 | 100.0 |
| [Cu(3)(3–H)]a c1 | 5.11 | 600 | 61 | 1.88 | 32.5 |
| [Cu(3)(3–H)]a c2 | 4.35 | 598 | 65 | 1.68 | 29.1 |
| [Cu(3)(3–H)]a c3 | 4.53 | 607 | 65 | 1.79 | 30.9 |
| [Cu(3)(3–H)]a c4 | 5.07 | 593 | 64 | 1.94 | 33.5 |
| [Cu(3)(3–H)] average | 4.77 ± 0.38 | 599 ± 6 | 64 ± 2 | 1.82 ± 0.11 | 33.6 ± 2.1 |
| [Cu(1)(2)]+b,c c1 | 4.82 | 532 | 68 | 1.74 | 32.2 |
| [Cu(1)(2)]+b,c c2 | 5.25 | 523 | 70 | 1.93 | 35.7 |
| [Cu(1)(2)]+b,c c3 | 4.64 | 536 | 69 | 1.71 | 31.5 |
| [Cu(1)(2)]+b,c c4 | 4.89 | 533 | 67 | 1.74 | 32.1 |
| [Cu(1)(2)]+ average | 4.90 ± 0.26 | 531 ± 6 | 68 ± 1 | 1.78 ± 0.10 | 32.9 ± 3.2 |
| [Cu(6)(6–H)]a c1 | 6.77 | 564 | 65 | 2.48 | 45.9 |
| [Cu(6)(6–H)]a c2 | 6.84 | 565 | 67 | 2.59 | 47.9 |
| [Cu(6)(6–H)] average | 6.81 ± 0.05 | 564 ± 1 | 66 ± 1 | 2.54 ± 0.08 | 46.9 ± 0.24 |
| [Cu(4)(5)]+c c1 | 4.92 | 507 | 70 | 1.76 | 32.5 |
| [Cu(4)(5)]+c c2 | 4.92 | 501 | 71 | 1.76 | 32.5 |
| [Cu(4)(5)]+c c3 | 4.79 | 501 | 71 | 1.70 | 31.4 |
| [Cu(4)(5)]+c c4 | 4.97 | 504 | 72 | 1.80 | 33.3 |
| [Cu(4)(5)]+ average | 4.90 ± 0.08 | 503 ± 3 | 71 ± 1 | 1.76 ± 0.04 | 32.4 ± 0.8 |
The heteroleptic dye [Cu(1)(2)]+ exhibits a slightly higher JSC of 4.90 mA cm−2 than [Cu(3)(3–H)] (4.77 mA cm−2). However, the major contribution to the PCE of [Cu(3)(3–H)] is found in the VOC with 599 mV (against 531 mV for [Cu(1)(2)]+, Table 3, visible in Fig. 11). It should be noted that whereas Lanchor 1 has two phosphonic acid substituents and ligand 3 has one, the complex bearing ligand 3 has a higher VOC. A slightly higher fill factor (FF) is reported for [Cu(1)(2)]+ with respect to that of [Cu(3)(3–H)] (68%, against 64%, respectively). The performances were monitored for a week after day 0 (Tables S3 and S4†). The measurements revealed a higher stability of [Cu(3)(3–H)] versus [Cu(1)(2)]+; especially on going from day 0 to day 7, a decrease in η of about 5% was observed in the case of [Cu(3)(3–H)] compared to 17% observed for [Cu(1)(2)]+. As seen with these two complex congeners, the [Cu(DπA)2]+ design can perform as well as the classic [Cu(Lanchor)(Lancillary)]+ design.
However, the comparison of complexes [Cu(6)(6–H)] and [Cu(4)(5)]+ reveals the potential of the [Cu(DπA)2]+ dye design. The gap in terms of PCE is large: while cells functionalised with [Cu(4)(5)]+ have an average η of 1.76%, those functionalised with [Cu(6)(6–H)] deliver an average of 2.54%, corresponding a relative PCE of 46.9% (ηrel, relative to an N719 reference), delivering the highest PCE for a homoleptic bis-diimine copper(I) complex and one of the highest PCEs attained with a copper(I)-based dye (without the use of a co-absorbent or co-sensitisation43,50). The complex [Cu(6)(6–H)] exhibits about 60 mV more than [Cu(4)(5)]+ cells (red and yellow curves, Fig. 11). Again, it is the case that when the anchoring unit belongs to an asymmetrical DπA ligand, the VOC of the corresponding complex is higher than that of its heteroleptic congener. The largest contribution to the PCE comes from the JSC, with values as high as 6.81 mA cm−2 for [Cu(6)(6–H)] (average of two duplicates, Table 3), versus 4.90 mA cm−2 measured with [Cu(4)(5)]+, having a determining impact on the PCEs.
We found the similar performances of complexes [Cu(3)(3–H)] and [Cu(1)(2)]+ encouraging, proving that dyes with the [Cu(DπA)2]+ design can deliver PCEs in the same range as those dyes with [Cu(Lanchor)(Lancillary)]+ design. Furthermore, the PCE behaviour from day 0 through day 7 of [Cu(3)(3–H)] may be indicative of a stabilising influence brought by the phosphonic acid located on each asymmetrical DπA ligand. Of greater significance is the comparison of complexes [Cu(6)(6–H)] and [Cu(4)(5)]+ which shows that shifting the dye design from [Cu(Lanchor)(Lancillary)]+ to [Cu(DπA)2]+ achieves a higher PCE than the ‘push–pull’ architecture.
Comparison of dyes 3 and 6 with their homoleptic copper complexes
It is of primary importance to analyse the performances of asymmetrical DπA ligands 3 and 6 in comparison with those of the corresponding complexes [Cu(3)(3–H)] and [Cu(6)(6–H)], in order to assess the effects of changing an organic dye to a metal complex.The PCE of ligand 3 is 0.91% whereas that of complex [Cu(3)(3–H)] is 1.82%. The JSC of ligand 3 is 2.45 mA cm−2 (Table 2) whereas that delivered by the homoleptic complex [Cu(3)(3–H)] is 4.77 mA cm−2 (Table 3). As seen in the EQE spectra (Fig. 12), complex [Cu(3)(3–H)] is redshifted (λmax 470 nm) and more intense than that of ligand 3 (450 nm). An increase in VOC is observed for [Cu(3)(3–H)] (Table 3, 599 mV) compared to ligand 3 (Table 3, 570 mV).
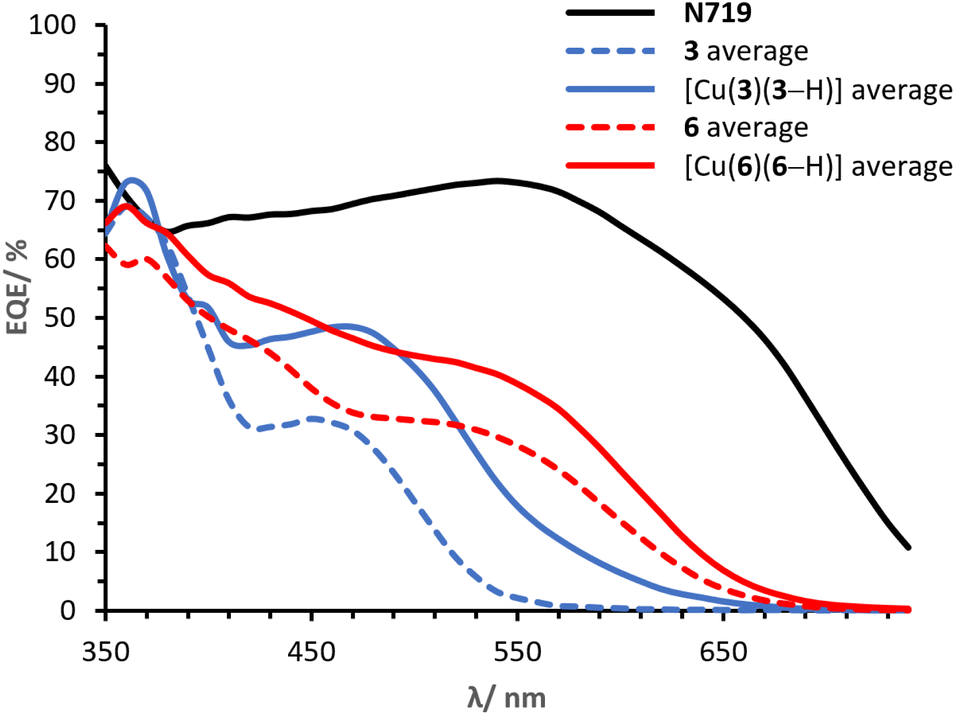 | ||
| Fig. 12 Day 0 average EQE spectra for cells with dyes 3, [Cu(3)(3–H)], 6, [Cu(6)(6–H)] and N719. | ||
This proves that an organic dye with a metal-binding domain can be coordinated to a metal centre resulting in an improvement in the DSC performances. We believe that this is the first time that this phenomenon has been observed.
Cells sensitised with ligand 6 exhibit a PCE of 1.97%, whereas those with [Cu(6)(6–H)] show values about 30% higher (Table 3, 2.54%). As with ligand 3, coordination of ligand 6 to copper(I) improves the DSC performance, having a greater impact on the JSC with values of 5.28 mA cm−2 (Table 2) for 6 and 6.81 mA cm−2 (Table 3) for the corresponding complex [Cu(6)(6–H)]. This is also visible in the EQE spectra in Fig. 12, where complex [Cu(6)(6–H)] exhibits higher EQEs than 6 over the whole spectral region. It is worth noting that both dyes show a broad spectrum with λonset at approximately 660 nm. The spectra feature similar shapes, with maximum EQE around 370 nm gradually decreasing towards a shoulder at about 550 nm in 6 and 560 nm in [Cu(6)(6–H)] (EQE values ranging from 71 to 40% in [Cu(6)(6–H)], from 60 to 28% in 6). Again, we observe a beneficial effect on the performances when the organic dye is coordinated.
Finally, it is worth spending a word on the comparison of [Cu(3)(3–H)] and [Cu(6)(6–H)]. It was shown how the complexation to copper(I) of both ligands 3 and 6 to the respective complexes exhibited enhanced the performances. However, copper(I) has a greater impact on 3 than 6, with PCE improvement rates of 100% and 29% in [Cu(3)(3–H)] and [Cu(6)(6–H)], respectively. We attribute the discrepancy to the overlap between the absorption region of the two ligands with respect to that of the corresponding complexes (Fig. 4). The alkenyl-TPA substituents in 6e (λmax = 391, Table 1) extend the spectral absorption of the ligand towards the visible region of copper(I) (ranging between 400 and 500 nm with diimine ligands11), as opposed to the case of 3e (λmax = 353, Table 1) and its complex. Hence, it is desirable to limit the absorption of the ligand away from that of copper(I) and benefit from the absorption of both the ligand and the metal.
Stepwise assembly on surface
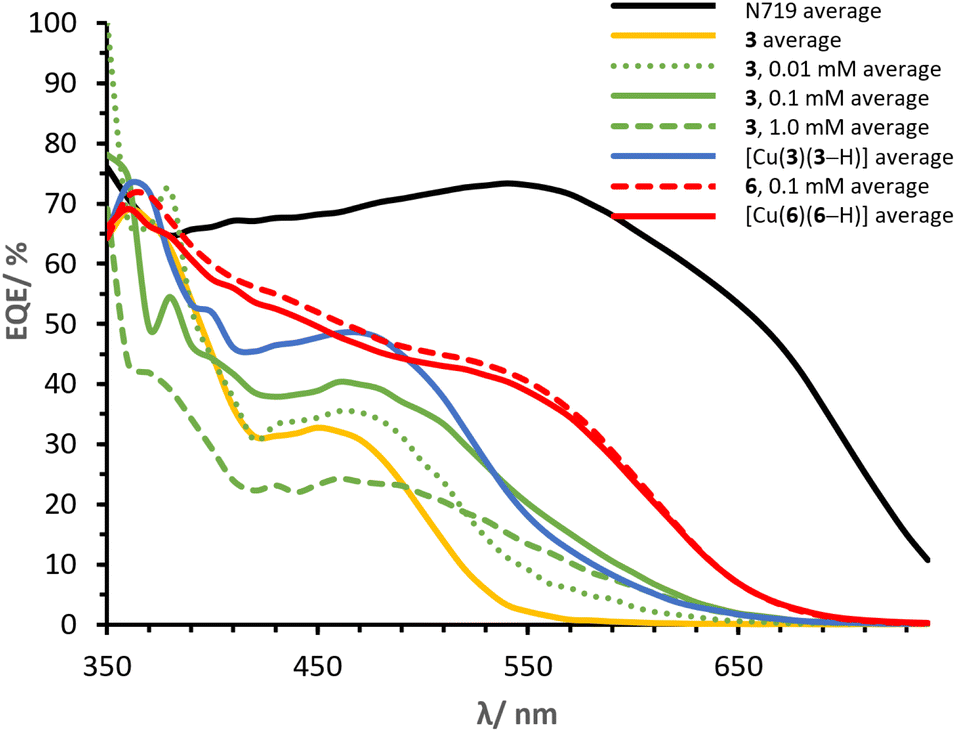
We wondered whether dyes with the [Cu(DπA)2]+ design could be assembled on the surface of the electrode, following a similar approach to the SALSAC strategy (method a, Fig. 9). Hence, a blank electrode was immersed into a MeOH solution containing ligand 3 for 19 h, followed by dipping into a solution containing [Cu(CH3CN)4][PF6] for 16 h. Three different concentrations of copper(I) salt were screened (0.01, 0.1 and 1.0 mM in CH2Cl2, electrodes in Fig. 9f–h) and parameters for J–V measurements on day 0 are reported in Table 4 (for day 3 and day 7 see Tables S5 and S6†). While with [Cu(I)] = 0.01 and 1.0 mM the PCEs lag behind with respect to [Cu(3)(3–H)] (0.91% and 1.16%, Table 4, against 1.82%, Table 3), with [Cu(I)] = 0.1 mM the PCE reaches 1.73%. The VOC is rather high with values for each set of cells ranging between 550 and 585 mV. Also, the FF are similar (64, 65 and 69%); the determining parameter is the JSC, with values of 2.40, 4.26, and 3.27 mA cm−2 for the concentrations of 0.01, 0.1 and 1.0 mM, respectively. The EQE spectra (lines in green in Fig. 13) are compared to both ligand 3 and [Cu(3)(3–H)] (Fig. 13, lines in yellow and blue, respectively). All the EQEs for the three concentrations possess a broader band than 3 (green lines, Fig. 13) and are more similar to that of [Cu(3)(3–H)], with λmax centred around 460 nm and EQE values of 35, 40 and 24% for [Cu(I)] of 0.01, 0.1 and 1.0 mM, respectively. Even though with lower EQE values, cells with [Cu(I)] = 0.1 mM display the most similar spectrum to that of [Cu(3)(3–H)]. Surprisingly, the PCE values for cells with [Cu(I)] = 0.1 mM are only 5% less than the those seen for [Cu(3)(3–H)] (whose electrodes are functionalised with ‘method b’), showing that the coordination to copper(I) enhances the PCE up to 90% when ligand 3 is treated according ‘method c’ surface assembly.| Dye and cell number | [Cu(CH3CN)4][PF6]/mM | JSC/mA cm−2 | VOC/mV | FF/% | η/% | ηrel./% |
|---|---|---|---|---|---|---|
| N719 | — | 15.02 | 615 | 59 | 5.42 | 100.0 |
| 3 c1 | 0.01 | 2.73 | 591 | 68 | 1.09 | 20.2 |
| 3 c2 | 0.01 | 1.64 | 561 | 61 | 0.56 | 10.4 |
| 3 c3 | 0.01 | 3.04 | 579 | 67 | 1.18 | 21.8 |
| 3 c4 | 0.01 | 2.18 | 582 | 63 | 0.81 | 14.9 |
| Average | — | 2.40 ± 0.62 | 578 ± 13 | 65 ± 3 | 0.91 ± 0.28 | 16.8 ± 5.2 |
| 3 c1 | 0.1 | 4.20 | 588 | 68.0 | 1.68 | 31.0 |
| 3 c2 | 0.1 | 4.25 | 578 | 69.6 | 1.71 | 31.6 |
| 3 c3 | 0.1 | 4.20 | 578 | 70.6 | 1.72 | 31.7 |
| 3 c4 | 0.1 | 4.39 | 597 | 68.8 | 1.80 | 33.3 |
| Average | — | 4.26 ± 0.09 | 585 ± 9 | 69 ± 1 | 1.73 ± 0.05 | 31.9 ± 1.0 |
| 3 c1 | 1.0 | 3.12 | 543 | 65.3 | 1.11 | 20.4 |
| 3 c2 | 1.0 | 3.40 | 554 | 64.4 | 1.21 | 22.4 |
| 3 c3 | 1.0 | 3.30 | 554 | 63.5 | 1.16 | 21.4 |
| Average | — | 3.27 ± 0.14 | 550 ± 6 | 64 ± 1 | 1.16 ± 0.05 | 21.4 ± 1.0 |
| 6 c1 | 0.1 | 7.31 | 537 | 66 | 2.60 | 48.1 |
| 6 c2 | 0.1 | 7.14 | 535 | 65 | 2.50 | 46.1 |
| 6 c3 | 0.1 | 7.18 | 538 | 64 | 2.46 | 45.3 |
| 6 c4 | 0.1 | 6.92 | 539 | 66 | 2.45 | 45.2 |
| Average | — | 7.14 ± 0.16 | 537 ± 1 | 65 ± 1 | 2.50 ± 0.07 | 46.2 ± 1.3 |
 | ||
| Fig. 13 Day 0 average EQE spectra of cells built with ‘method c’ with varying concentrations of copper(I). | ||
It is not surprising that when ligand-functionalised electrodes are exposed to different concentrations of copper(I) salt, the performances vary according to the amount of copper in solution; we have previously reported similar effects in which different concentrations of [Cu(Lancillary)2]+ impacted the performances of devices assembled using ‘method a’ (Fig. 9).68
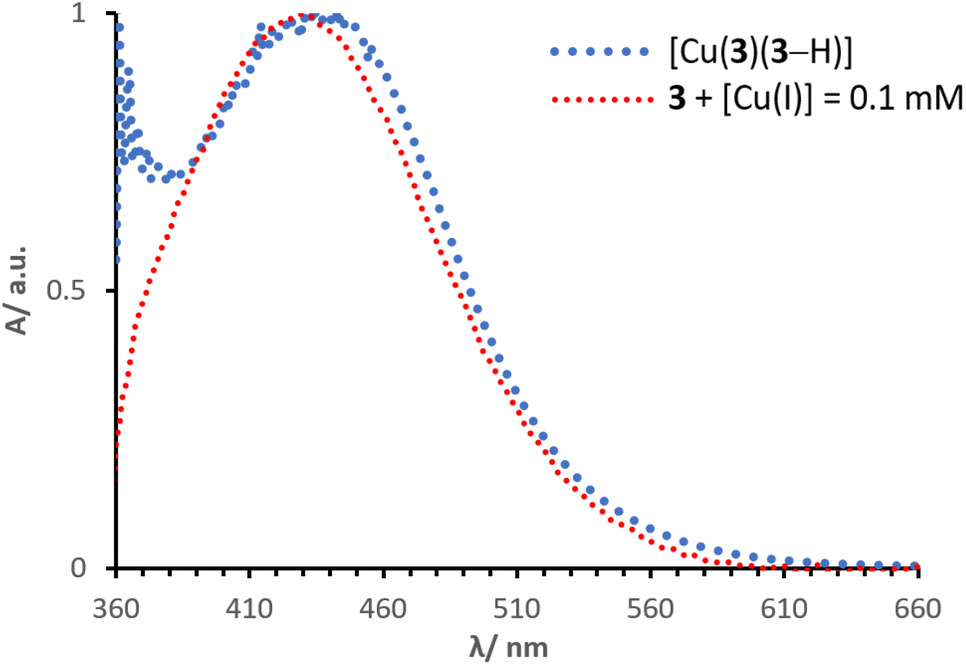
Normalised solid-state absorption spectra are presented in Fig. 14. An electrode functionalised with 3 (showing no absorption in the visible region) was immersed into a solution with [Cu(I)] = 0.1 mM (red, Fig. 14); the corresponding band overlays almost perfectly with that of an electrode dipped into a solution of complex [Cu(3)(3–H)] (Fig. 14, dotted line in blue). Thus, the two bear extremely similar (if not equal) photophysical properties. This is consistent with the concept that the desired species is formed on surface by means of a stepwise approach, similar to the assembly of heteroleptic copper(I) complexes (SALSAC, method a). Additionally, we demonstrate that a surface-bound organic photosensitiser can coordinate to copper(I) and form the corresponding complex on surface.
 | ||
| Fig. 14 Normalised solid state UV-visible spectra of electrodes functionalised with dyes 3 + [Cu(I)] = 0.1 mM and [Cu(3)(3–H)]. | ||
The same methodology was applied to electrodes functionalised with ligand 6. Cells with electrodes immersed in a 0.1 mM solution of [Cu(CH3CN)4][PF6] exhibited an average PCE of 2.50%, essentially the same as that of cells sensitised with [Cu(6)(6–H)] (Table 4, 2.54%). The JSC of 7.14 mA cm−2 is remarkably high when compared to that measured for devices with ligand 6 alone (Table 2, 5.28 mA cm−2), slightly higher than that of cells sensitised with [Cu(6)(6–H)] (6.81 mA cm−2). Instead, the VOC of 537 mV is lower than that of 6 and [Cu(6)(6–H)] (Tables 2 and 3, 556 and 564 mV, respectively). The EQE spectrum matches almost perfectly that of [Cu(6)(6–H)] (dashed and bold line in red, Fig. 13). With this, not only we see again that the assembly on surface with method c is possible, but also that in this case the performances are well representative of a dye with [Cu(DπA)2]+ design (namely [Cu(6)(6–H)]), whose cells are built with method b.
Conclusions
We have presented the syntheses and characterisation of ligands 3–6 and ester derivatives Their photophysical and electrochemical behaviours show that the alkenyl-TPA substituents in 4e, 5 and 6e have a significant impact on the properties of these ligands and their copper(I) complexes. The steric hindrance of the alkenyl-TPA limits the red-shift of [Cu(5)2][PF6] and [Cu(6e)2][PF6] with respect to 5 and 6, whereas the methyl groups in 3e allow a larger red-shift as in [Cu(3e)2][PF6]. DFT calculations revealed: (i) the donor character of the metal and the TPA units in the HOMOs, (ii) the degeneracy found in both HOMO and LUMO manifolds of [Cu(3)2]+ and [Cu(6)2]+, (iii) the anchor character of the LUMO and LUMO+1 in [Cu(3)2]+ and [Cu(6)2]+, whereas this is limited to the LUMO in [Cu(1)(2)]+ and [Cu(4)(5)]+.The TD-DFT study emphasises that the lowest energy transition is MLCT-based in [Cu(3e)2]+, but it is predominantly ILCT in [Cu(6e)2]+. From the DSC performances, we observe that: (i) a comparison of [Cu(3)(3–H)] and [Cu(1)(2)]+ shows that the [Cu(DπA)2]+ design can deliver as good efficiencies as the traditional [Cu(Lanchor)(Lancillary)]+ design, and (ii) a comparison of [Cu(6)(6–H)] and [Cu(4)(5)]+ confirms that the [Cu(DπA)2]+ design surpasses the performances of the [Cu(Lanchor)(Lancillary)]+ dye. [Cu(6)(6–H)] displays a PCE of 2.54% (46.9% relative to N719), which is the highest PCE for a homoleptic bis(diimine) copper(I) complex and among the highest PCEs attained by copper(I)-based dyes in DSCs.
We have also compared the asymmetrical DπA ligands as organic dyes with their homoleptic copper(I) complexes. The DSC performances demonstrate that coordination to copper(I) increases the PCEs on going from 3 and 6 (0.91 and 1.97%) to [Cu(3)(3–H)] and [Cu(6)(6–H)] (1.82 and 2.54%), respectively.
In conclusion, we have demonstrated the appealing potential of asymmetrical DπA 2,2′-bpy derivatives for applications in DSCs both as organic dyes and as sensitisers in the form of their copper(I) complexes. The [Cu(DπA)2]+ dyes perform better than the corresponding organic DπA dyes in DSCs. Although the DπA design is well-established for organic dyes, its implementation in ligands and subsequently their coordination compounds is, to the best of our knowledge, new. We hope that these results with encourage further investigations of asymmetrical DπA ligands and their copper(I) complexes.
Author contributions
Methodology, data analysis, manuscript writing (original draft): G. R.; crystallography: A. P.; TD-DFT calculations and writing of TD-DFT section: M. D.; concepts, supervision, funding acquisition, project management: C. E. H., E. C. C.; manuscript writing (review and editing): C. E. H., E. C. C.Conflicts of interest
There are no conflicts to declare.Acknowledgements
We acknowledge the Swiss Science Foundation (grant number 200020_182000) and the University of Basel for financial support. We thank Prof. Daniel Häussinger for help with the DOSY NMR experiments.References
- N. Z. Muradov and T. N. Veziroǧlu, Carbon-neutral fuels and energy carriers, CRC Press, Boca Raton, 2011 Search PubMed.
- I. Khan, Renewable Energy and Sustainability, Elsevier, Amsterdam, 2022 Search PubMed.
- H. B. Gray, Nat. Chem., 2009, 1, 7 CrossRef CAS PubMed.
- N. S. Lewis and D. G. Nocera, Proc. Natl. Acad. Sci. U. S. A., 2006, 103, 15729–15735 CrossRef CAS PubMed.
- Z. Chen, F. Li and C. Huang, Curr. Org. Chem., 2007, 11, 1241–1258 CrossRef CAS.
- P. Brogdon, H. Cheema and J. H. Delcamp, ChemSusChem, 2018, 11, 86–103 CrossRef CAS PubMed.
- J. Watson, R. R. Rodrigues and J. H. Delcamp, Cell Rep. Phys. Sci., 2022, 3, 1 Search PubMed.
- M. Urbani, M. E. Ragoussi, M. K. Nazeeruddin and T. Torres, Coord. Chem. Rev., 2019, 381, 1–64 CrossRef CAS.
- S. Anderson, E. C. Constable, M. P. Dare-Edwards, J. B. Goodenough, A. Hamnett, K. R. Seddon and R. D. Wright, Nature, 1979, 280, 571–573 CrossRef CAS.
- B. O'Regan and M. Grätzel, Nature, 1991, 353, 737–740 CrossRef.
- S. Aghazada and M. K. Nazeeruddin, Inorganics, 2018, 6, 52 CrossRef.
- J. Moll, C. Wang, A. Päpcke, C. Förster, U. Resch-Genger, S. Lochbrunner and K. Heinze, Chem.–Eur. J., 2020, 26, 6820–6832 CrossRef CAS PubMed.
- S. Lyu, Y. Farré, L. Ducasse, Y. Pellegrin, T. Toupance, C. Olivier and F. Odobel, RSC Adv., 2016, 6, 19928–19936 RSC.
- S. de Sousa, L. Ducasse, B. Kauffmann, T. Toupance and C. Olivier, Chem.–Eur. J., 2014, 20, 7017–7024 CrossRef CAS PubMed.
- G. C. Vougioukalakis, A. I. Philippopoulos, T. Stergiopoulos and P. Falaras, Coord. Chem. Rev., 2011, 255, 2602–2621 CrossRef CAS.
- B. Pashaei, H. Shahroosvand, M. Graetzel and M. K. Nazeeruddin, Chem. Rev., 2016, 116, 9485–9564 CrossRef CAS PubMed.
- A. Carella, F. Borbone and R. Centore, Front. Chem., 2018, 6, 481 CrossRef CAS PubMed.
- C. A. Bignozzi, R. Argazzi, R. Boaretto, E. Busatto, S. Carli, F. Ronconi and S. Caramori, Coord. Chem. Rev., 2013, 257, 1472–1492 CrossRef CAS.
- A. Hagfeldt, G. Boschloo, L. Sun, L. Kloo and H. Pettersson, Chem. Rev., 2010, 110, 6595–6663 CrossRef CAS PubMed.
- M. Grätzel, Inorg. Chem., 2005, 44, 6841–6851 CrossRef PubMed.
- A. Hagfeldt, Ambio, 2012, 41, 151–155 CrossRef PubMed.
- K. Sharma, V. Sharma and S. S. Sharma, Nanoscale Res. Lett., 2018, 13, 1–46 CrossRef CAS PubMed.
- J. Emsley, The Elements, Oxford University Press, Oxford, 3rd edn, 1998 Search PubMed.
- C. E. Housecroft and E. C. Constable, Chem. Soc. Rev., 2015, 44, 8386–8398 RSC.
- C. Förster and K. Heinze, Chem. Soc. Rev., 2020, 49, 1057–1070 RSC.
- M. S. Lazorski and F. N. Castellano, Polyhedron, 2014, 82, 57–70 CrossRef CAS.
- C. E. McCusker and F. N. Castellano, Inorg. Chem., 2013, 52, 8114–8120 CrossRef CAS PubMed.
- A. Lavie-Cambot, M. Cantuel, Y. Leydet, G. Jonusauskas, D. M. Bassani and N. D. McClenaghan, Coord. Chem. Rev., 2008, 252, 2572–2584 CrossRef CAS.
- L. Kohler, R. G. Hadt, D. Hayes, L. X. Chen and K. L. Mulfort, Dalton Trans., 2017, 46, 13088–13100 RSC.
- M. W. Mara, D. N. Bowman, O. Buyukcakir, M. L. Shelby, K. Haldrup, J. Huang, M. R. Harpham, A. B. Stickrath, X. Zhang, J. F. Stoddart, A. Coskun, E. Jakubikova and L. X. Chen, J. Am. Chem. Soc., 2015, 137, 9670–9684 CrossRef CAS PubMed.
- N. Alonso-Vante, J. F. Nierengarten and J. P. Sauvage, J. Chem. Soc., Dalton Trans., 1994, 1649–1654 RSC.
- T. Bessho, E. C. Constable, M. Graetzel, A. Hernandez Redondo, C. E. Housecroft, W. Kylberg, M. K. Nazeeruddin, M. Neuburger and S. Schaffner, Chem. Commun., 2008, 3717–3719 RSC.
- Y. J. Yuan, Z. T. Yu, J. Y. Zhang and Z. G. Zou, Dalton Trans., 2012, 41, 9594–9597 RSC.
- A. Colombo, C. Dragonetti, D. Roberto, A. Valore, P. Biagini and F. Melchiorre, Inorg. Chim. Acta, 2013, 407, 204–209 CrossRef CAS.
- S. Sakaki, T. Kuroki and T. Hamada, J. Chem. Soc., Dalton Trans., 2002, 840–842 RSC.
- M. Sandroni, M. Kayanuma, A. Planchat, N. Szuwarski, E. Blart, Y. Pellegrin, C. Daniel, M. Boujtita and F. Odobel, Dalton Trans., 2013, 42, 10818–10827 RSC.
- C. L. Linfoot, P. Richardson, T. E. Hewat, O. Moudam, M. M. Forde, A. Collins, F. White and N. Robertson, Dalton Trans., 2010, 39, 8945–8956 RSC.
- S. De, K. Mahata and M. Schmittel, Chem. Soc. Rev., 2010, 39, 1555–1575 RSC.
- K. Mahata, M. L. Saha and M. Schmittel, J. Am. Chem. Soc., 2010, 132, 15933–15935 CrossRef CAS PubMed.
- S. Neogi, G. Schnakenburg, Y. Lorenz, M. Engeser and M. Schmittel, Inorg. Chem., 2012, 51, 10832–10841 CrossRef CAS PubMed.
- F. J. Malzner, C. E. Housecroft and E. C. Constable, Inorganics, 2018, 6, 57 CrossRef.
- G. Risi, M. Becker, C. E. Housecroft and E. C. Constable, Molecules, 2020, 25, 1528 CrossRef CAS PubMed.
- F. J. Malzner, M. Willgert, E. C. Constable and C. E. Housecroft, J. Mater. Chem. A, 2017, 5, 13717–13729 RSC.
- F. Brunner, Y. M. Klein, S. Keller, C. D. Morris, A. Prescimone, E. C. Constable and C. E. Housecroft, RSC Adv., 2015, 5, 58694–58703 RSC.
- Y. M. Klein, M. Willgert, A. Prescimone, E. C. Constable and C. E. Housecroft, Dalton Trans., 2016, 45, 4659–4672 RSC.
- A. Colombo, C. Dragonetti, F. Fagnani, D. Roberto, F. Melchiorre and P. Biagini, Dalton Trans., 2019, 48, 9818–9823 RSC.
- E. Lüthi, P. A. F. Cortés, A. Prescimone, E. C. Constable and C. E. Housecroft, Int. J. Mol. Sci., 2020, 21, 1735 CrossRef PubMed.
- F. J. Malzner, A. Prescimone, E. C. Constable, C. E. Housecroft and M. Willgert, J. Mater. Chem. A, 2017, 5, 4671–4685 RSC.
- S. O. Fürer, B. Bozic-Weber, T. Schefer, C. Wobill, E. C. Constable, C. E. Housecroft and M. Willger, J. Mater. Chem. A, 2016, 4, 12995–13004 RSC.
- M. Sandroni, L. Favereau, A. Planchat, H. Akdas-Kilig, N. Szuwarski, Y. Pellegrin, E. Blart, H. le Bozec, M. Boujtita and F. Odobel, J. Mater. Chem. A, 2014, 2, 9944–9947 RSC.
- C. Dragonetti, M. Magni, A. Colombo, F. Fagnani, D. Roberto, F. Melchiorre, P. Biagini and S. Fantacci, Dalton Trans., 2019, 48, 9703–9711 RSC.
- C. E. Housecroft and E. C. Constable, Chem. Sci., 2022, 13, 1225–1262 RSC.
- L. Mauri, A. Colombo, C. Dragonetti and F. Fagnani, Inorganics, 2022, 10, 137 CrossRef CAS.
- B. Bozic-Weber, V. Chaurin, E. C. Constable, C. E. Housecroft, M. Meuwly, M. Neuburger, J. A. Rudd, E. Schönhofer and L. Siegfried, Dalton Trans., 2012, 41, 14157–14169 RSC.
- A. Büttner, S. Y. Brauchli, R. Vogt, E. C. Constable and C. E. Housecroft, RSC Adv., 2016, 6, 5205–5213 RSC.
- J. Cong, X. Yang, J. Liu, J. Zhao, Y. Hao, Y. Wang and L. Sun, Chem. Commun., 2012, 48, 6663–6665 RSC.
- S. Y. Brauchli, F. J. Malzner, E. C. Constable and C. E. Housecroft, RSC Adv., 2015, 5, 48516–48525 RSC.
- S. Mastroianni, I. Asghar, K. Miettunen, J. Halme, A. Lanuti, T. M. Brown and P. Lund, Phys. Chem. Chem. Phys., 2014, 16, 6092–6100 RSC.
- B. Bozic-Weber, E. C. Constable, C. E. Housecroft, M. Neuburger and J. R. Price, Dalton Trans., 2010, 39, 3585–3594 RSC.
- A. Peppas, D. Sokalis, D. Perganti, G. Schnakenburg, P. Falaras and A. I. Philippopoulos, Dalton Trans., 2022, 51, 15049–15066 RSC.
- T. Inomata, M. Hatano, Y. Kawai, A. Matsunaga, T. Kitagawa, Y. Wasada-Tsutsui, T. Ozawa and H. Masuda, Molecules, 2021, 26, 6835 CrossRef CAS PubMed.
- D. H. Wu, A. D. Chen and C. S. Johnson, J. Magn. Reson., 1995, 115, 260–264 CrossRef CAS.
- Software for the Integration of CCD Detector System Bruker Analytical X-ray Systems, Bruker axs, Madison, WI, (after 2013) Search PubMed.
- G. M. Sheldrick, Acta Crystallogr., Sect. C: Struct. Chem., 2015, 71, 3–8 Search PubMed.
- O. v. Dolomanov, L. J. Bourhis, R. J. Gildea, J. A. K. Howard and H. Puschmann, J. Appl. Crystallogr., 2009, 42, 339–341 CrossRef CAS.
- G. M. Sheldrick, Acta Crystallogr., Sect. A: Found. Adv., 2015, 71, 3–8 CrossRef PubMed.
- C. F. Macrae, I. Sovago, S. J. Cottrell, P. T. A. Galek, P. McCabe, E. Pidcock, M. Platings, G. P. Shields, J. S. Stevens, M. Towler and P. A. Wood, J. Appl. Crystallogr., 2020, 53, 226–235 CrossRef CAS PubMed.
- B. Bozic-Weber, S. Y. Brauchli, E. C. Constable, S. O. Fürer, C. E. Housecroft, F. J. Malzner, I. A. Wright and J. A. Zampese, Dalton Trans., 2013, 42, 12293–12308 RSC.
- S. E. Hooshmand, B. Heidari, R. Sedghi and R. S. Varma, Green Chem., 2019, 21, 381–405 RSC.
- C. E. McKenna, M. T. Higa, N. H. Cheung and M. C. McKenna, Tetrahedron Lett., 1977, 18, 155–158 CrossRef.
- V. V. Pavlishchuk and A. W. Addison, Inorg. Chim. Acta, 2000, 298, 97–102 CrossRef CAS.
- V. Leandri, A. R. P. Pizzichetti, B. Xu, D. Franchi, W. Zhang, I. Benesperi, M. Freitag, L. Sun, L. Kloo and J. M. Gardner, Inorg. Chem., 2019, 58, 12167–12177 CrossRef CAS PubMed.
- Z. Wan, C. Jia, Y. Wang and X. Yao, RSC Adv., 2015, 5, 50813–50820 RSC.
- Spartan '20 version 1.1.2, Wavefunction INC., Irvine, CA 92612 Search PubMed.
- Gaussian 16, Revision C.01, M. J. Frisch, G. W. Trucks, H. B. Schlegel, G. E. Scuseria, M. A. Robb, J. R. Cheeseman, G. Scalmani, V. Barone, G. A. Petersson, H. Nakatsuji, X. Li, M. Caricato, A. V. Marenich, J. Bloino, B. G. Janesko, R. Gomperts, B. Mennucci, H. P. Hratchian, J. V. Ortiz, A. F. Izmaylov, J. L. Sonnenberg, D. Williams-Young, F. Ding, F. Lipparini, F. Egidi, J. Goings, B. Peng, A. Petrone, T. Henderson, D. Ranasinghe, V. G. Zakrzewski, J. Gao, N. Rega, G. Zheng, W. Liang, M. Hada, M. Ehara, K. Toyota, R. Fukuda, J. Hasegawa, M. Ishida, T. Nakajima, Y. Honda, O. Kitao, H. Nakai, T. Vreven, K. Throssell, J. A. Montgomery Jr, J. E. Peralta, F. Ogliaro, M. J. Bearpark, J. J. Heyd, E. N. Brothers, K. N. Kudin, V. N. Staroverov, T. A. Keith, R. Kobayashi, J. Normand, K. Raghavachari, A. P. Rendell, J. C. Burant, S. S. Iyengar, J. Tomasi, M. Cossi, J. M. Millam, M. Klene, C. Adamo, R. Cammi, J. W. Ochterski, R. L. Martin, K. Morokuma, O. Farkas, J. B. Foresman, and D. J. Fox, Gaussian, Inc., Wallingford CT, 2016 Search PubMed.
- A. D. Becke, J. Chem. Phys., 1998, 98, 5648 CrossRef.
- C. Lee, W. Yang and R. G. Parr, Phys. Rev. B: Condens. Matter Mater. Phys., 1988, 37, 785 CrossRef CAS PubMed.
- I. Nohara, C. Wegeberg, M. Devereux, A. Prescimone, C. E. Housecroft and E. C. Constable, J. Mater. Chem. C, 2022, 10, 3089–3102 RSC.
- G. Scalmani and M. J. Frisch, J. Chem. Phys., 2010, 132, 114110 CrossRef PubMed.
- R. L. Martin, J. Chem. Phys., 2003, 118, 4775 CrossRef.
Footnote |
| † Electronic supplementary information (ESI) available: Experimental section. Fig. S1–S45; NMR spectra; Fig. S46–S60: FT-IR spectra; HR-MS spectra: S61–S75; Table S1: DOSY data; Fig. S76: cyclic voltammograms; Fig. S77, S78 and Table S2: DFT calculations; J–V parameters: Tables S3–S8. CCDC 2203243. For ESI and crystallographic data in CIF or other electronic format see DOI: https://doi.org/10.1039/d3ra00437f |
| This journal is © The Royal Society of Chemistry 2023 |