 Open Access Article
Ultralow diffusion barrier induced by intercalation in layered N-based cathode materials for sodium-ion batteries†
Yundan Jiang,
Wangping Xu,
Wei Zhao * and
Juexian Cao*
Department of Physics & Hunan Institute of Advanced Sensing and Information Technology, Xiangtan University, Xiangtan 411105, PR China. E-mail: zhaowei@xtu.edu.cn; jxcao@xtu.edu.cn
First published on 13th March 2023
Abstract
Sodium-ion batteries (SIBs) have attracted huge attention due to not only the similar electrochemical properties to Lithium-ion batteries (LIBs) but also the abundant natural reserves of sodium. However, the high diffusion barrier has hindered its application. In this work, we have theoretically studied the relationship between the strain and the diffusion barrier/path of sodium ions in layered CrN2 by first-principles calculation. Our results show that the strain can not only effectively decrease the diffusion barrier but also change the sodium diffusion path, which can be realized by alkali metal intercalation. Moreover, the diffusion barrier is as low as 0.04 eV with the Cs atoms embedding in layered CrN2 (Cs1/16CrN2), suggesting an excellent candidate cathode for SIBs. In addition, the decrease of the barrier mainly originated from the fact that interlayer electronic coupling weakened with the increase of interlayer spacing. Our findings provide an effective way to enhance sodium diffusion performance, which is beneficial for the design of SIB electrode materials.
1. Introduction
Lithium-ion batteries (LIBs) have attracted much attention for their wide application in energy storage over the past decades.1,2 However, the uneven distribution and limited reserves of lithium resources hinder their application.3 In contrast, sodium-ion batteries (SIBs) not only have similar properties to LIBs but also have the advantages of abundant reserves, low cost and being environment-friendly.4,5 The cathode material plays a critical role in battery performance, and the ideal cathode materials are supposed to possess a high capacity and low diffusion barrier.6,7 Therefore, screening new cathode materials with excellent electrochemical performance is an effective way to facilitate the development and application of SIBs.Conventional SIBs cathodes have promoted the development of sodium-ion batteries to a certain extent, including transition metal oxides,8 polyanionic compounds9 and Prussian blue analogs,10 but the low capacity and high diffusion barrier greatly hinder SIBs application. Recently, layered materials have received much attention due to their unique geometry structures for SIBs, including layered transition oxides, transition metal dichalcogenides (TMDs), and other two-dimensional layered materials.11–15 Transition metal oxides possess high specific capacities and free pollution, while the poor structural stability during the process of charging and discharging limits their application.16 TMDs also have a high theoretical capacity and structural stability because of their unique sandwich structures, while the lower conductivity and volume expansion will result in poor rate capability and cycle stability.12,17 Furthermore, two-dimensional monolayer materials, such as ScO2, BP2 and V2O5, boast large surface areas, which provide a wide range of sodium storage sites, but they also exhibit poor electrical conductivity.18–20 It is worth noticing that two-dimensional transition metal N-based materials (i.e. MoN2, VN2 and Zr2N) have both high capacity and excellent electronic conductivity, suggesting that they can serve as potential cathode SIBs materials.21–23 In particular, layered CrN2 has been proven to be a promising candidate for sodium-ion batteries for its high theoretical capacity and high voltage platform.24 However, due to the strong interlayer coupling, the diffusion barrier of layered CrN2 is still too high for practical application. Therefore, it is urgent to explore an efficient way to improve the diffusion performance of SIBs.
Strain engineering, which can be realized by element intercalating and mechanical loading, is a simple and efficient way to lower the Na-ion diffusion barrier and improve the conductivity properties for designing electrode materials of SIBs.25,26 Thus, in this work, we have theoretically studied the relationship between the strain and the diffusion barrier/path of sodium ions in layered CrN2 by first-principles calculation, which can be realized by alkali metal intercalation. The results show that the strain can not only effectively decrease the diffusion barrier but also change the sodium diffusion path. Furthermore, the diffusion barrier is low as 0.04 eV with the Cs atoms embedding in layered CrN2 (Cs1/16CrN2), implying a fascinating candidate cathode material for SIBs. Besides, the decrease in the barrier mainly originated from the fact that interlayer electronic coupling weakened with the increase of interlayer spacing.
2. Computational details and models
All of the calculations were performed using the Vienna ab initio simulation package (VASP) based on the density functional theory (DFT).27,28 The exchange–correlation interaction between electrons was described by Perdew–Burke–Ernzerhof (PBE) functional in Generalized Gradient Approximation (GGA) theory with Hubbard U correction for the self-interaction errors.29,30 The value of U for Cr (3.69 eV) was determined according to the linear response method which was discussed in detail in ESI.†31 The cutoff energy for expanding plane wave function was set to 450 eV. The criterion of energy and force convergence was set to 10−6 eV and 0.01 eV Å−1, respectively. The k-points for structural relaxation were set to be 12 × 12 × 3. The van der Waals interactions (DFT-D3) were considered in all calculations to correct the long–range interactions between interlayers.32To discuss the intercalation and diffusion performance of sodium ions in CrN2, a 4 × 4 × 1 supercell consisting of 32 Cr atoms and 64-N atoms was used, and a 3 × 3 × 3 K-point grid was adopted. The Climbing Image Nudge Elastic Band (CI-NEB) method was used to calculate the Na diffusion performance.33
The intercalation energy Einter of Na intercalating in the interlayer is defined as eqn (1):
| Einter = (ENaxX − EX − xμNa)/x | (1) |
The theoretical capacity34 C is defined according to formula (2):
 | (2) |
![[thin space (1/6-em)]](https://www.rsc.org/images/entities/char_2009.gif) 485 C mol−1), and M is the relative molecular weight in the molecular formula.
485 C mol−1), and M is the relative molecular weight in the molecular formula.
The voltage35 V is calculated by the formula (3):
 | (3) |
 and
and  are the total energy of ENaxX at concentrations of x1 and x2, respectively. μNa is the chemical potential of the Na atom, and e is the electric quantity of an electron (e = 1.6 × 10⁻¹⁹ C). In all of the above formulas, X refers to Cs1/16CrN2.
The two sandwich-like structure models of CrN2, which are highly similar to TMDs, were studied in this work, as shown in Fig. 1. Among them, each Cr forms different coordination structures with six N, which are divided into 2H-phase (octahedral coordination structure with AB stacking order of CrN2 layers) and 1T-phase (triangular prismatic coordination structure with AA stacking order of CrN2 layers) according to the coordination structure formed by Cr and N and the stacking order of CrN2 layers. The single cells of the 2H-phase and 1T-phase are all hexagonal cells. In the 2H-phase, a unit cell contains 2-layers of CrN2, including 2-Cr atoms and 4-N atoms. In the 1T-phase, a unit cell contains 1 CrN2 layer, including 1-Cr atom and 2-N atoms. Therefore, a 1 × 1 × 1 unit-cell of 2H-phase and 1 × 1 × 2 supercell of 1T-phase were used for calculations, both of which have 2 CrN2 layers containing 2-Cr atoms and 4-N atoms. The lattice constants of the calculated 2H-phase CrN2 are a = b = 3.20 Å and c = 7.90 Å, and those of the calculated 1T-phase are a = b = 2.78 Å and c = 8.66 Å. Similar to conventional TMDs, the formation energy of the 2H-phase is lower than that of the 1T-phase, indicating that 2H enjoys better structural stability.36 Besides, as shown in Fig. S3,† 2H–CrN2 has both good kinetic and thermodynamic stability according to phonon spectra and ab initio molecular dynamics (AIMD) calculations. Moreover, the 2H-phase CrN2 has the advantages of high theoretical capacity and high electrode potential, which makes it have considerable potential to be applied in the cathode materials of sodium-ion batteries.24
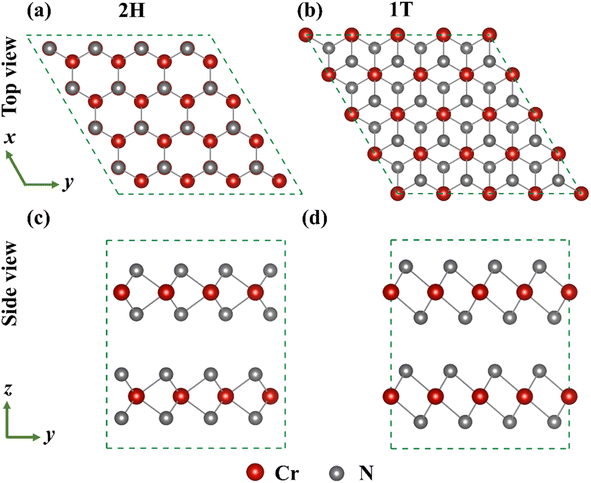 | ||
| Fig. 1 The top and side views of 2H-phase (a) (c) and 1T-phase (b) (d) CrN2 structure, respectively (Dark red sphere and gray sphere represent Cr and N atoms, respectively.). | ||
3. Results and discussions
3.1 Strain effect of CrN2
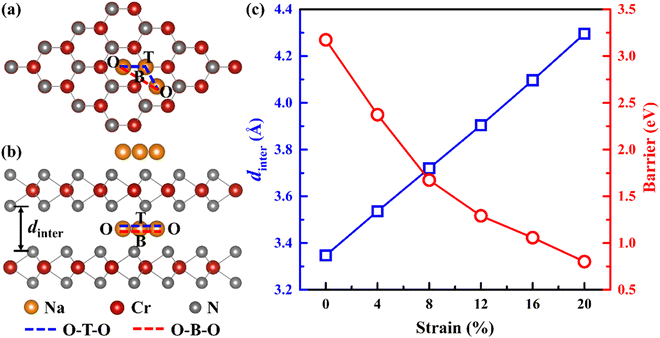
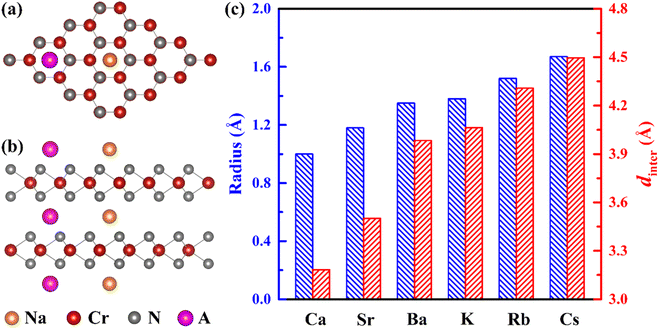
To improve the diffusion performance of CrN2, we established a toy model to study the regulation of strain on its diffusion performance. In this model, 0–20% tensile strain is applied to the c-axis, and all Cr and N atoms are fixed to ensure that the c-axis strain can be maintained after the structure is fully relaxed. Among them, the most stable intercalation site of sodium is the octahedral gap between the CrN2 layers (position O in Fig. 2a and b). The possible diffusion path is that Na diffuses along the top side of the Cr atom (O–T–O) or the bridge site of the Cr–N bond (O–B–O) between two adjacent insertion sites, respectively. The results show that the diffusion barrier decreases significantly with the increase of strain, as is shown in Fig. 2c. At low strain, Na tends to diffuse along the path of O–T–O; when the strain increases to more than 16%, the diffusion barriers of the two diffusion paths are almost equal, indicating that Na will diffuse along the two paths at the same time, as is shown in Fig. S4.† The change in diffusion barrier and path is mainly induced by the increase of interlayer spacing, as is shown in Fig. 2c.In experiments, interlayer spacing can usually be increased by large ion intercalating. In order to maintain the charge balance of the system, alkali and alkaline earth metals with similar electronegativity to sodium were selected as intercalated ions. Since both alkali metals and alkaline earth metals (Ca, Sr, Ba, K, Rb and Cs) have larger ionic radius than Na (except Ca), their embedding between CrN2 layers will increase the interlayer spacing so that CrN2 can obtain a larger strain in the c-axis direction. Its intercalated structure is shown in Fig. 3a and b, and the intercalated concentration is 6.25%. The interlayer spacing of CrN2 increases with the increase of the intercalated atomic radius of the interlayer, as is shown in Fig. 3c. The increase in interlayer spacing will lead to the increase of the c-axis, thus realizing the tensile strain of the c-axis. Among them, the Cs atom has the largest ionic radius (1.67 Å), and the CrN2 interlayer spacing reaches 4.5 Å after Cs intercalation, which is much larger than that of CrN2 without intercalation (3.35 Å). A larger layer spacing will be conducive to the diffusion of Na between interlayers, making it easier to intercalate and de-intercalate Na, thus improving the rate capability of the material. In addition, in the process of battery charging and discharging, the interlayer atoms can better maintain the structural stability of CrN2, reduce the collapse of CrN2 in the case of complete Na removal, and improve the cyclic stability of the material.
To further study the influence of alkali metal or alkaline earth metal intercalation on the diffusion barrier of Na, we calculated the diffusion barrier of Na along the O–T–O or O–B–O path, respectively. The results show that the diffusion barrier of Na decreases significantly with the increase of the intercalated atomic radius, as is shown in Fig. 4a and b. Especially after Cs intercalation, the diffusion barrier of Na decreases to 0.04 eV, which is significantly lower than that of CrN2 without intercalation (0.9 eV). The change in diffusion barrier is mainly caused by the increases in interlayer spacing after ion intercalation. With the increase of interlayer spacing, the diffusion barrier decreases sharply, as is shown in Fig. 4c. Furthermore, the diffusion path has changed with the different intercalation elements. Specifically, Na diffuses through the O–T–O path for CrN2 for K and Rb intercalation, while for Cs intercalation, it through the O–B–O path for CrN2, as is shown in Fig. 4a and c. But for alkaline earth metals (Ca, Sr and Ba) intercalation, the diffusion only follows the O–B–O path due to the large quantity of charge (high valence state), as is shown in Fig. 4a and c. Besides, the volume change rate of Cs1/16CrN2 during the sodium diffusion process is only 3% due to the structural stabilization effect of Cs ion embedding.
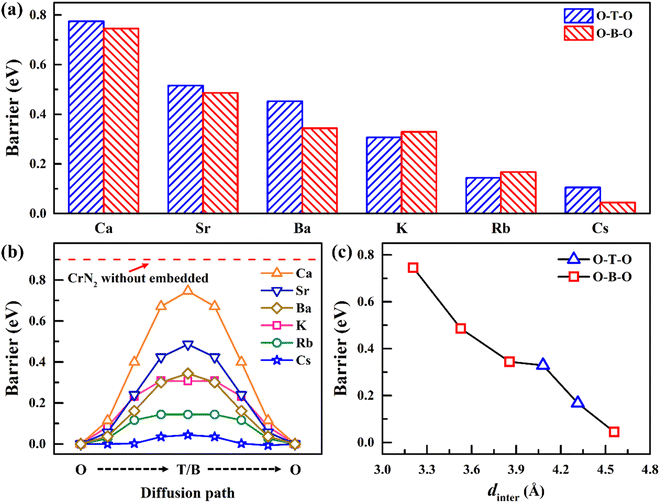 | ||
| Fig. 4 (a) Diffusion barrier of Na along O–T–O or O–B–O paths in A1/16CrN2 (A = K, Rb, Cs, Ca, Sr and Ba); (b) diffusion energy profile of Na along the lowest barrier path in A1/16CrN2 (A = K, Rb, Cs, Ca, Sr and Ba) (red dashed line represents the barrier of Na in CrN2 without atoms embedded, and Fig. S5† shows its diffusion energy profile); (c) the relationship between diffusion barrier and diffusion path with interlayer spacing. | ||
3.2 Properties of Cs1/16CrN2
The intercalation energy of Na ions in Cs1/16CrN2 is a key parameter to measure the difficulty of intercalation. Therefore, we calculated the intercalation energy of Na ions in Cs1/16CrN2 at different concentrations. Fig. S6† shows the most stable structure of Na intercalation at different concentrations. The calculated intercalation energy at different concentrations is shown in Fig. 5a. The results show that at low concentrations (less than 0.6), the intercalation energy decreases with the increase of Na concentration because the effective interaction of sodium ions is attractive. However, when the concentration of Na goes beyond 0.6, the effective interaction of sodium ions becomes repulsive, and the intercalation energy increases with Na concentrations; as is shown in Fig. 5a. Overall, the negative intercalation energy allows Na to be embedded easily in Cs1/16CrN2. Moreover, Cs1/16CrN2 has larger negative intercalation energy than CrN2 without Cs intercalating, indicating that Na can intercalate in Cs1/16CrN2 more easily.24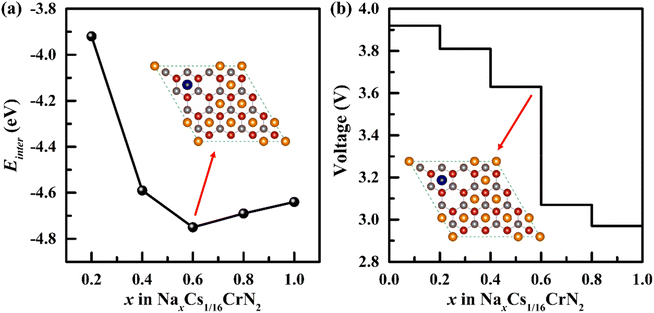 | ||
| Fig. 5 (a) The intercalation energy (Einter) of Na in Cs1/16CrN2 at various concentrations. (b) The voltage profile of Na embedded in Cs1/16CrN2 (the illustration shows the intercalation structure with a Na concentration of 0.6, and the most stable intercalation structure at each concentration is shown in Fig. S6†). | ||
Electrode potential is another important parameter of electrode materials. We calculated the voltage of Cs1/16CrN2 at different Na concentrations. The results show that NaxCs1/16CrN2 has a high voltage platform of 3.0–3.9 V, as is shown in Fig. 5b. According to the voltage calculation formula, when x1 = 0, x2 = 1, the calculated voltage (3.5 V) is the open circuit voltage. Such high voltage makes it have high output power as the cathode for SIBs. Furthermore, the initial voltage (3.9 V) and average voltage (3.5 V) of CrN2 with Cs intercalating are both higher than that of CrN2 without Cs intercalating (initial voltage of 3.8 V and average voltage of 3.4 V).24
Theoretical capacity, another important parameter of electrode materials, determines the energy density of electrode materials. The theoretical capacity of Cs1/16CrN2 is calculated to be 285 mA h g−1. The energy density D was calculated according to D = C·V, here C and V represents the theoretical capacity and open circuit voltage, respectively.37 Thus the calculated energy density of Cs1/16CrN2 is 903 W h kg−1, higher than traditional transition metal oxides (less than 800 W h kg−1), polyanions (less than 500 W h kg−1) and Prussian blue compounds (about 500 W h kg−1).38
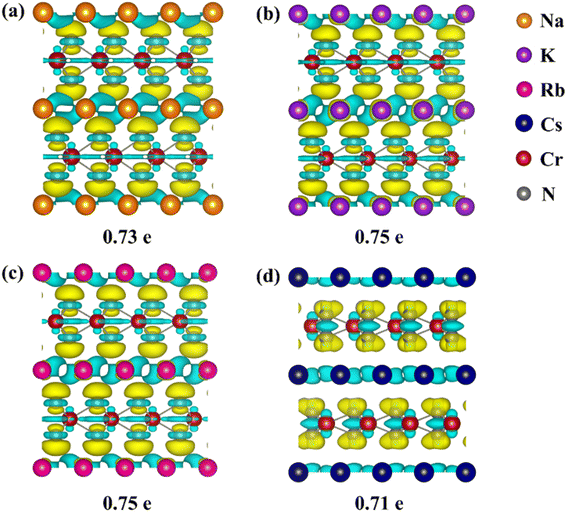
To reveal the mechanism of the effect of alkali metal intercalation on diffusion properties, we studied the charge transfer for CrN2 with alkali metal intercalation. Differential charge density and Bader charge analysis are used to visualize and measure charge transfer, respectively. Fig. 6 shows the differential charge density and charge transfer. The yellow electron-rich regions within the CrN2 layer and the light blue electron-poor regions between the layers indicate that electrons are transferred from the intercalated atoms to CrN2. For all alkali metals, the number of lost electrons is almost equal (about 0.71–0.75 e), indicating that the amount of charge transfer has little effect on the diffusion barrier. Furthermore, the coupling pattern changes because of increasing interlayer spacing with a radius of intercalated atoms increasing. Moreover, we have calculated the band structure of ACrN2 (A = Na, K, Rb and Cs) projected onto N with different orbital symmetries and the projected density of states for N atoms, as shown in Fig. S7.† For CrN2 with Na, K and Rb intercalation, the electrons transfer from s orbital of alkali metal atoms to out-of-plane pz orbital of N atoms, which shows interlayer coupling. In contrast, For CrN2 with Cs intercalation, the electrons transfer from s orbital of Cs atoms to in-plane px/y orbital of N atoms, which shows intralayer coupling. Therefore, there is a strong coupling between the alkali metal and N atoms for Na, K and Rb intercalation but a weak coupling for Cs intercalation. This result is coincident with the foregoing analysis of differential charge density. Therefore, the distinct decreases of diffusion barrier are mainly induced by the transition from interlayer coupling to intralayer coupling.
To further investigate the effect of Cs intercalation on the electronic properties of CrN2, we calculated the band structure and density of states of CrN2 before intercalation and after Cs intercalation, respectively, as shown in Fig. 7. In band structure, it is shown that both CrN2 and CsCrN2 exhibit metallicity, which endows them with a fast charge and discharge rate. According to the total density of states near the Fermi level, both of them are antiferromagnetic. Moreover, the density of states far from the Fermi level in the conductive band moves close to the Fermi level after Cs embeds, which increases the carrier concentration. Charge carriers of higher concentrations enhance the conductivity and further improve the charge and discharge rate so that the CrN2 with Cs embedded exhibits excellent rate performance.
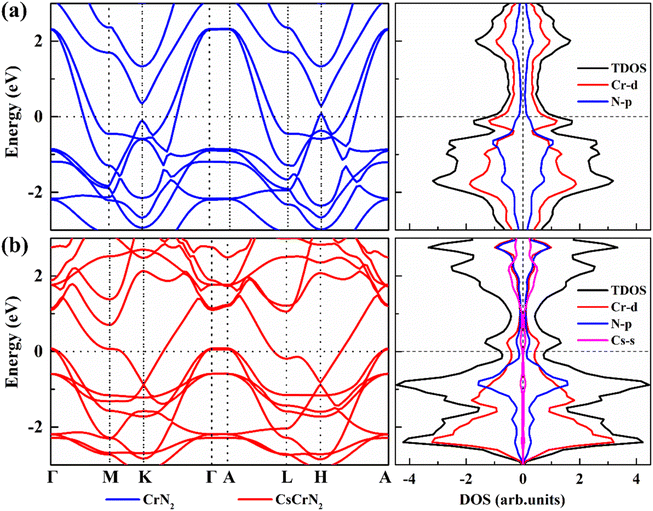 | ||
| Fig. 7 Band structure and density of states of (a) CrN2 and (b) CsCrN2. The Fermi level is set to 0. | ||
4. Conclusions
In conclusion, based on the first-principles calculation, we have theoretically studied the relationship between the strain and the diffusion barrier/path of sodium ions in layered CrN2. Our results show that all of A1/16CrN2 (A = Ca, Sr, Ba, K, Rb, and Cs) generate a large strain that causes a large interlayer spacing of over 3.2 Å arising from the large ionic radius of alkaline earth metal and alkali metal embedding. In particular, Cs1/16CrN2 takes on a 4.5 Å interlayer spacing, thus it boasts an extremely low barrier of 0.04 eV. Moreover, the Na diffusion path changes with the increase of interlayer spacing. Importantly, the decrease of the barrier is primarily due to the transition from the interlayer to intralayer electronic coupling with the increasing interlayer spacing. Finally, the high theoretical capacity (285 mA h g−1) and the high voltage platform (3.0–3.9 V) of Cs1/16CrN2 reveal it as an excellent cathode material for SIBs. Above all, Cs intercalating not only makes CrN2 obtain an ultra-low barrier but also improves its electrochemical performance. Our research provides a very effective approach to designing cathode materials with excellent performance for SIBs.Conflicts of interest
There are no conflicts of interest to declare.Acknowledgements
This work is supported by the National Natural Science Foundation of China (No. 11604278, 52073243, 12204398). National Key Research and Development Program of China (2020YFA0714703). The science and technology innovation Program of Hunan Province (2020RC1009, 2022RC3027). Xiangtan Science and Technology Bureau (ZD-ZD20211002).Notes and references
- M. Li, J. Lu, Z. Chen and K. Amine, Adv. Mater., 2018, 30, 1800561 CrossRef PubMed.
- D. Di Lecce, R. Verrelli and J. Hassoun, Green Chem., 2017, 19, 3442–3467 RSC.
- K. Chayambuka, G. Mulder, D. L. Danilov and P. H. L. Notten, Adv. Energy Mater., 2020, 10, 2001310 CrossRef CAS.
- D. Kundu, E. Talaie, V. Duffort and L. F. Nazar, Angew. Chem., Int. Ed. Engl., 2015, 54, 3431–3448 CrossRef CAS PubMed.
- C. Vaalma, D. Buchholz, M. Weil and S. Passerini, Nat. Rev. Mater., 2018, 3, 18013 CrossRef.
- Z. Dai, U. Mani, H. T. Tan and Q. Yan, Small Methods, 2017, 1, 1700098 CrossRef.
- Z.-X. Huang, Z.-Y. Gu, Y.-L. Heng, E. Huixiang Ang, H.-B. Geng and X.-L. Wu, Chem. Eng. J., 2023, 452, 139438 CrossRef CAS.
- K. Kubota, S. Kumakura, Y. Yoda, K. Kuroki and S. Komaba, Adv. Energy Mater., 2018, 8, 1703415 CrossRef.
- L. Xiao, F. Ji, J. Zhang, X. Chen and Y. Fang, Small, 2023, 19, e2205732 CrossRef PubMed.
- Q. Liu, Z. Hu, M. Chen, C. Zou, H. Jin, S. Wang, S. L. Chou, Y. Liu and S. X. Dou, Adv. Funct. Mater., 2020, 30, 1909530 CrossRef CAS.
- F. Wei, Q. Zhang, P. Zhang, W. Tian, K. Dai, L. Zhang, J. Mao and G. Shao, J. Electrochem. Soc., 2021, 168, 050524 CrossRef CAS.
- P. Ge, L. Zhang, Y. Yang, W. Sun, Y. Hu and X. Ji, Adv. Mater. Interfaces, 2019, 7, 1901651 CrossRef.
- E. Yang, H. Ji and Y. Jung, J. Phys. Chem. C, 2015, 119, 26374–26380 CrossRef CAS.
- L. Shi and T. Zhao, J. Mater. Chem. A, 2017, 5, 3735–3758 RSC.
- A. Ghosh, S. Pal and P. Sarkar, J. Phys. Chem. C, 2022, 126, 5092–5100 CrossRef CAS.
- P.-F. Wang, Y. You, Y.-X. Yin and Y.-G. Guo, Adv. Energy Mater., 2018, 8, 1701912 CrossRef.
- M. Feng, M. Zhang, H. Zhang, X. Liu and H. Feng, Carbon, 2019, 153, 217–224 CrossRef CAS.
- Z. Liu, H. Deng, S. Zhang, W. Hu and F. Gao, J. Mater. Chem. A, 2018, 6, 3171–3180 RSC.
- X. J. Ye, J. Xu, Y. D. Guo and C. S. Liu, Phys. Chem. Chem. Phys., 2021, 23, 4386–4393 RSC.
- J. Zeng, J. Huang, J. Liu, T. Xie, C. Peng, Y. Lu, P. Lu, R. Zhang and J. Min, Carbon, 2019, 154, 24–32 CrossRef CAS.
- X. Zhang, Z. Yu, S.-S. Wang, S. Guan, H. Y. Yang, Y. Yao and S. A. Yang, J. Mater. Chem. A, 2016, 4, 15224–15231 RSC.
- J. Xu, D. Wang, Y. Liu, R. Lian, X. Gao, G. Chen and Y. Wei, J. Mater. Chem. A, 2019, 7, 26858–26866 RSC.
- G. Liu, S. Xu, L. Wu, J. Zhang, Q. Wang and P. Lu, Mater. Chem. Phys., 2020, 250, 123028 CrossRef CAS.
- Y. Jiang, W. Xu, W. Zhao and J. Cao, RSC Adv., 2022, 12, 34200–34207 RSC.
- P. Xiong, F. Zhang, X. Zhang, S. Wang, H. Liu, B. Sun, J. Zhang, Y. Sun, R. Ma, Y. Bando, C. Zhou, Z. Liu, T. Sasaki and G. Wang, Nat. Commun., 2020, 11, 3297 CrossRef CAS PubMed.
- C. Zhang, R. Gao, L. Zheng, Y. Hao and X. Liu, ACS Appl. Mater. Interfaces, 2018, 10, 10819–10827 CrossRef CAS PubMed.
- G. Kresse and J. Furthmuller, Phys. Rev. B: Condens. Matter Mater. Phys., 1996, 54, 11169–11186 CrossRef CAS PubMed.
- G. Kresse and D. Joubert, Phys. Rev. B: Condens. Matter Mater. Phys., 1999, 59, 1758–1775 CrossRef CAS.
- J. P. Perdew, K. Burke and M. Ernzerhof, Phys. Rev. Lett., 1996, 77, 3865–3868 CrossRef CAS PubMed.
- H. J. Kulik, M. Cococcioni, D. A. Scherlis and N. Marzari, Phys. Rev. Lett., 2006, 97, 103001 CrossRef PubMed.
- M. Cococcioni and S. de Gironcoli, Phys. Rev. B: Condens. Matter Mater. Phys., 2005, 71, 035105 CrossRef.
- N. Marom, A. Tkatchenko, M. Rossi, V. V. Gobre, O. Hod, M. Scheffler and L. Kronik, J. Chem. Theory Comput., 2011, 7, 3944–3951 CrossRef CAS PubMed.
- G. Henkelman, B. P. Uberuaga and H. Jónsson, J. Chem. Phys., 2000, 113, 9901–9904 CrossRef CAS.
- D. Datta, J. Li and V. B. Shenoy, ACS Appl. Mater. Interfaces, 2014, 6, 1788–1795 CrossRef CAS PubMed.
- I. A. Courtney, J. S. Tse, O. Mao, J. Hafner and J. R. Dahn, Phys. Rev. B: Condens. Matter Mater. Phys., 1998, 58, 15583–15588 CrossRef CAS.
- H. H. Huang, X. Fan, D. J. Singh and W. T. Zheng, Nanoscale, 2020, 12, 1247–1268 RSC.
- T. Jin, H. Li, K. Zhu, P. F. Wang, P. Liu and L. Jiao, Chem. Soc. Rev., 2020, 49, 2342–2377 RSC.
- Y. Lyu, Y. Liu, Z.-E. Yu, N. Su, Y. Liu, W. Li, Q. Li, B. Guo and B. Liu, Sustainable Mater. Technol., 2019, 21, e00098 CrossRef CAS.
Footnote |
| † Electronic supplementary information (ESI) available: The details of setting the magnetic order and the U value were put in ESI. Fig. S1 shows the four magnetic orders of the calculated system. Fig. S2 is a linear fit of the number of d-electrons on Cr as a function of the additional potential φ. The results of phonon spectrum and AIMD calculations are shown in Fig. S3. The relationship between the diffusion barrier and c-axis strain along two different diffusion paths were shown in Fig. S4. Fig. S5 gives the energy profile of sodium ions along the diffusion path in CrN2 without intercalation. Fig. S6 shows the most stable configuration of NaxCs1/16CrN2 (x = 0–1) under different sodium concentrations. Fig. S7 shows the projected band (PBAND) and projected density of states (PDOS) for N in ACrN2 (A = Na, K, Rb and Cs). See DOI: https://doi.org/10.1039/d3ra00434a |
| This journal is © The Royal Society of Chemistry 2023 |

