 Open Access Article
Preparation of UV-curable PSAs by grafting isocyanate-terminated photoreactive monomers and the effect of the functionality of grafted monomers on the debonding properties on Si wafers
Hee-Woong Parka,
Hyun-Su Seoa,
Kiok Kwon a and
Seunghan Shin
 *ab
*ab
aGreen Chemistry & Materials Group, Korea Institute of Industrial Technology (KITECH), Cheonan, Chungnam 31056, Republic of Korea. E-mail: shshin@kitech.re.kr
bDepartment of Green Process and System Engineering, University of Science & Technology (UST), Daejeon 34113, Republic of Korea
First published on 17th April 2023
Abstract
Photoreactive pressure-sensitive adhesives (PSAs) were prepared by grafting mono- or difunctional photoreactive monomers onto acrylic PSA, and their adhesion properties were evaluated before and after ultraviolet (UV) curing for application as dicing tape. In this study, the NCO-terminated difunctional photoreactive monomer (NDPM) was newly synthesized and compared with 2-acryloxyloxyethyl isocyanate (AOI), a monofunctional monomer. The 180° peel strengths of pristine and photoreactive PSAs were similar before UV curing (1850–2030 gf/25 mm). After UV curing, the 180° peel strengths of the photoreactive PSAs decreased significantly and converged to nearly zero. When a UV dose of 200 mJ cm−2 was used, the 180° peel strength of 40% NDPM-grafted PSA decreased to 8.40 gf/25 mm, which was much lower than that of 40% AOI-grafted PSA (39.26 gf/25 mm). NDPM-grafted PSA also showed that its storage modulus shifted more to the upper right side of Chang's viscoelastic window than AOI-grafted PSA, and this is because NDPM provided a higher degree of crosslinking than AOI. Furthermore, SEM-EDS analysis showed that UV-cured NDPM-grafted PSA retained almost no residue on the silicon wafer after debonding.
1. Introduction
A pressure-sensitive adhesive (PSA) adheres to a substrate with only light pressure without additional chemical reaction due to its unique viscoelastic properties.1–5 Acrylic PSA is one of the most widely used PSAs throughout industry because it is easily fabricated into various types depending on the acrylic monomer and its composition and has a low price, high light transmittance and resistance to water and oxidation.6–8 Based on these advantages, many attempts have recently been made to use an acrylic PSA as a dicing tape.Dicing tape is used for fixing a silicon wafer in a dicing process. During the dicing process, a high peel force for the wafer is needed, but after dicing, easy peeling for picking up the chips and low residue are needed. To complete these requirements, UV-curable PSA has been developed and widely used.9,10 UV-curable PSA is normally prepared with an acrylate copolymer-based PSA containing a photoreactive group. After UV curing, its modulus greatly increases due to the crosslink of the photoreactive group of PSA, and thereby, the adhesion decreases sharply.11
A common method of making UV-curable PSA is to mix an acrylic polymer with a multifunctional oligomer/acrylate monomer. After UV curing, it forms a semi-IPN structure.10–14 However, this method has some problems, such as compatibility, low cohesion, and high residue on a silicon wafer, due to the addition of low-molecular-weight substances.11,15,16 Another method is similar to the previous method except it uses a crosslinked acrylic polymer. This UV-curable PSA forms an IPN structure and has improved compatibility, cohesion strength, and low residue on a silicon wafer.17,18 However, compared to the previous method, this method has a relatively low adhesion before UV curing and still has a residue problem due to the unreacted low-molecular-weight additives.
To solve these problems, a photocurable functional group was directly grafted onto the acrylic polymer chain. Ryu et al. reported that extremely low peel strength and residue level were achieved by UV curing after introducing a photocurable functional group through a ring opening reaction of acrylic acid and glycidyl methacrylate in an acrylic polymer.16 However, the initial adhesive strength decreased as the amount of acrylic acid increased. Recently, Han et al. reported that isocyanatoethyl methacrylate (IEM) was introduced through a urethane reaction to a hydroxyl group in the acrylic polymer and achieved excellent debonding properties upon UV irradiation for 40 s.19 Although multifunctional acrylate has the advantage of providing high crosslink density and fast crosslinking in the UV-curing process,18,20 there have been few studies of the direct grafting of multifunctional acrylate onto acrylic polymer chains. Therefore, the purpose of this study was to enhance the efficiency of UV-curable acrylic PSA by incorporating multifunctional acrylate groups with favourable properties into the acrylic PSA. The ultimate goal was to achieve desirable easy-to-peel properties, characterized by reduced peel strength and minimal residue after UV exposure.
In this study, a novel NCO-terminated difunctional photoreactive monomer (NDPM) was synthesized with the expectation that it could induce a higher degree of crosslinking and lower adhesion and residue levels after UV curing than a monofunctional photoreactive monomer. To verify this, two different monomers, NDPM (difunctional monomer (f = 2)) and 2-acryloxyloxyethyl isocyanate (AOI, monofunctional monomer (f = 1), also called isocyanatoethyl acrylate), were grafted onto acrylic PSA through a urethane reaction. After characterizing the photoreactive PSAs, their 180° peel strength and residue on the silicon wafer before and after UV irradiation were evaluated by changing the types of photoreactive monomers and graft amounts. Chang's viscoelastic window of photoreactive PSAs was drawn to compare the changes in their adhesion performance by grafting and UV curing.
2. Experimental
2.1. Materials
2-Ethylhexyl acrylate (2-EHA, 98%), 2-hydroxyethyl acrylate (2-HEA, 96%), isobornyl acrylate (IBA, >85%), azobisisobutyronitrile (AIBN, 12 wt% in acetone), ethyl acetate (EA, 99.5%), hexane (HX, 99.5%), tetrahydrofuran (THF, 99.9%), isophorone diisocyanate (IPDI, 98%), and dibutyltin dilaurate (DBTDL, 95%) were purchased from Aldrich (St. Louis, MO, USA). 2-Isocyanatoethyl acrylate (AOI, 98%) and 1-(acryloyloxy)-3-(methacryloyloxy)-2-propanol (AMP, >80%) were purchased from Tokyo Chemical Industry Co., Ltd. (Tokyo, Japan). Irgacure 907 (photoinitiator, 2-methyl-4-methylthio-2-morpholinopropiophenone, 98%) was supplied by BASF Co., Ltd. (Ludwigshafen, Germany). All chemicals were used without purification.2.2. Synthesis procedure of the NCO-terminated difunctional photoreactive monomer (NDPM)
NDPM was synthesized by inducing a urethane reaction between IPDI and AMP, and the procedure was as follows (see Fig. 1). A 250 mL round bottom flask in a nitrogen atmosphere equipped with a mechanical stirrer was prepared. IPDI (51.88 g 0.23 mol), DBTDL (0.10 g, 0.1 wt%), and EA (101.88 g, solvent) were added to the flask and stirred for 10 min. Then, the temperature was increased to 50 °C, and APM (50.00 g 0.23 mol) was slowly added dropwise over 2 h. After additional stirring for 1 h, the reaction was terminated by allowing the mixture to cool to room temperature. Column chromatography (EA![[thin space (1/6-em)]](https://www.rsc.org/images/entities/char_2009.gif) :
:![[thin space (1/6-em)]](https://www.rsc.org/images/entities/char_2009.gif) HX = 1
HX = 1![[thin space (1/6-em)]](https://www.rsc.org/images/entities/char_2009.gif) :
:![[thin space (1/6-em)]](https://www.rsc.org/images/entities/char_2009.gif) 2) was used for purification, and the product was obtained as a colourless oil (yield = 46%). 1H NMR (300 MHz, CDCl3): 6.55–5.55 (m, 5H, C
2) was used for purification, and the product was obtained as a colourless oil (yield = 46%). 1H NMR (300 MHz, CDCl3): 6.55–5.55 (m, 5H, C![[double bond, length as m-dash]](https://www.rsc.org/images/entities/char_e001.gif) C), 5.44–5.22 (m, 1H, CH), 4.48–4.20 (m, 4H, CH2), 3.93–3.61 (m, 1H, CH), 3.56–2.97 (m, 2H, CH2), 2.07–2.04 (s, 3H, CH3), 1.98–1.51 (m, 2H, CH2), 1.34–0.85 (m, 13H, CH2, CH3).
C), 5.44–5.22 (m, 1H, CH), 4.48–4.20 (m, 4H, CH2), 3.93–3.61 (m, 1H, CH), 3.56–2.97 (m, 2H, CH2), 2.07–2.04 (s, 3H, CH3), 1.98–1.51 (m, 2H, CH2), 1.34–0.85 (m, 13H, CH2, CH3).
2.3. Synthesis of control acrylic PSA (Control PSA)
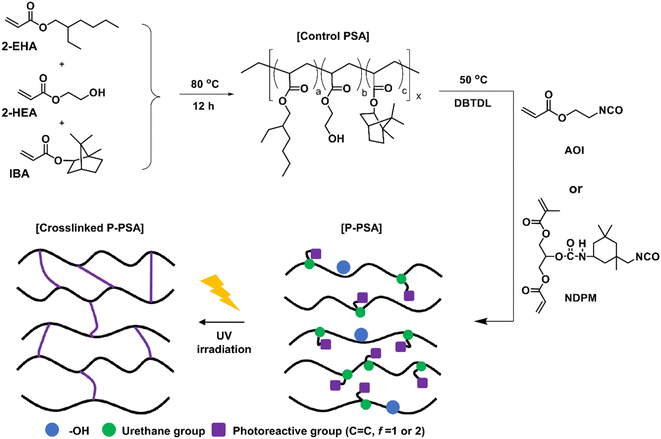
Control PSA was synthesized according to our previous study,8 and the procedure was as follows (see Fig. 2). A 2000 mL round bottom flask in a nitrogen atmosphere equipped with a condenser and a mechanical stirrer was prepared. 2-EHA (325 g, 1.76 mol), 2-HEA (75 g 0.65 mol), IBA (100 g, 0.48 mol), and EA (500 g, solvent) were added to the flask and stirred at 80 °C for 15 min. A thermal initiator (AIBN 12 wt% solution, 4.17 g, 0.1 wt% acrylic monomers) was diluted in a small amount of EA and then slowly added dropwise over 1 h. After additional stirring for 12 h, the reaction was terminated by cooling to room temperature, and the final solid contents were adjusted to 50%.2.4. Synthesis of photoreactive pressure-sensitive adhesives
Photoreactive PSAs were synthesized using a urethane reaction between Control PSA and NCO-terminated photoreactive monomers (Fig. 2) by changing the amount of NCO-terminated photoreactive monomers. The detailed composition is shown in Table 1. The photoreactive PSAs were named PSA-Ax or PSA-Nx, where A is AOI, N is NDPM, and x is the mol% of photoreactive monomer to the hydroxyl groups in PSA. For example, PSA-A10 designates the PSA whose 10 mol% hydroxyl groups are grafted with AOI.| Sample | Control PSA (50 wt%, g) | Monomer | DBTDL (part) | |||
|---|---|---|---|---|---|---|
| Type | Amount | mol% (–OH in Control PSA) | ||||
| g | mmol | |||||
| Control PSA | — | — | — | 0 | — | |
| PSA-A10 | 50.00 (OH = 32.29 mmol) | AOI | 0.46 | 3.22 | 10 | 0.1 |
| PSA-A20 | 0.91 | 6.46 | 20 | |||
| PSA-A40 | 1.82 | 12.91 | 40 | |||
| PSA-A70 | 3.19 | 22.60 | 70 | |||
| PSA-A100 | 4.56 | 32.29 | 100 | |||
| PSA-N10 | 50.00 (OH = 32.29 mmol) | NDPM | 1.41 | 3.22 | 10 | 0.1 |
| PSA-N20 | 2.82 | 6.46 | 20 | |||
| PSA-N40 | 5.64 | 12.91 | 40 | |||
| PSA-N70 | 9.87 | 22.60 | 70 | |||
| PSA-N100 | 14.10 | 32.29 | 100 | |||
The detailed synthetic procedure is as follows: Control PSA solution (50 g, 50 wt% solution) was put into a 250 mL round bottom flask in a nitrogen atmosphere equipped with a mechanical stirrer, and the solution was stirred at 50 °C for 10 min. After that, NCO-terminated photoreactive monomer (AOI or NDPM) and DBTDL (0.1 part) were dissolved in EA and slowly added dropwise over 1 h. After 1 h of additional stirring, the reaction was terminated by cooling the reaction mixture to room temperature, and the final solid contents were adjusted to 50%.
2.5. Preparation of photoreactive pressure-sensitive adhesive tape
PSA tape was prepared as follows: to 20 g of PSA solution (50% solid, 10 g of PSA polymer), 0.1 g of Irgacure 907 was added, and the resulting mixture was coated on a corona-treated PET film (0.1 mm thickness) using a Baker applicator. After leaving the coating film at room temperature for 1 h, it was placed in an oven and dried at 80 °C for 20 min and at 35 °C for 12 h. After that, the sample was protected by covering it with a fluorine release film. The thickness of the dried sample was approximately 25 μm.For further photocuring of the prepared samples, UV irradiation was performed using a conveyor-type UV curing system (LZ-UH402RCH, Lichtzen, Gunpo, Korea). The UV intensity at 365 nm was 100 mW cm−2, and the UV dose was controlled by the UV exposure time. The UV dose was confirmed using a UV Power PUCK II radiometer (EIT 2.0 LLC, Leesburg, VA, USA).
The PSA tape prepared with Control PSA syrup was named Control. Photoreactive PSA tapes were named Ax–y or Nx–y, where A is AOI, N is NDPM, x is the mol% of photoreactive monomer to the hydroxyl groups in PSA and y is UV dose. For example, A40-200 means a tape that is prepared with PSA-A40 syrup and a UV dose of 200 mJ cm−2.
2.6. Characterization
The 1H-NMR spectrum of NDPM was recorded by a Spectrospin 300 (Bruker, Billerica, MA, USA). CDCl3 was used as a solvent. Fourier transform infrared (FT-IR) spectra of PSA and monomer were obtained using a NICOLET 6700 spectrometer (Thermo Fisher Scientific, Waltham, MA, USA). FT-IR samples were prepared by coating a KBr pellet and drying for 12 h at 40 °C under vacuum. The samples were measured in transmittance mode with a measurement range of 650–4000 cm−1, and the resolution was 4 cm−1.The weight-average molecular weight (Mw), number-average molecular weight (Mn) and polydispersity index (PDI) values of the PSA samples were measured using Agilent PL-GPC 220 gel permeation chromatography (GPC) (Agilent Technologies, Santa Clara, CA, USA). The GPC column set was calibrated using polystyrene narrow standards, the operation temperature was 35 °C, and the eluent was THF. The sample was prepared by dissolving it in THF at a concentration of 0.1 wt%.
The 180° peel strength was measured using the SurTA system (ChemiLab, Suwon, Korea). The PSA tape was cut into 60 mm × 100 mm pieces and attached to a silicon wafer. It was rolled twice with a 2 kg roller, left at room temperature for 10 min, and peel strength was then measured at a peeling speed of 300 mm min−1. Measurements were repeated at least 3 times.
The viscoelastic properties (storage modulus, loss modulus, tan delta) of PSAs were measured using an MCR 102 rheometer (Anton Paar, Graz, Austria). The sample was placed on a round plate (8 mm in diameter), and the gap between plates was set to 0.75 mm. The strain was 0.1%, and the plate was twisted in the frequency range from 0.01 to 100 Hz at 25 °C.
The gel fraction was measured using an extraction method. One gram of sample (W0) was wrapped in stainless steel woven wire mesh (#20 mesh). After that, the prepared sample was put in an EA at 40 °C and stirred for 24 h. The solid remaining after filtering was dried in an 80 °C vacuum oven until it reached a constant weight, and the weight (W1) was recorded. The gel fraction was calculated by the following equation: gel fraction (%) = (W1/W0) × 100. Measurements were repeated at least 3 times.
The surface residue on the silicon wafer after peel strength measurement was observed using field-emission scanning electron microscopy (FE-SEM, JSM 6701F, JEOL, Tokyo, Japan) equipped with an energy dispersive X-ray spectrometer (EDS). After cutting the sample to an appropriate size, sputtering was performed for 30 s using a sputter coater 108 auto (Cressington Scientific Instruments, Watford, UK). The magnification was 140×.
3. Results and discussion
3.1. Characterization of NDPM
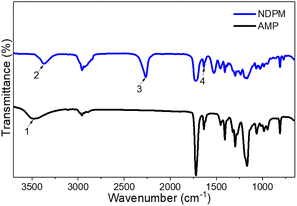
NDPM was synthesized by inducing a urethane reaction under the DBTDL catalyst using IPDI and AMP. As seen from the chemical structure of IPDI, the reactivity of primary aliphatic isocyanate and secondary cycloaliphatic isocyanate are different. According to Lomölder et al., the reactivity of secondary cycloaliphatic isocyanate is particularly high with the DBTDL catalyst.21 Furthermore, AMP will react more selectively with the secondary cycloaliphatic isocyanate of IPDI because it has a secondary hydroxyl group.After purification by column chromatography, the chemical structure of NDPM was confirmed by FT-IR and 1H-NMR spectra. Fig. 3 shows the FT-IR spectra of NDPM and AMP. The NDPM spectrum did not show the –OH peak (3500 cm−1) of AMP but showed new NH (3300 cm−1) and NCO (2250 cm−1) peaks. The C![[double bond, length as m-dash]](https://www.rsc.org/images/entities/char_e001.gif) C (1640 cm−1) peaks were observed in both compounds.
C (1640 cm−1) peaks were observed in both compounds.
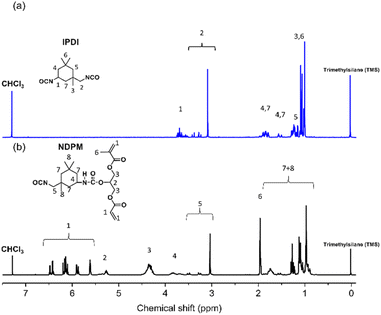
Fig. 4 shows the 1H-NMR spectra of IPDI and NDPM. Peaks observed at 3.54–2.99 (m, 2H) ppm are assigned to the CH2 linkage between the primary isocyanate and the alicyclic ring. These peaks did not change after the urethane reaction (compared with IPDI peak 2). Considering the NMR spectrum and Lomölder et al.'s paper together, the chemical structure of NDPM was confirmed, as displayed in Fig. 4. Based on the FT-IR and 1H-NMR spectra analysis, it was confirmed that NDPM was successfully synthesized.
3.2. Characterization of the photoreactive pressure-sensitive adhesives
To prepare photoreactive PSAs, two different photoreactive monomers (AOI, NDPM) were introduced by reacting with the hydroxyl group of Control PSA. Their input amount was adjusted from 10 to 100% of the moles of hydroxyl groups in the Control PSA.Reaction monitoring was performed using FT-IR (Fig. 5). As the mol% of photoreactive monomers increased, the –OH peak (3500 cm−1) decreased, and the –NH (3300 cm−1) and C![[double bond, length as m-dash]](https://www.rsc.org/images/entities/char_e001.gif) C (1640 cm−1) peaks increased. In addition, it is considered that photoreactive PSA was successfully synthesized because the NCO (2250 cm−1) peak completely disappeared after the reaction was completed.
C (1640 cm−1) peaks increased. In addition, it is considered that photoreactive PSA was successfully synthesized because the NCO (2250 cm−1) peak completely disappeared after the reaction was completed.
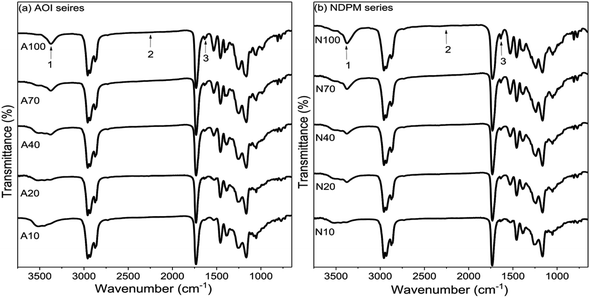 | ||
Fig. 5 FT-IR spectra of (a) AOI-grafted PSAs and (b) NDPM-grafted PSAs, where peak 1 is NH (urethane) stretching, peak 2 is NCO stretching, and peak 3 is C![[double bond, length as m-dash]](https://www.rsc.org/images/entities/char_e001.gif) C stretching. C stretching. | ||
Table 2 shows the basic information of the synthesized photoreactive PSAs and pristine PSA. The molecular weight of photoreactive PSA slightly increased according to the mol% of the photoreactive monomer. It seems to be slightly increased by the additional heating and stirring conditions, but it did not change significantly compared to the pristine PSA. Additionally, the gel fraction of photoreactive PSA was similar to that of pristine PSA (2∼5%). This means that heat crosslinking hardly occurred during the grafting reaction with pristine PSA, and this result was consistent with the result by Han et al.19
| Sample code | Photo-reactive monomer | Mol (%) (based on –OH in Control PSA) | Mn (g mol−1) | Mw (g mol−1) | PDI | Gel fraction (%) |
|---|---|---|---|---|---|---|
| Control PSA | — | 0 | 234![[thin space (1/6-em)]](https://www.rsc.org/images/entities/char_2009.gif) 000 000 |
585![[thin space (1/6-em)]](https://www.rsc.org/images/entities/char_2009.gif) 000 000 |
2.50 | 1.95 |
| PSA-A10 | AOI | 10 | 233![[thin space (1/6-em)]](https://www.rsc.org/images/entities/char_2009.gif) 000 000 |
588![[thin space (1/6-em)]](https://www.rsc.org/images/entities/char_2009.gif) 000 000 |
2.52 | 2.14 |
| PSA-A20 | 20 | 234![[thin space (1/6-em)]](https://www.rsc.org/images/entities/char_2009.gif) 000 000 |
596![[thin space (1/6-em)]](https://www.rsc.org/images/entities/char_2009.gif) 000 000 |
2.54 | 1.98 | |
| PSA-A40 | 40 | 239![[thin space (1/6-em)]](https://www.rsc.org/images/entities/char_2009.gif) 000 000 |
606![[thin space (1/6-em)]](https://www.rsc.org/images/entities/char_2009.gif) 000 000 |
2.53 | 2.22 | |
| PSA-A70 | 70 | 245![[thin space (1/6-em)]](https://www.rsc.org/images/entities/char_2009.gif) 000 000 |
620![[thin space (1/6-em)]](https://www.rsc.org/images/entities/char_2009.gif) 000 000 |
2.54 | 2.41 | |
| PSA-A100 | 100 | 254![[thin space (1/6-em)]](https://www.rsc.org/images/entities/char_2009.gif) 000 000 |
623![[thin space (1/6-em)]](https://www.rsc.org/images/entities/char_2009.gif) 000 000 |
2.45 | 2.54 | |
| PSA-N10 | NDPM | 10 | 231![[thin space (1/6-em)]](https://www.rsc.org/images/entities/char_2009.gif) 000 000 |
599![[thin space (1/6-em)]](https://www.rsc.org/images/entities/char_2009.gif) 000 000 |
2.59 | 1.99 |
| PSA-N20 | 20 | 249![[thin space (1/6-em)]](https://www.rsc.org/images/entities/char_2009.gif) 000 000 |
619![[thin space (1/6-em)]](https://www.rsc.org/images/entities/char_2009.gif) 000 000 |
2.48 | 2.06 | |
| PSA-N40 | 40 | 250![[thin space (1/6-em)]](https://www.rsc.org/images/entities/char_2009.gif) 000 000 |
620![[thin space (1/6-em)]](https://www.rsc.org/images/entities/char_2009.gif) 000 000 |
2.48 | 2.13 | |
| PSA-N70 | 70 | 242![[thin space (1/6-em)]](https://www.rsc.org/images/entities/char_2009.gif) 000 000 |
617![[thin space (1/6-em)]](https://www.rsc.org/images/entities/char_2009.gif) 000 000 |
2.55 | 2.31 | |
| PSA-N100 | 100 | 259![[thin space (1/6-em)]](https://www.rsc.org/images/entities/char_2009.gif) 000 000 |
637![[thin space (1/6-em)]](https://www.rsc.org/images/entities/char_2009.gif) 000 000 |
2.45 | 4.66 |
3.3. Adhesion properties of photoreactive PSAs
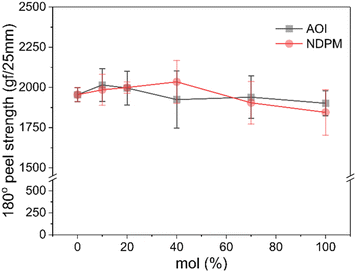
The 180° peel strength results of the photoreactive PSAs are shown in Fig. 6. The failure mode of all samples is adhesive failure. As the amount of photoreactive monomer increases, it is expected that the cohesive force of PSA decreases as the free volume increases by grafting. However, as displayed in Fig. 6, the peel strength hardly changed with the content and type of photoreactive monomer, but it seemed to decrease slightly at high content. Most of the photoreactive PSAs showed peel strength similar to that of the Control PSA (1850–2030 vs. 1954 gf/25 mm).Fig. 7 shows the 180° peel strength results according to the UV dose. The peel strength of photoreactive PSA decreased dramatically due to chemical crosslinking caused by UV irradiation, and the adhesive strength converged to zero as the amount of photoreactive monomer approached 100 mol%. In particular, the decrease in peel strength of NDPM-grafted PSA (N series) was larger than that of AOI-grafted PSA (A series).
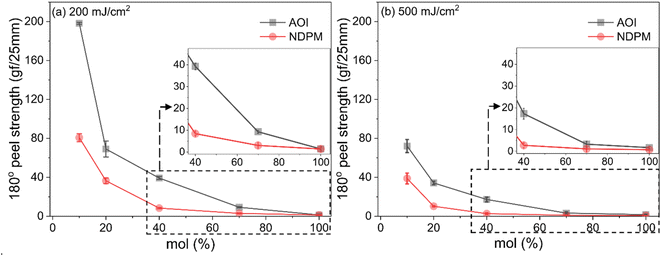 | ||
| Fig. 7 180° peel strength of photoreactive PSA as a function of degree of grafting cured at (a) UV dose of 200 mJ cm−2 and (b) 500 mJ cm−2. The inset shows peel strengths in the range of 40–100 mol%. | ||
At a UV dose of 200 mJ cm−2, NDPM showed less than half of the peel strength compared to AOI. When 40 mol% NDPM was introduced, the peel strength was decreased to one-fifth of that of AOI-grafted PSA (39.26 vs. 8.40 gf/25 mm). At 500 mJ cm−2, the peel strength decreased faster, and the peel strength approached almost zero at 40 mol% NDPM (2.74 gf/25 mm). This is because NDPM has twice as many photoreactive groups per mole as AOI, so the degree of crosslinking of NDPM-grafted PSA will be higher than that of AOI-grafted PSA even with the same content. Fig. 8 shows the gel fraction of photoreactive PSA grafted with NDPM or AOI as a function of grafting ratio and UV dose. At a high grafting ratio (more than 70%, red box in Fig. 8), the gel fraction of photoreactive PSA was similar irrespective of the photoreactive monomers. However, there was a noticeable difference at a low grafting ratio (less than 40%, blue box in Fig. 8). NDPM induced a higher gel fraction with a relatively smaller amount compared with AOI.
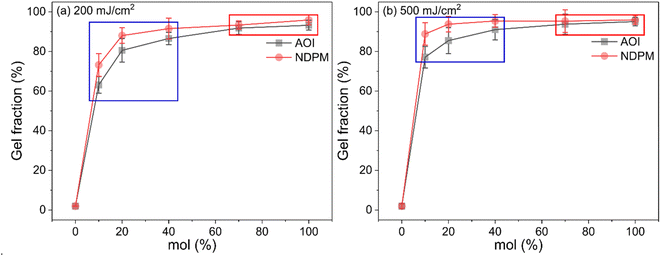 | ||
| Fig. 8 Gel fraction of photoreactive PSA as a function of the degree of grafting cured at (a) UV doses of 200 mJ cm−2 and (b) 500 mJ cm−2. | ||
Fig. 8 shows the gel fraction of photoreactive PSA grafted with NDPM or AOI as a function of grafting ratio and UV dose. At a high grafting ratio (more than 70%, red box in Fig. 8), the gel fraction of photoreactive PSA was similar irrespective of the photoreactive monomers. However, there was a noticeable difference at a low grafting ratio (less than 40%, blue box in Fig. 8). NDPM induced a higher gel fraction with a relatively smaller amount compared with AOI.
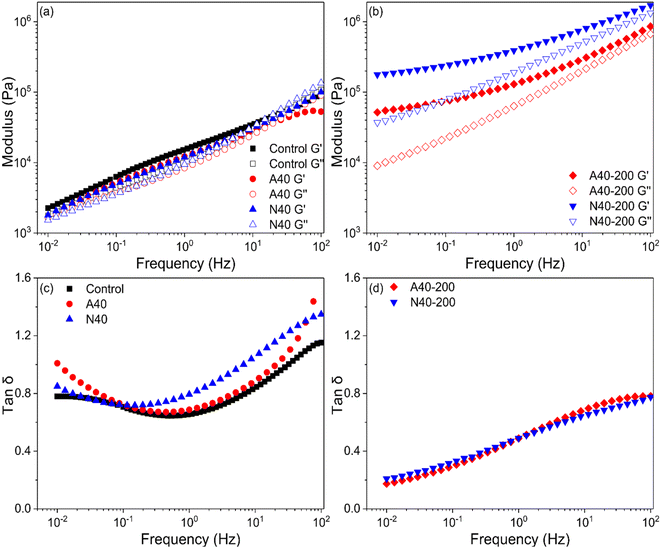
For a better understanding of UV crosslinking in photoreactive PSA tapes, viscoelastic properties (storage modulus G′, loss modulus Gʺ, tan delta) were measured using 40%-grafted PSA (A40 and N40). Rheological tests of PSA provide a good correlation with adhesion properties.22 Because frequency is inversely proportional to time, G′ measured at low and mid frequencies (0.005–0.5 Hz) at the application temperature is related to tack and shear resistance, and G′ measured at high frequency (102 Hz) is related to peel strength.1 In Fig. 9(a) and (b), after UV irradiation (200 mJ cm−2) on A40 and N40, their moduli (G′, Gʺ) were significantly increased; in particular, N40 showed a greater change. This means that NDPM induced a higher crosslinking density than AOI by UV curing.
After UV curing, N40-200 and A40-200 showed that G′ was higher than Gʺ in all frequency ranges, and the crossover point disappeared, which was observed in N40 and A40. In Fig. 9(c) and (d), tan delta also greatly decreased, which indicates that PSA became elastically dominant, which means that it is closer to a solid rather than a liquid. This also means that PSA loses fluidity, and its wettability is greatly reduced. This is in good agreement with the peel strength results described in Fig. 7.
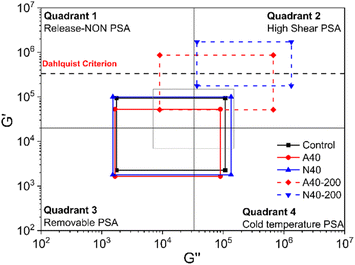
Fig. 10 shows Chang's viscoelastic window of photoreactive PSAs. This can be drawn based on the G′ and Gʺ measured at 10−2 and 102 Hz and help to characterize the PSA.23 Samples before UV curing were mainly located in Quadrant 3, which was close to the use of removable PSA. After UV curing, the windows of A40 and N40 moved to Quadrant 2, where it has high G′ and Gʺ, and the PSA in this area is suitable for high shear PSA applications. In both samples, it seems that the peel strength decreased due to the decrease in wettability as the modulus increased after UV curing. It is well known that PSA requires wettability for adhesion, and this wettability is rheologically possible when its G′ is less than 3.0 × 10⁵ Pa at 25 °C and 1 Hz (Dahlquist criterion).24 In Fig. 10, the G′ of A40-200 and N40-200 at high frequency (102 Hz), which is correlated with the peel test, exceeded the Dahlquist criterion, so it can be considered that the peel strengths of A40-200 and N40-200 almost disappeared. In particular, N40-200 shows higher G′ and Gʺ changes than A40-200, which again confirms that NDPM is more effective in reducing adhesion than AOI.
Surface residues on the silicon wafer after debonding of PSAs were observed using SEM (Fig. 11). In Fig. 11(a)–(c), Control, A40, and N40 residues remained on the silicon wafer. However, after UV irradiation (200 mJ cm−2), the residues of A40 and N40 were significantly reduced due to UV crosslinking (see Fig. 11(e) and (f)). For a more detailed analysis, SEM-EDS analysis was performed, and the results are displayed in Table 3. Compared to the Control, A40 and N40 showed a similar level of residue (carbon% 10–14). However, after UV irradiation, their carbon% decreased to single digit values. In particular, the carbon% of N40-200 was as low as that of the blank (silicon wafer), which means that N40-200 left almost no residue after debonding.
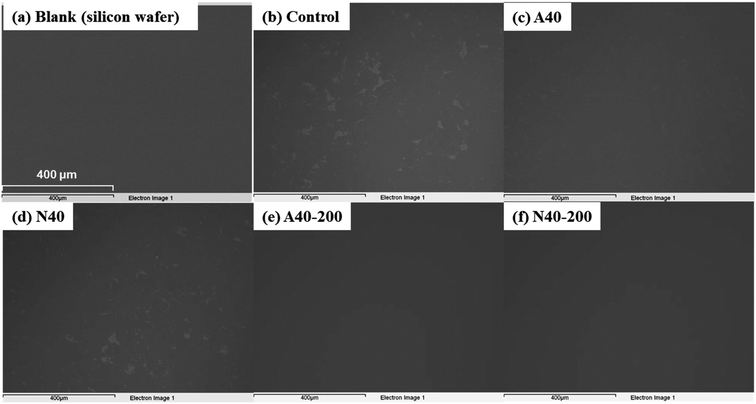 | ||
| Fig. 11 SEM images of silicon wafers after debonding of various photoreactive PSAs; (a) silicon wafer (blank), (b) Control, (c) A40, (d) N40, (e) A40-200, and (f) N40-200 (140× magnification). | ||
| Si (%) | C (%) | O (%) | |
|---|---|---|---|
| Blank (silicon wafer) | 85.49 | 6.20 | 7.44 |
| Control | 78.22 | 14.37 | 6.65 |
| A40 | 82.81 | 10.11 | 6.36 |
| N40 | 78.96 | 12.29 | 6.87 |
| A40-200 | 82.81 | 7.71 | 8.61 |
| N40-200 | 83.88 | 6.62 | 7.92 |
4. Conclusion
In this study, photoreactive PSAs were prepared by grafting photoreactive monomers with different functionalities onto an acrylic copolymer. AOI (f = 1) and NDPM (f = 2), which were newly synthesized through a urethane reaction between IPDI and AMP, were used as NCO-terminated photoreactive monomers and grafted onto the OH groups of the acrylic copolymer. The molecular weight and gel fraction of photoreactive PSAs slightly increased due to the grafting reaction, but the 180° peel strengths of photoreactive PSAs were similar before UV curing (1850–2030 gf/25 mm). However, after UV curing, they decreased significantly and converged to nearly zero. When a UV dose of 200 mJ cm−2 was used, the adhesion strength of N40 decreased to 8.40 gf/25 mm, which was much lower than that of A40 (39.26 gf/25 mm). Chang's viscoelastic window also showed that the G′ at 100 Hz of photoreactive PSA shifted to the upper right side by UV curing. In particular, G′ of N40 moved to quadrant 2 and exceeded the Dahlquist criterion. These results support that NDPM provided a higher degree of crosslinking than AOI due to the multifunctional group effect. SEM-EDS analysis showed that N40 retained almost no residue on the silicon wafer after UV curing. This also suggests that the multifunctional photoreactive monomer is more effective in debonding PSA on the silicon wafer by UV curing without sacrificing the initial adhesion strength. This study will provide meaningful results for preparing a dicing tape for wafer processing.Author contributions
Hee-Woong Park: conceptualization, methodology, validation, investigation, data curation, writing-original draft, formal analysis. Hyun-Soo Seo: methodology, investigation. Kiok Kwon: validation, visualization. Seunghan Shin: conceptualization, writing—review and editing, visualization, supervision, funding acquisition.Conflicts of interest
There are no conflicts to declare.Acknowledgements
This study was supported by the Technology Development Program (S2830047) by the Ministry of SMEs and Startups (MSS) and by Technology Development Project for Safety Management of Household Chemical Products (RE202201671) by the Ministry of Environment (ME), Republic of Korea.References
- D. Satas, Handbook of pressure sensitive adhesive technology, Satas & Associates, Warwick, Rhode Island, 3rd edn, 1989 Search PubMed
.
- M. Zhu, Z. Cao, H. Zhou, Y. Xie, G. Li, N. Wang, Y. Liu, L. He and X. Qu, RSC Adv., 2020, 10, 10277–10284 RSC
.
- A. Li and K. Li, RSC Adv., 2015, 5, 85271 Search PubMed
.
- H. W. Park, J. W. Park, J. H. Lee, H. J. Kim and S. Shin, Eur. Polym. J., 2019, 112, 320–327 CrossRef CAS
.
- Z. Dastjerdi, E. D. Cranston and M. A. Dubé, Int. J. Adhes. Adhes., 2018, 81, 36–42 CrossRef CAS
.
- S. S. Baek and S. H. Hwang, Eur. Polym. J., 2017, 92, 97–104 CrossRef CAS
.
- E. Mehravar, M. A. Gross, A. Agirre, B. Reck, J. R. Leiza and J. M. Asua, Eur. Polym. J., 2018, 98, 63–71 CrossRef CAS
.
- H.-W. Park, H.-S. Seo, J.-H. Lee and S. Shin, Eur. Polym. J., 2020, 137, 109949 CrossRef CAS
.
- K. Ebe, H. Seno and K. Horigome, J. Appl. Polym. Sci., 2003, 90, 436–441 CrossRef CAS
.
- S. W. Lee, J. W. Park, H. J. Kim, K. M. Kim, H. Il Kim and J. M. Ryu, J. Adhes. Sci. Technol., 2012, 26, 317–329 CrossRef CAS
.
- P. Hao, B. Sun, X. Chu, Y. Sun, X. Xing, S. Liu, E. Tang and X. Xu, J. Adhes. Sci. Technol., 2020, 34, 2499–2509 CrossRef CAS
.
- S. W. Lee, J. W. Park, C. H. Park, Y. E. Kwon, H. J. Kim, E. A. Kim, H. S. Woo, S. Schwartz, M. Rafailovich and J. Sokolov, Int. J. Adhes. Adhes., 2013, 44, 200–208 CrossRef CAS
.
- S. W. Lee, J. W. Park, C. H. Park, D. H. Lim, H. J. Kim, J. Y. Song and J. H. Lee, Int. J. Adhes. Adhes., 2013, 44, 138–143 CrossRef CAS
.
- K. Horigome, K. Ebe and S. I. Kuroda, J. Appl. Polym. Sci., 2004, 93, 2889–2895 CrossRef CAS
.
- B. Sun, H. Wang, Y. Fan, X. Chu, S. Liu, S. Zhao and M. Zhao, Prog. Org. Coating, 2022, 163, 106680 CrossRef CAS
.
- C. M. Ryu, B. L. Pang, J. H. Han and H. Il Kim, J. Photopolym. Sci. Technol., 2012, 25, 705–712 CrossRef CAS
.
- P. Hao, T. Zhao, L. Wang, S. Liu, E. Tang and X. Xu, Prog. Org. Coating, 2019, 137, 105281 CrossRef CAS
.
- S. W. Lee, J. W. Park, Y. H. Lee, H. J. Kim, M. Rafailovich and J. Sokolov, J. Adhes. Sci. Technol., 2012, 26, 1629–1643 CrossRef CAS
.
- J. Han, Y. Zhou, G. Bai, W. Wei, X. Liu and X. Li, J. Adhes. Sci. Technol., 2022, 36, 424–436 CrossRef CAS
.
- H. S. Joo, Y. J. Park, H. S. Do, H. J. Kim, S. Y. Song and K. Y. Choi, J. Adhes. Sci. Technol., 2007, 21, 575–588 CrossRef CAS
.
- R. Lomölder, F. Plogmann and P. Speier, J. Coating Technol., 1997, 69, 51–57 CrossRef
.
- E. S. Kim, D. Bin Song, K. H. Choi, J. H. Lee, D. H. Suh and W. J. Choi, J. Polym. Sci., 2020, 58, 3358–3369 CrossRef CAS
.
- E. P. Chang, J. Adhes., 1991, 34, 189–200 CrossRef CAS
.
- S. S. Heddleson, D. D. Hamann and D. R. Lineback, Cereal Chem., 1993, 70, 744–748 Search PubMed
.
| This journal is © The Royal Society of Chemistry 2023 |


