 Open Access Article
Creative Commons Attribution 3.0 Unported Licence
Reaction kinetics, mechanical characteristics, and microstructure of steel slag-cement binder modified with graphene oxide
Qidong Wang ,
Xudong Wang and
Hongxin Liu*
Yuanpei College, Shaoxing University, Shaoxing 312000, China. E-mail: ppag2525ee0dbfe5@sohu.com@e-mail.com; Tel: +86-13754392525
First published on 9th May 2023
Abstract
Graphene oxide (GO) was utilized as an additive to encourage the development of early strength in order to improve steel slag cement's low early strength. This work investigates the compressive strength and setting time of cement paste. The hydration process and its products were explored using hydration heat, low-field NMR, and XRD; in addition, the internal microstructure of the cement was analyzed utilizing MIP, SEM-EDS, and nanoindentation testing technologies. The results demonstrated that the inclusion of SS retarded cement's hydration, leading to a degradation of compressive strength and microstructure. However, the addition of GO was able to accelerate the hydration of steel slag cement, giving rise to a reduction in total porosity, a strengthening of the microstructure, and an improvement in compressive strength, particularly the material developing trends at the early stage. Due to its nucleation and filling capabilities, GO increases the total amount of C–S–H gels present in the matrix, specifically vast amounts of C–S–H gels with high density. It has been established that the addition of GO is capable of greatly enhancing steel slag cement's compressive strength.
1 Introduction
Steel slag powder (SSP) is a common industrial waste derived from iron and steel works. According to reports, the output of steel slag accounts for 15–20% of China's crude steel output, and produces about 80 million tons per year.1,2 A mass of steel slag is landfilled, occupying land resources, even causing serious impact on water resources and the environment, indirectly endangering people's health.3 In developed countries, such as the United States, Australia, Japan, etc., the utilization rate of steel slag is as high as 85–98%. However, the utilization rate of steel slag in China is only 22%.4 Thus, how to effectively utilize steel slag is imminent.Currently, the resource utilization of steel slag mainly includes road and mine landfill, building materials, etc. Among them, building materials are an effective way to improve steel slag utilization rate.5 Since steel slag contains dicalcium silicate (C2S), tricalcium silicate (C3S) and tetra calcium aluminoferrite (C4AF), steel slag has a cement-like hydration process and is considered a potential cementitious material.6 Using SS instead of cement to prepare green cement-based materials can improve its utilization rate, and the use of SS can reduce the amount of cement and carbon dioxide emissions.7 Costa et al. discovered that every ton of clinker saved could reduce 0.83 tons of carbon dioxide emissions and save 3.7 GJ of energy.8 Dong et al.9 discovered that using steel slag as aggregate to fabricate concrete could meet engineering requirements to some extent, However, the expansion caused by f-CaO and f-MgO in steel slag limits its engineering application. Fortunately, cement prepared with steel slag has better wear resistance, and a reasonable proportion can help reduce carbon dioxide emissions.10,11 Numerous studies have shown that,12,13 when the SS content is lower than 20%, SS concrete exhibits lower early compressive strength in comparation to the reference group. However, as further increasing SS content, the concrete compressive strength decreases significantly. Altun et al.14 found that using steel slag to replace 15% to 45% of cement reduced the compressive strength of cement slurry by 57.3% to 24.3% and 19.1% to 45.5% at 2 days and 7 days, respectively. Similar results were also obtained by Kourounis et al.,15 the 7 days compressive strengths of cement slurries containing 15%, 30% and 45% SS decreased by 18%, 37% and 54%, respectively, compared to the control sample. The mechanism of SS preventing early hydration of cement has been thoroughly investigated by Zhuang et al.16 The outcomes demonstrated that SS inhibition prevented C–S–H nucleation and development as well as the precipitation of Ca(OH)2(CH), and the SSP contains RO phase (CaO–FeO–MnO–MgO solid solution) with almost no hydration activity. The weaker interface transition zone (ITZ) formed between the RO phase and surrounding C–S–H gel, which also severely restricts the application of SS in cement-based materials.
Recent applications of nanomaterials in the field of civil engineering17,18 include carbon nanotubes, nanosilica, graphene oxide (GO),19 and carbon nanofibers, among which GO is chosen because of the extremely high specific surface area, superb mechanical strength, and amazing flexibility.20,21 Active surface oxygenic functional groups, including as hydroxyl and carboxyl groups in GO increase the interlamellar distance of GO, hence enhancing its dispersion in water.22 Numerous researchers23,24 have demonstrated that theses surface oxygenic functional groups of GO will preferentially react with C3S, C2S, and C3A. Therefore, these groups will provide growth sites for cement hydration products, which will in turn promote cement hydration. Lu et al.25 discovered that the cement-based materials with 0.08% GO had 37.7%, 24.8%, and 80.6% higher tensile strength, compressive strength, and flexural strength. Peng et al.26 confirmed that the addition of GO raised the compressive and flexural strength of fly ash cement mortar, especially the early strength. It is concluded that GO provides a new insight to overcome the shortcoming of the steel slag cement low strength in the early period.
This research evaluated the impacts of GO on the hydration and mechanical characteristics of steel slag cement utilizing XRD, SEM/EDS, and MIP tests to improve the usage of SS as a supplemental cementing ingredient in cement-based substances. Furthermore, the impacts of GO on the composition, shape, and nanomechanical characteristics of steel slag cement hydration products were examined. The mechanism of GO in steel slag cement was then investigated, which might provide a theoretical foundation for the effect of GO on steel slag cement and the application of cement-based materials.
2 Experimental
2.1 Materials
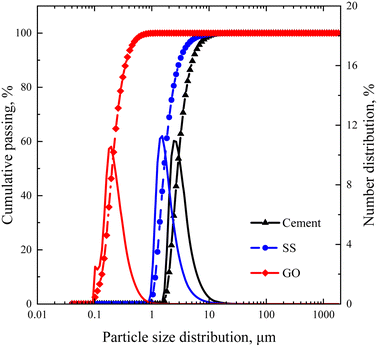
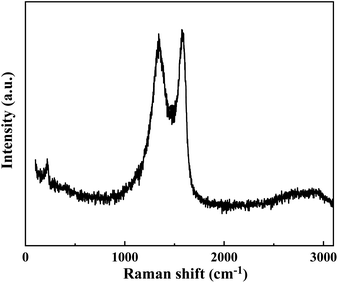
The cement applied is P.O 42.5 Portland cement, and the SS purchased from Hengduan New Material Co., Ltd. GO dispersion was provided by Shenzhen Suiheng Graphene Technology Co., Ltd. Table 1 exhibits the chemical composition of cement and SS. The particle size distributions of cement, SS, and GO are exhibited in Fig. 1. It is evident in Fig. 2 that the morphology of SS is irregular, and the morphology of GO is sheet-like folds. Fig. 3 shows the Raman spectrum of GO. The admixture is a polycarboxylate high-efficiency water reducer produced by Subote New Material Co., Ltd. (Jiangsu, China), and the water reduction rate is 20%. Tap water is used as mixing water.| Sample | CaO | SiO2 | Al2O3 | SO3 | Fe2O3 | MgO | NaO | K2O | L.O.I |
|---|---|---|---|---|---|---|---|---|---|
| Cement | 62.1 | 20.92 | 4.84 | 2.54 | 3.12 | 0.65 | 0.1 | 0.53 | 3.12 |
| SS | 39.62 | 7.12 | 1.65 | 1.08 | 22.9 | 6.6 | 0.21 | 0.15 | 2.24 |
2.2 Mixing design
In this paper, four types of mix ratios were prepared to study the impact of GO on steel slag cement properties, and kept the water/binder ratio at 0.4. The pure cement system was used as the control group. SS cement is made by mixing 20% SS and 80% cement. The content of GO is 0%, 0.02% and 0.04% of the mass of steel slag cement, respectively, which are labeled as 20SS + 0GO, 20SS + 0.02GO and 20SS + 0.04GO. The mixing ratio of cement paste is demonstrated in Table 2.| Sample | Ingredients, % | |||
|---|---|---|---|---|
| Cement | SS | GO | Water | |
| Control | 100 | 0 | 0 | 40 |
| 20SS + 0GO | 80 | 20 | 0 | 40 |
| 20SS + 0.02GO | 80 | 20 | 0.02 | 40 |
| 20SS + 0.04GO | 80 | 20 | 0.04 | 40 |
After mixing GO and stirring water, then sonicated for 60 min. Mixed GO solution with cement and then poured into a 40 cm × 40 cm × 40 cm cubic mold. After 24 hours of indoor curing, the mold was removed. Then, the mechanical properties and microstructure were tested after curing under standard conditions to the corresponding age.
2.3 Measurements
![[thin space (1/6-em)]](https://www.rsc.org/images/entities/char_2009.gif) 000 ms, and the number of echoes NECH was 80.
000 ms, and the number of echoes NECH was 80.3 Result
3.1 Fresh cement paste
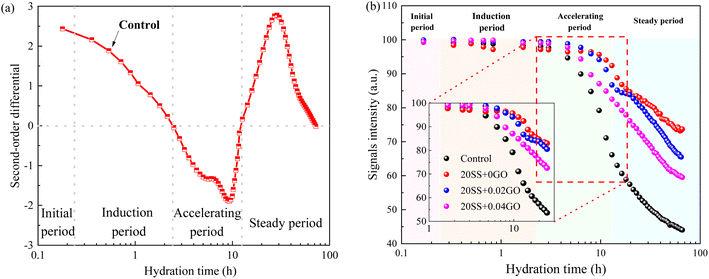 | ||
| Fig. 6 Evolution of cement paste during the hydration (a) the second-order derivative diagram of the signal intensity; (b) the total signal intensity of cement paste. | ||
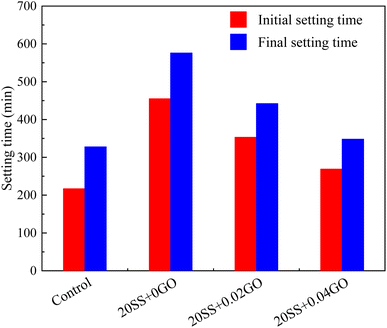
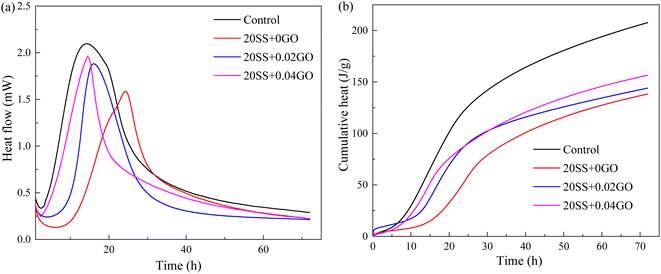
Compared with control specimens, the mixing SS cement paste showed a slow decrease process, and the end time of dormant period and acceleration period were prolonged, and the transition point of the pastes shifted towards later time (Fig. 6b), implying that the hydration was prolonged by SS. This phenomenon was similar to the results of hydration heat. This is mostly owing to the poor pozzolanic reactivity of SS on the early hydration of cement, and the cement dilution effect, which causes the hydration response to be delayed. It has been widely accepted.15,31 However, this critical point is obviously advanced with the addition of 0.02% GO and 0.04% GO to the paste, compared to 20SS + 0GO, which correlates to the above setting time results.
3.2 Hardened cement paste
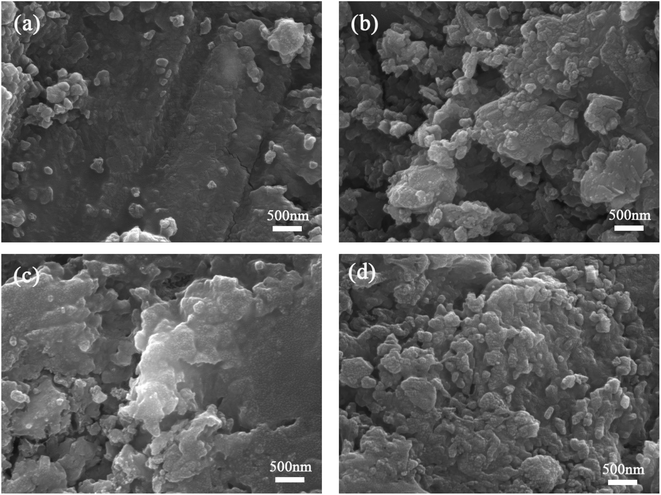 | ||
| Fig. 10 SEM photographs for cement paste at 28 days (a) control specimen; (b) 20SS + 0GO; (c) 20SS + 0.02GO; (d) 20SS + 0.04GO. | ||
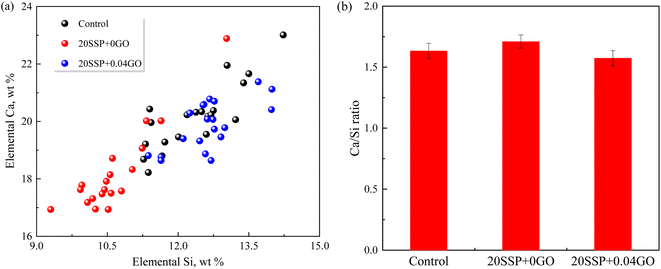
To explore the effect of the variation of chemical compositions on the microstructure of the pastes, the atomic ratios of the hydration products were assessed by EDS. As shown in Fig. 11, the Ca/Si ratio for the control specimen ranged from 1.45 to 1.65. The Ca/Si ratio of paste hydration products increased as SS partially replaced cement. The partial replacement of cement by SS increased the Ca/Si ratio of paste hydration products. The addition of GO, in a different circumstance, reduced the Ca/Si ratio. Earlier work confirmed that the lower Ca/Si ratio corresponded to the higher strength of paste,42 which was in line with our results that higher compressive strength obtained by 20SSP + 0.04GO paste.
| Sample | Porosity, % | Porosity in varied pore size intervals, % | |||
|---|---|---|---|---|---|
| Harmless <20 nm | Less-harmless 20 ∼ 50 nm | Harmful 50–200 nm | More-harmful >200 nm | ||
| Control | 11.56 | 5.75 | 2.75 | 2.23 | 0.83 |
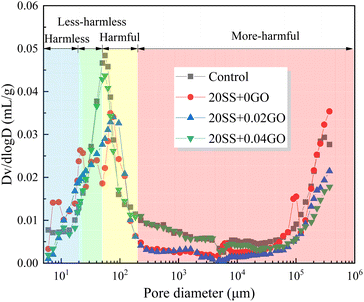
| 20SS + 0GO | 15.2 | 7.60 | 3.39 | 2.45 | 1.76 |
| 20SS + 0.02GO | 12.3 | 4.18 | 4.42 | 2.31 | 1.39 |
| 20SS + 0.04GO | 10.11 | 4.55 | 2.62 | 2.26 | 0.68 |
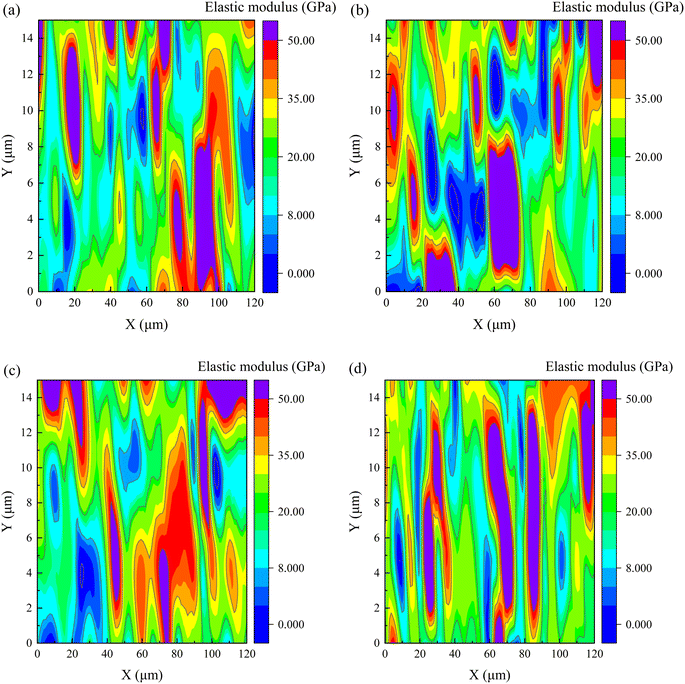 | ||
| Fig. 13 The elastic modulus at 28 days for cement matrix samples (a) control, (b) 20SS + 0GO, (c) 20SS + 0.02GO and (d) 20SS + 0.04GO. | ||
The frequency statistics of indentation modulus points in the matrix region were carried out, and the Gaussian function was adopted for curve fitting, as shown in Fig. 14. Simultaneously, through the correlation analysis of each fitting peak, the elastic modulus value and volume fraction of nano-indentation of each phase in the matrix region can be obtained, and the statistical distribution of frequency is exhibited in Table 4. When 20% SS was added, there was a clear reduction in the amount of C–S–H gel, while an enhancement in the amount of pore phase and unhydrated phase. With additional GO, however, the matrix's C–S–H gel content increased while the pore and UC phase contents decreased. A 2.2% increment in LD C–S–H content is seen in the 20SS + 0.04GO matrix compared to 20SS + 0GO, while a 55.6% increase is seen in the HD C–S–H content. In conclusion, adding enough GO can raise the C–S–H total content in the matrix, particularly the HD C–S–H. It is well known that HD C–S–H adds more strength to concrete than LD C–S–H.45
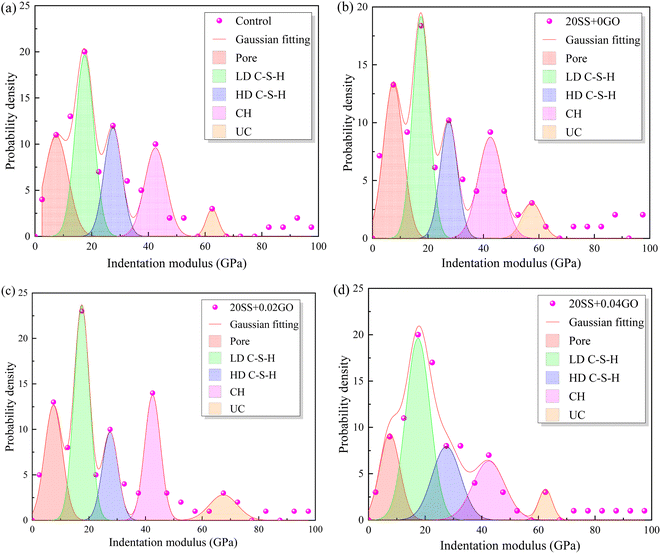 | ||
| Fig. 14 Impact of GO on the frequency distribution of cement matrix's elastic modulus (a) control, (b) 20SS + 0GO, (c) 20SS + 0.02GO, (d) 20SS + 0.04GO. | ||
| Sample | Pore | LD C–S–H | HD C–S–H | CH | UC |
|---|---|---|---|---|---|
| Control | 12.13 | 35.36 | 25.26 | 17.18 | 10.11 |
| 20SS + 0GO | 16.33 | 31.64 | 21.43 | 18.37 | 12.25 |
| 20SS + 0.02GO | 13.27 | 35.72 | 19.39 | 19.39 | 12.25 |
| 20SS + 0.04GO | 11.12 | 32.33 | 33.34 | 14.15 | 9.1 |
4 Conclusions
In this study, the effect GO on the compressive strengths of SS-cement paste is investigated experimentally, and the microstructure evolution is also explained by XRD, SEM, MIP and nanoindentation techniques. The following conclusions can be drawn:(1) SS can significantly delay the setting time of cement and reduce the hydration reaction. Compared with the control sample, adding 20% SS, the cumulative heat release of cement paste for 72 hours was reduced by 33.4%. When GO was added to SS-cement, the hydration reaction of cement was enhanced, and the peak heat release value of SS-cement paste was increased by 18.7–23.6%. LF-NMR test also obtained similar results.
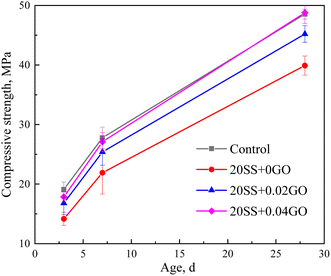
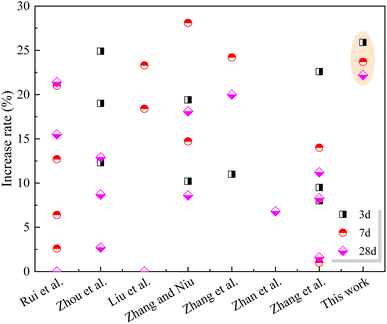
(2) Compared with the control sample, the compressive strength of cement paste with 20% SS decreased by 25.8%, 21.1% and 17.7% at 3 days, 7 days and 28 days, respectively. However, with the incorporation of GO, the compressive strength of the SS-cement paste increased by 13.3–25.9%, especially in the early stage.
(3) The analysis of microscopic results shows that with the addition of 20% SS, the cement paste has a higher total porosity and a looser microstructure. However, the incorporation of GO reduced the total porosity of the SS-cement paste by 19.1–33.5%, especially the content of harmful pores. With the increase of GO content, the microstructure of the SS-cement paste was further improved, and the C–S–H gel obtained a lower Ca/Si ratio.
(4) Nanoindentation studies revealed that when 20% SS partially replaced the cement, the content of the C–S–H gel phase in the matrix decreased. With the addition of GO, the SS-cement paste obtained lower porosity, and higher C–S–H gel content. The HD C–S–H phase contents in the SS-cement matrix with the GO increased by 55.6%, further explaining the development law of the macroscopic properties of the cement-SS–GO system.
Conflicts of interest
There are no conflicts to declare.References
- Y. Jiang, T.-C. Ling, C. Shi and S.-Y. Pan, Resour., Conserv. Recycl., 2018, 136, 187–197 CrossRef CAS.
- J. Li, Q. Yu, J. Wei and T. Zhang, Cem. Concr. Res., 2011, 41, 324–329 CrossRef CAS.
- P. Zhan, J. Xu, J. Wang, J. Zuo and Z. He, Cem. Concr. Compos., 2023, 137, 104924 CrossRef CAS.
- Y. Rui, C. Qian, X. Zhang and Z. Ma, J. Cleaner Prod., 2022, 362, 132407 CrossRef CAS.
- L. D. Poulikakos, C. Papadaskalopoulou, B. Hofko, F. Gschösser, A. Cannone Falchetto, M. Bueno, M. Arraigada, J. Sousa, R. Ruiz, C. Petit, M. Loizidou and M. N. Partl, Resour., Conserv. Recycl., 2017, 116, 32–44 CrossRef.
- J. Xu, P. Zhan, W. Zhou, J. Zuo, S. P. Shah and Z. He, Powder Technol., 2023, 419, 118356 CrossRef CAS.
- W. Shen, Y. Liu, B. Yan, J. Wang, P. He, C. Zhou, X. Huo, W. Zhang, G. Xu and Q. Ding, Renewable Sustainable Energy Rev., 2017, 75, 618–628 CrossRef CAS.
- L. C. B. Costa, M. A. Nogueira, H. D. Andrade, J. M. F. d. Carvalho, F. P. d. F. Elói, G. J. Brigolini and R. A. F. Peixoto, Constr. Build. Mater., 2022, 318, 126152 CrossRef CAS.
- Q. Dong, G. Wang, X. Chen, J. Tan and X. Gu, J. Cleaner Prod., 2021, 282, 124447 CrossRef CAS.
- D. Zhao, D. Zhang, W. Shen, J. Huang, X. Tang, Y. Yang, Y. Deng and Y. Wang, J. Cleaner Prod., 2022, 337, 130467 CrossRef CAS.
- T. Gao, T. Dai, L. Shen and L. Jiang, J. Cleaner Prod., 2021, 282, 124538 CrossRef CAS.
- P. Zhan, X. Zhang, Z. He, J. Shi, O. Gencel, N. T. Hai Yen and G. Wang, J. Cleaner Prod., 2022, 341, 130892 CrossRef CAS.
- L. Zhang, Q. Wang, Y. Zheng, Z. Cang, K. Gisele, C. Yu and D. Cang, Constr. Build. Mater., 2021, 311, 125295 CrossRef CAS.
- İ. Akın Altun and İ. Yılmaz, Cem. Concr. Res., 2002, 32, 1247–1249 CrossRef.
- S. Kourounis, S. Tsivilis, P. E. Tsakiridis, G. D. Papadimitriou and Z. Tsibouki, Cem. Concr. Res., 2007, 37, 815–822 CrossRef CAS.
- S. Zhuang and Q. Wang, Cem. Concr. Res., 2021, 140, 106283 CrossRef CAS.
- P. Zhan, Z. He, Z. Ma, C. Liang, X. Zhang, A. A. Abreham and J. Shi, J. Build. Eng., 2020, 30, 101259 CrossRef.
- J. Xu, B. Wang and J. Zuo, Cem. Concr. Compos., 2017, 81, 1–10 CrossRef CAS.
- A. M. Maglad, O. Zaid, M. M. Arbili, G. Ascensão, A. A. Şerbănoiu, C. M. Grădinaru, R. M. García, S. M. A. Qaidi, F. Althoey and J. de Prado-Gil, Buildings, 2022, 12, 1066 CrossRef.
- O. Zaid, S. R. Z. Hashmi, F. Aslam, Z. U. Abedin and A. Ullah, Diamond Relat. Mater., 2022, 124, 108883 CrossRef CAS.
- O. Zaid, R. Martínez-García and F. Aslam, J. Mater. Civil Eng., 2022, 34, 04022295 CrossRef CAS.
- J. Kim, L. J. Cote, F. Kim, W. Yuan, K. R. Shull and J. Huang, J. Am. Chem. Soc., 2010, 132, 8180–8186 CrossRef CAS.
- S. Lv, Y. Ma, C. Qiu, T. Sun, J. Liu and Q. Zhou, Constr. Build. Mater., 2013, 49, 121–127 CrossRef CAS.
- D. Hou, Z. Lu, X. Li, H. Ma and Z. Li, Carbon, 2017, 115, 188–208 CrossRef CAS.
- C. Lu, Z. Lu, Z. Li and C. K. Y. Leung, Constr. Build. Mater., 2016, 120, 457–464 CrossRef CAS.
- H. Peng, X. Guo, Z. Liu, R. Yang and J. Wei, Bull. Chin. Ceram. Soc., 2016, 73, 113–124 Search PubMed.
- W. Qidong, Z. Changshun, W. Xudong, A. Zixuan and L. Yeke, Mater. Res. Express, 2022, 9, 075008 CrossRef.
- J. Zhao, P. Yan and D. Wang, J. Cleaner Prod., 2017, 156, 50–61 CrossRef CAS.
- A. Pop, C. Badea and I. Ardelean, Appl. Magn. Reson., 2013, 44, 1223–1234 CrossRef CAS.
- H. Zhao, K. Jiang, Y. Di, W. Xu, W. Li, Q. Tian and J. Liu, Mater. Struct., 2019, 52, 1–11 CrossRef.
- G. S. Islam, M. Rahman and N. Kazi, Int. J. Sustainable Built Environ., 2017, 6, 37–44 CrossRef.
- S. Alla and S. S. Asadi, Constr. Build. Mater., 2023, 362, 129767 CrossRef CAS.
- Y. Suo, R. Guo, H. Xia, Y. Yang, B. Zhou and Z. Zhao, J. Build. Eng., 2022, 53, 104502 CrossRef.
- F. Zhou, H. Meng, G. Pan and R. Mi, Constr. Build. Mater., 2022, 344, 128269 CrossRef CAS.
- Y. Liu, Z. Zhang, G. Hou and P. Yan, J. Cleaner Prod., 2021, 289, 125133 CrossRef CAS.
- S. Zhang and D. Niu, Constr. Build. Mater., 2023, 363, 129981 CrossRef CAS.
- S. Zhang, D. Niu and D. Luo, J. Mater. Res. Technol., 2022, 21, 1830–1842 CrossRef CAS.
- T. Zhang, B. Ma, S. Wu, Z. Jin and J. Wang, Constr. Build. Mater., 2022, 314, 125660 CrossRef CAS.
- S. Park, K.-S. Lee, G. Bozoklu, W. Cai, S. T. Nguyen and R. S. Ruoff, ACS Nano, 2008, 2, 572–578 CrossRef CAS PubMed.
- J.-Y. Kong, M.-C. Choi, G. Y. Kim, J. J. Park, M. Selvaraj, M. Han and C.-S. Ha, Eur. Polym. J., 2012, 48, 1394–1405 CrossRef CAS.
- S. Lv, J. Liu, T. Sun, Y. Ma and Q. Zhou, Constr. Build. Mater., 2014, 64, 231–239 CrossRef.
- W. Kunther, S. Ferreiro and J. Skibsted, J. Mater. Chem. A, 2017, 5, 17401–17412 RSC.
- P. Zhan, J. Xu, J. Wang and C. Jiang, Constr. Build. Mater., 2021, 307, 125082 CrossRef CAS.
- P. Zhan, J. Xu, J. Wang, J. Zuo and Z. He, J. Cleaner Prod., 2022, 375, 134116 CrossRef CAS.
- Z. He, P. Zhan, S. Du, B. Liu and W. Yuan, Composites, Part B, 2019, 166, 13–20 CrossRef CAS.
| This journal is © The Royal Society of Chemistry 2023 |

