 Open Access Article
Direct oxidation of methane to methanol using CuMoO4†
Wenjian Wua,
Wenzhi Li *ab,
Mingwei Wua,
Hao Zhanga,
Chen Zhua and
Yihang Jianga
aLaboratory of Clean Low-Carbon Energy, University of Science and Technology of China, Hefei 230023, PR China. E-mail: liwenzhi@ustc.edu.cn; Fax: +86 0551 63600786; Tel: +86 0551 63600786
bInstitute of Energy, Hefei Comprehensive National Science Center, Hefei 230031, PR China
First published on 13th February 2023
Abstract
Upgrading methane into methanol or other high value-added chemicals is not only beneficial to mitigate the greenhouse effect, but also provides basic raw materials for industrial production. Nowadays, most research is limited to zeolite systems, and it is a considerable challenge to extend the support to metal oxides while achieving a high yield of methanol. In this paper, we take advantage of impregnation methods to synthesise a novel Cu/MoO3 catalyst, which can convert methane to methanol in the gaseous phase. At 600 °C, the Cu(2)/MoO3 catalyst can achieve a maximum STYCH3OH of 47.2 μmol (g−1 h−1) with a molar ratio CH4![[thin space (1/6-em)]](https://www.rsc.org/images/entities/char_2009.gif) :
:![[thin space (1/6-em)]](https://www.rsc.org/images/entities/char_2009.gif) O2
O2![[thin space (1/6-em)]](https://www.rsc.org/images/entities/char_2009.gif) :
:![[thin space (1/6-em)]](https://www.rsc.org/images/entities/char_2009.gif) H2O = 5
H2O = 5![[thin space (1/6-em)]](https://www.rsc.org/images/entities/char_2009.gif) :
:![[thin space (1/6-em)]](https://www.rsc.org/images/entities/char_2009.gif) 1.4
1.4![[thin space (1/6-em)]](https://www.rsc.org/images/entities/char_2009.gif) :
:![[thin space (1/6-em)]](https://www.rsc.org/images/entities/char_2009.gif) 10. Consequences of SEM, TEM, HRTEM and XRD substantiate that Cu is incorporated into the lattice of MoO3 to form CuMoO4. And transmission infrared spectroscopy, Raman spectroscopy together with XPS characterization techniques confirm the generation of CuMoO4, which is the main active site provider. This work provides a new support platform for Cu-based catalyst research in the methane-to-methanol system.
10. Consequences of SEM, TEM, HRTEM and XRD substantiate that Cu is incorporated into the lattice of MoO3 to form CuMoO4. And transmission infrared spectroscopy, Raman spectroscopy together with XPS characterization techniques confirm the generation of CuMoO4, which is the main active site provider. This work provides a new support platform for Cu-based catalyst research in the methane-to-methanol system.
1. Introduction
Today, achieving carbon neutrality is both the ambitious vision of people worldwide and an important goal for individual countries.1,2 In this process, a series of energy sources with the main component of methane, such as natural gas, combustible ice, coal-bed methane, biogas, etc., play an indispensable role. Compared with traditional fossil energy, these energy reserves are larger, more widely distributed and more environmentally friendly when used.3,4 However, in the process of resource extraction, a large amount of methane is inevitably produced. Simultaneously, since the global warming capacity of methane is more than 20 times that of carbon dioxide, direct emissions or inefficient utilization will cause serious greenhouse effects.5,6 At present, the most ideal treatment is to convert methane into methanol and other high value-added chemicals, which has the superiority of increasing energy density, facilitating storage and transportation, while also providing raw materials for modern industry.7,8 But due to its symmetrical regular tetrahedral structure, the energy of breaking C–H chemical bond is higher than that in methanol,9,10 which makes the direct conversion of methane to methanol difficult to achieve. Therefore, in industrial production, steam reforming is the dominating method in methane transformation.11,12 At 1123–1173 K and 30 bar, methane is first converted to CO and H2, then the syngas is converted to methanol. For this process, firstly, it is energy-intensive and requires a lot of large-scale facilities, which is not environmental-friendly. Second, it is a multi-step process and there is an upper limit to the conversion efficiency.13,14 Considering these drawbacks, we urgently need a catalyst to realize the single-step conversion of methane to methanol with low energy consumption.In recent years, precious metal catalysts and zeolite catalysts are the two main research directions.15,16 A series of noble metal catalysts including Au,17,18 Pd,19,20 Rh (ref. 21 and 22) and Ir (ref. 23) usually have a good promotion effect on the adsorption of methane and the cleavage of the C–H bond. However, their scarcity and expensive price attribute limit their large-scale application. Zeolite catalysts originated from mimicking methane monooxygenase (MMO) in nature, which can use methane, oxygen and water to produce methanol in a moderate temperature and normal pressure.24,25 Through simulating the structure of MMO, many scientists have loaded Cu or Fe onto zeolite including mordenite (MOR),26–29 chabazite (CHA)30–32 and ZSM-5 (ref. 33–35) by impregnation or ion exchange methods. For Fe-zeolite catalysts, its biggest limitation is that its oxidant is mainly N2O36,37 or H2O2.38,39 Neither N2O nor H2O2 are available directly from nature, and they are also much more expensive than the product methanol. And Cu-zeolite catalysts have the most industrial research value due to its large reserves, low price, and the ability to use oxygen as an oxidant. But due to the poor hydrothermal stability of ordinary silica–alumina zeolites, and its many Brønsted acid and Lewis acid sites, which are not conducive to the desorption of methanol.40,41 Many scientists hope to expand the application of the carrier. Ha V. Le et al. used the impregnation method to support Cu on SBA-15 and found that the highly dispersed CuO particles have the ability to catalyze methane to methanol.42 S. E. Bozbag et al. prepared Cu–SiO2 catalyst, and the active Cu-oxo sites were formed on its surface that can help with methane activation.43 Liu, Z. et al. synthesized CeO2–Cu2O catalyst and they also emphasized that water plays a key role in promoting methanol production.44 Other materials also have potential as Cu catalyst supports.
Some studies have shown that MoO3 is a promising and valuable catalyst carrier.45,46 MoO3 has multiple valence states (+6, +5 and +4) and abundant oxygen vacancies, which enable it to possess favorable dehydrogenation and oxygenation capacity. For example, H.-F. Liu et al. synthesized Mo/SiO2 catalyst, which used N2O to form Mo6+O2− that could convert CH4 to HCHO.47 K. Aoki et al. prepared MoO3/SiO2 catalyst using sol–gel method. With excess water vapor, methane was partially oxidized to methanol and formaldehyde.48 Through the metal–support interaction, the MoO3 support can easily interact with other metals to produce specific reactive species, thereby improving the activity. For example, C. Brookes et al. prepared a core–shell Fe2O3–MoO3 catalyst to selectively convert methanol to formaldehyde.49 They confirmed that ferric molybdate is the active component for formaldehyde synthesis. J. Zhu et al. synthesized a series of MxOy/MoO3/CeO2 (M = Ni, Cu, Fe) catalyst for selective reduction of NH3 and NO.50 In addition, MoO3 also has the advantages of low cost and good chemical stability, which help it widely used in catalytic conversion. These advantages demonstrate the potential of MoO3 as a carrier to help convert methane into methanol.
Taking the above factors into consideration, we prepared a novel Cu/MoO3 catalyst by impregnation method. And Cu was uniformly dispersed on the carrier and formed active species of CuMoO4, which can catalyze the synthesis of methanol from methane, oxygen and water. The influences of various reaction parameters such as Cu wt%, reaction temperature, molar ratio of CH4–O2–H2O on methanol yield were discussed. Different characterization methods such as BET, ICP-AES, TEM, SEM, XRD, XPS are adopted to research the structure and properties of Cu/MoO3 catalyst. Simultaneously, transmission infrared spectroscopy (TS) and Raman spectroscopy are exploited to study the active component of Cu/MoO3 catalyst and CuMoO4 is convinced to be the main active site supplier.
2. Experimental
2.1. Materials
Molybdenum trioxide (MoO3, 99.95%) and cupric carbonate basic were purchased from Shanghai Aladdin Biochemical Technology Co., Ltd. Ammonium carbonate and ammonia solution (25–28%) were purchased from Sinopharm Chemical Reagent Co., Ltd. All of materials were applied without further purification.2.2. Catalysts preparation
The Cu/MoO3 catalysts were compounded by impregnation method. First, 2.5 g of ammonium carbonate was added into 10 mL of ammonia water with stirring to make a pellucid solution. Then, putting 3 g of cupric carbonate basic into the previous solution. After stirring at 800 rpm for 30 min, the precursor solution was prepared. Cu/MoO3 catalysts with different mass fractions were synthesized by mixing the MoO3 carrier with an appropriate amount of the precursor solution. Afterwards, the catalysts were placed in an oven to dry overnight at 150 °C following by calcining at 400 °C in the muffle furnace. Therefore, the Cu(x)/MoO3 catalysts were prepared successfully, where the x represented the mass fraction of Cu.2.3. Characterization
The structure and physicochemical properties were investigated by inductively coupled plasma atomic emission spectrometer (ICP-AES), Brunauer–Emmett–Teller method (BET), transmission electron microscope (TEM), high-resolution transmission electron microscope (HRTEM), scanning electron microscope (SEM), X-ray diffraction (XRD), X-ray photoelectron spectroscopy (XPS), transmission infrared spectroscopy (TS), hydrogen-temperature programmed reduction (H2-TPR), UV-vis spectroscopy and Raman spectroscopy (Raman). A detailed description of the characterization techniques was given in the ESI.†2.4. Catalyst activity test
The reactive gas included 15% CH4 (residual gas is N2) and synthetic air (abbreviated as air, 21% O2 + 79% N2). Activity tests of Cu/MoO3 catalysts were carried out in fixed bed reactors at atmospheric pressure. The schematic diagram of the reaction device is shown in Fig. S1.† At first, 50 mg of the testing sample was placed in the middle of the quartz tube (i.d. 6 mm). And quartz wool was used as a fixture to prevent it from being blown away by the reaction gas. Secondly, heated the furnace to the corresponding temperature (400 °C, 450 °C, 500 °C, 550 °C, 600 °C) at a heating rate of 10 °C min−1 and catalyst was activated for one hour at this temperature. After that, CH4 and air were introduced into the quartz tube, and their flow rates were controlled by flowmeters respectively. Then, controlled the precise amount of water entering the reaction chamber with a water vapor generator. Unless specifically mentioned, all the response time had been set to two hours and the water inlet speed were set to 3 μL min−1. Finally, the outlet gas first passed through the cold trap (set at −3 °C) following by entering the gas chromatograph (GC) for online analysis. The gas chromatography utilized an HP-PLOT/Q column to separate the products and a flame ionization detector (FID) to detect the signal of the products. Selectivity of liquid products as well as yield were analyzed by calibrated GC and nuclear magnetic resonance hydrogen spectroscopy (1H-NMR). The methanol space-time yield (STY) was computed as NCH3OH/(Mcat × T), where NCH3OH represented the molar amount of methanol collected in the cold trap, Mcat represented the mass of the catalyst and T represented the reaction time. The selectivity of each liquid product was calculated as SCH3OH = NCH3OH/(NCH3OH + NCH3OOH + NOHCH2OOH), SCH3OOH = NCH3OOH/(NCH3OH + NCH3OOH + NOHCH2OOH) and SOHCH2OOH = NOHCH2OOH/(NCH3OH + NCH3OOH + NOHCH2OOH), where NCH3OOH represented the molar amount of CH3OOH and NOHCH2OOH represented the molar amount of OHCH2OOH.3. Results and discussion
3.1. Crystal structure and morphology
Table S1† lists the results of ICP-AES and BET characterization techniques. From the ICP-AES data, there is no difference between the theoretical value and the actual value of Cu loading, which proves the accuracy of the previous preparation process. Analysis of the BET data shows that with the increase of Cu loading, the specific surface area and pore volume of the catalyst also increase gradually. This result confirms that Cu is supported on MoO3 and has an effect on the surface properties of MoO3. There are two possibilities. One is that the agglomeration of Cu on the surface of MoO3 increases the specific surface area and pore size, and the other is that the incorporation of Cu destroys the initial morphology of MoO3 and reacts with it to form a new species, which is confirmed by the results of XRD and SEM.Fig. 1 exhibits the XRD patterns of different Cu/MoO3 catalysts. In Fig. 1A, the main peaks of catalysts loaded with different Cu mass fractions are analogous, which correspond to α-MoO3 (orthorhombic MoO3, JCPDS PDF #35-0609). α-MoO3 is a thermodynamically stable phase structure that can interact with other metal ions and maintain its own structure without drastic changes. Therefore, when the Cu loading increased from 0% to 11%, the XRD signal of samples do not change much. And the diffraction peaks of CuO has not appeared, which means that Cu is very uniformly distributed on the MoO3 carrier or Cu enters the lattice of MoO3 to form new species. Fig. 1B exhibits the XRD pattern features between 20–30°. As can be seen from the Fig. 1B, when Cu is impregnated on the support, the sharpness of these peaks decreased to a certain extent. This phenomenon indicates that Cu has interacted with MoO3 carrier and influences its crystallinity. New peaks appear in the XRD patterns of Cu(3)/MoO3, Cu(5)/MoO3, Cu(11)/MoO3, which correspond to CuMoO4 (JCPDS PDF #22-0242). This metal compound has been verified to provide multiple active sites to catalyze the oxidation of methane, formaldehyde and other species.50–52
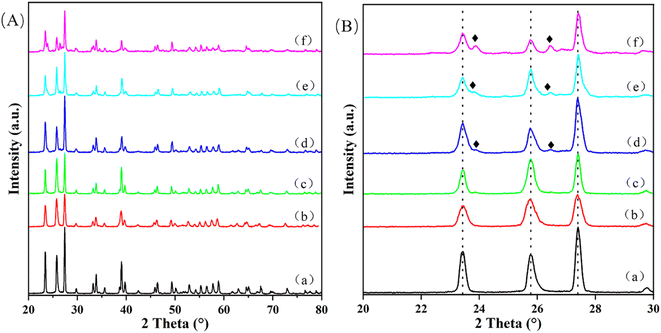 | ||
| Fig. 1 (A) 20–80° XRD patterns of (a) Cu(0)/MoO3, (b) Cu(1)/MoO3, (c) Cu(2)/MoO3, (d) Cu(3)/MoO3, (e) Cu(5)/MoO3, (f) Cu(11)/MoO3; (B) 20–30° XRD patterns in (A). (♦) represents CuMoO4. | ||
Fig. 2 displays the SEM images of the Cu/MoO3 catalysts. Typical morphology of commercial MoO3 without Cu loading is in the form of irregular polygons, which is presented in Fig. 2a. With the addition of Cu, this morphology is destroyed gradually. And when the Cu loading reaches 11%, the morphology is basically completely destroyed and transformed into smaller irregular polygons (Fig. 2f). According to the above phenomenon, we can infer that Cu is not simply loaded on MoO3, but is likely to interact with the support to form new species and produce dissimilar appearances.
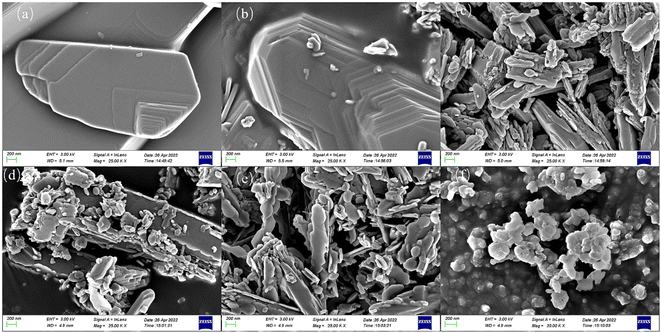 | ||
| Fig. 2 SEM images of (a) Cu(0)/MoO3, (b) Cu(1)/MoO3, (c) Cu(2)/MoO3, (d) Cu(3)/MoO3, (e) Cu(5)/MoO3, (f) Cu(11)/MoO3. | ||
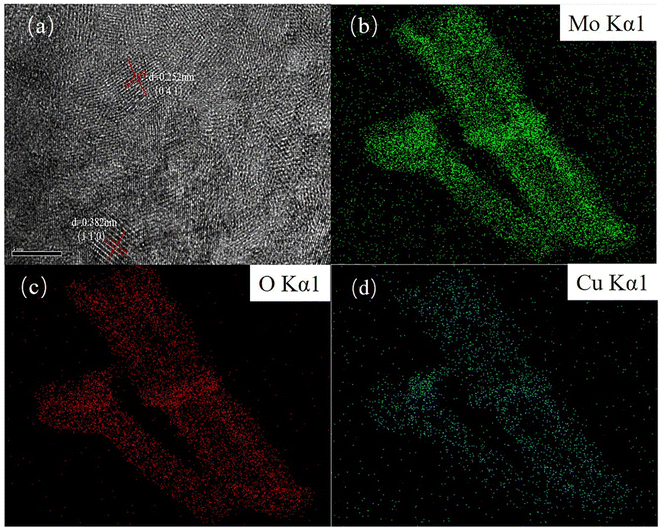
The TEM results of different Cu/MoO3 catalysts are shown in Fig. S2.† Analysis of the TEM images show that although Cu is impregnated on the MoO3 support, even if the catalyst is Cu(11)/MoO3, there are still no obvious particles on the surface of the sample. This indicates that Cu is very likely to enter the lattice of MoO3 and form new species. Fig. 3 exhibits the HRTEM image and element mapping of Cu(2)/MoO3. Fig. 3a shows two typical crystal planes ((1 1 0), (0 4 1)) of α-MoO3, which are consistent with the XRD results. And Fig. 3b reveals the distribution of Mo, O, Cu elements on the catalyst surface. As shown in the picture, the Cu element is dispersed uniformly and no apparent aggregation can be noticed. Combined with the results of XRD, SEM, TEM, etc., after Cu is supported on the MoO3 carrier, Cu is capable of interacting with the carrier and entering the lattice of MoO3, thereby forming new species of CuMoO4, which possesses the active sites of methane oxidation probably.
H2-TPR experiments are performed to probe the redox capacity of the dissimilar catalysts. The specific data is shown in Fig. 4. For purified MoO3 catalyst, the reduction peak appears only at 657 °C, which correspond to the reduction of Mo6+ to Mo5+ and Mo4+.51,53,54 After Cu had supported on the carrier, the reduction temperature drops sharply. Simultaneously, a distinct shoulder peak at 492 °C also appears, which can be viewed as the reduction of Mo6+ in CuMoO4. So it is obvious that the incorporation of Cu helps the formation of new active species on the catalyst surface, which is consistent with the results of XRD, SEM and TEM. With the increasing mass fraction of Cu, the reduction temperature shows a downward trend. And new reduction peak is shown at near 370 °C, which can be assigned to the reduction of tiny copper oxide.55,56 When Cu loading increases from 0 wt% to 1 wt% and 1 wt% to 2 wt%, the drop in temperature is very large, close to 60 °C. After that, the temperature drop becomes smaller, which means that there is an upper limit for the influence of Cu on the redox properties of the carrier itself. J. L. Brito et al. prepared Ni–Mo oxides and found that Ni and Mo had an optimal ratio, excess Ni would produce tiny NiO.57 W. Yu et al. investigated the surface structure of CuO/MoO3/CeO2 and demonstrated that the amount of Cu should be regulated, excess Cu would produce tiny copper oxides.58 Combining with the phenomenon that new reduction peak appears at near 370 °C in Fig. 4d–f, the optimal loading of Cu may be 2 wt%. This finding has great guiding significance for the influence of Cu mass fraction on methanol yield.
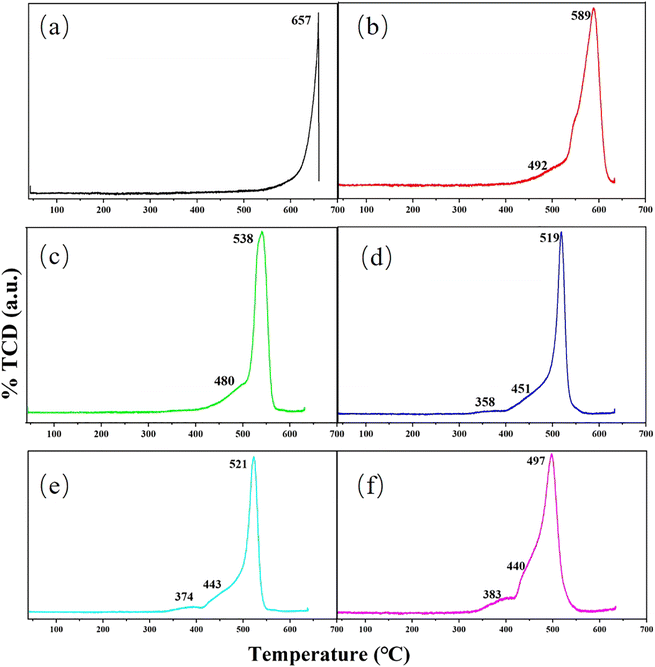 | ||
| Fig. 4 TPR profiles of H2 for (a) Cu(0)/MoO3, (b) Cu(1)/MoO3, (c) Cu(2)/MoO3, (d) Cu(3)/MoO3, (e) Cu(5)/MoO3, (f) Cu(11)/MoO3. | ||
3.2. Catalyst activity
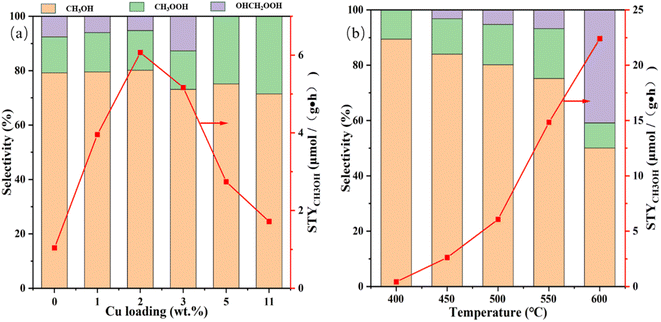
The effects of Cu loading together with reaction temperature on the STYCH3OH and liquid product selectivity are studied preliminary and the consequences are shown in Fig. 5 and Table S2.† And the 1H-NMR result of liquid products is shown in Fig. S3,† from which we can find that CH3OH, CH3OOH and OHCH2OOH are the main component. From Fig. 5a and Table S2,† we can find that in the absence of Cu incorporation, the reactivity of the Cu(0)/MoO3 is very deficient. After Cu is impregnated on the support, the methanol yield is improved significantly. With the increase of Cu mass fraction, the methanol yield reached the optimum value at Cu(2)/MoO3, and then the number began to decrease. As to the selectivity, when the mass fraction of Cu was less than 2 wt%, the selectivity of the three products was basically the same. But when the mass fraction of Cu increased to 3 wt%, the SOHCH2OOH became higher, while the SCH3OH and SCH3OOH decreased. Even after the copper loading exceeded 5 wt%, OHCH2OOH was basically undetectable, indicating that excessive oxidation had occurred in the reaction. From the results of H2-TPR, we can know that when the loading of Cu exceeds 2 wt%, there will be tiny copper oxides produced. And since methane has a symmetrical regular tetrahedral configuration, the energy required to break its C–H bond is much higher than the energy required to break the C–H bond in methanol, which leads to the liable over-oxidation of intermediate product and methanol.59,60 Therefore, for Cu(3)/MoO3, Cu(5)/MoO3 and Cu(11)/MoO3 catalysts, the intermediate products of the reaction and methanol are highly likely to have more severe over-oxidation, which leads the decrease of methanol yield. Because the Cu(2)/MoO3 catalyst maintains the best activity, we mainly study this sample next. The influence of reaction temperature on the Cu(2)/MoO3 catalyst is shown in Fig. 5b and Table S2.† Elevating temperature has a positive effect on methanol yield. When the temperature reaches 600 °C, the methanol yield reaches 22.4 μmol (g−1 h−1). However, the selectivity of methanol and CH3OOH gradually decreases, while the proportion of OHCH2OOH gradually increase, indicating that with the increase of temperature, the reaction product will undergo a certain excessive oxidation phenomenon. Because our target is to achieve higher methanol space-time yield, the positive effect of increasing temperature on methanol yield outweighs the negative impact of excessive methanol oxidation, we choose 600 °C as the optimal temperature for the reaction. And Fig. S4† displays the thermogravimetric analysis (TGA) result of Cu(2)/MoO3. According to this picture, when temperature arrives at 658 °C, the sample will become unstable and begin to evaporate and decompose gradually. That's why we set the maximum reaction temperature to 600 °C. Within 400–600 °C, the higher the reaction temperature, the better the activity. It is well-known that the high temperature provides more energy to activate methane molecules while speeding up the reaction rate. And it may also help to increase the catalytic active sites. More characterization methods will be adopted to investigate this intrinsic reason.3.3. Surface chemical groups
The UV-vis spectra of Cu(2)/MoO3 catalyst at different temperature are shown in Fig. S5.† In Cu-zeolite catalysts, the peak at 22![[thin space (1/6-em)]](https://www.rsc.org/images/entities/char_2009.gif) 700 cm−1 is often considered the active site in the methane-to-methanol reaction, but this is not shown in Fig. S5.†61,62 And there are no other signature peak signals for active copper species. Therefore, the active species in Cu/MoO3 catalyst are not the same as the active species in zeolite.
700 cm−1 is often considered the active site in the methane-to-methanol reaction, but this is not shown in Fig. S5.†61,62 And there are no other signature peak signals for active copper species. Therefore, the active species in Cu/MoO3 catalyst are not the same as the active species in zeolite.
Transmission infrared spectroscopy (TS) is applied to further study the specific structure of the Cu/MoO3 catalyst. And the spectrum is performed in Fig. 6. The peak at 522 cm−1 and the peak in the range 739–829 cm−1 can be considered to be aroused by the vibration of the Mo–O–Mo bond. At the same time, the peak at 958 cm−1 represents the vibration of terminal Mo![[double bond, length as m-dash]](https://www.rsc.org/images/entities/char_e001.gif) O bond in bulk MoO3.49,63,64 With the doping of Cu, the peak near 739 cm−1 is slightly shifted firstly, which means that Cu atoms may have contact with Mo atoms and then affect the Mo–O–Mo bond. Secondly, a new vibrational peak appears at 697 cm−1 which represents the formation of Cu–O–Mo bond. Thirdly, two shoulder peaks generate around the peak of 958 cm−1, which are correspond to the vibration of Mo
O bond in bulk MoO3.49,63,64 With the doping of Cu, the peak near 739 cm−1 is slightly shifted firstly, which means that Cu atoms may have contact with Mo atoms and then affect the Mo–O–Mo bond. Secondly, a new vibrational peak appears at 697 cm−1 which represents the formation of Cu–O–Mo bond. Thirdly, two shoulder peaks generate around the peak of 958 cm−1, which are correspond to the vibration of Mo![[double bond, length as m-dash]](https://www.rsc.org/images/entities/char_e001.gif) O bond in the molybdate ion.52,65 Combined with the above results, it is obvious that Cu interacts with the MoO3 after being dispersed on its surface and forms new species. Basing on the previous analysis, the new species is CuMoO4. Although the change of each vibration peak is not very distinct in Cu(1)/MoO3 and Cu(2)/MoO3, the following Raman spectroscopy will prove that the two also produced new species.
O bond in the molybdate ion.52,65 Combined with the above results, it is obvious that Cu interacts with the MoO3 after being dispersed on its surface and forms new species. Basing on the previous analysis, the new species is CuMoO4. Although the change of each vibration peak is not very distinct in Cu(1)/MoO3 and Cu(2)/MoO3, the following Raman spectroscopy will prove that the two also produced new species.
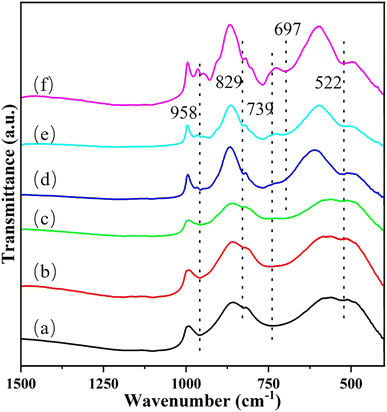 | ||
| Fig. 6 Transmitted infrared spectroscopy (TS) images of (a) Cu(0)/MoO3, (b) Cu(1)/MoO3, (c) Cu(2)/MoO3, (d) Cu(3)/MoO3, (e) Cu(5)/MoO3, (f) Cu(11)/MoO3. | ||
Fig. S6 and S7† illustrate the Raman spectra of Cu/MoO3 catalysts under different conditions. The spectral range of Fig. S6† is 500–1100 cm−1. As we can discovery in the spectra, there are three foremost peaks presented at 667 cm−1, 819 cm−1 and 997 cm−1. The peak at 667 cm−1 is assigned to the symmetric stretching vibrations of Mo–O–Mo in bulk MoO3, the peak at 819 cm−1 is a typical Mo–O–Mo asymmetric stretch and the band at 997 cm−1 is originally from terminal vibration of Mo![[double bond, length as m-dash]](https://www.rsc.org/images/entities/char_e001.gif) O in bulk MoO3.50,66,67 But due to the support of the catalyst is commercial MoO3, its own signal is too strong and do not transform severely, resulting in less obvious peaks of other species. Simultaneously, indistinct peak signal appeared between 860–980 cm−1, so we analyze this part of the Raman spectra. The detailed spectra are shown in Fig. 7. In Fig. 7A, three major peaks are appeared at 888 cm−1, 937 cm−1, 968 cm−1, which are characteristic peaks of CuMoO4.51,52,68 The band at 968 cm−1 can be recognized as the stretching mode of terminal Mo
O in bulk MoO3.50,66,67 But due to the support of the catalyst is commercial MoO3, its own signal is too strong and do not transform severely, resulting in less obvious peaks of other species. Simultaneously, indistinct peak signal appeared between 860–980 cm−1, so we analyze this part of the Raman spectra. The detailed spectra are shown in Fig. 7. In Fig. 7A, three major peaks are appeared at 888 cm−1, 937 cm−1, 968 cm−1, which are characteristic peaks of CuMoO4.51,52,68 The band at 968 cm−1 can be recognized as the stretching mode of terminal Mo![[double bond, length as m-dash]](https://www.rsc.org/images/entities/char_e001.gif) O bond in the molybdate ion, the band at 937 cm−1 is aroused from the asymmetric vibration of Mo
O bond in the molybdate ion, the band at 937 cm−1 is aroused from the asymmetric vibration of Mo![[double bond, length as m-dash]](https://www.rsc.org/images/entities/char_e001.gif) O in the distorted tetrahedral structure and the peak at 888 cm−1 is correspond to the stretching vibration of Mo–O bond. With the impregnation of Cu on the carrier, these peaks become more intense gradually. And in the Cu(2)/MoO3 catalyst, the signals are exhibited clearly. This phenomenon has convinced that Cu/MoO3 catalyst with different Cu loading all possess this new species. The conclusion obtained from the Raman spectrum in Fig. 7A is mutually confirmed with the completion acquired from the Fig. 6.
O in the distorted tetrahedral structure and the peak at 888 cm−1 is correspond to the stretching vibration of Mo–O bond. With the impregnation of Cu on the carrier, these peaks become more intense gradually. And in the Cu(2)/MoO3 catalyst, the signals are exhibited clearly. This phenomenon has convinced that Cu/MoO3 catalyst with different Cu loading all possess this new species. The conclusion obtained from the Raman spectrum in Fig. 7A is mutually confirmed with the completion acquired from the Fig. 6.
 | ||
| Fig. 7 (A) Raman spectra of various Cu loading. (B) Raman spectra of Cu(2)/MoO3 at different temperature. (C) Raman spectra of Cu(2)/MoO3 at 600 °C with different reaction gas. | ||
Effect of reaction temperature is shown in Fig. 7B. As we can see from this picture, the characteristic peaks about CuMoO4 put in an appearance again. The intensity of these governing signals gradually strengthens with the increase of reaction temperature. According to Fig. 5b, the methanol yield is also enhanced with temperature getting higher. Thence, we can conjecture that CuMoO4 has a significant impact on the catalyst activity. Higher temperature makes more Cu interact with MoO3 support to form more CuMoO4, which helps the manufacture of methanol. Comparing with Fig. 7A, although more CuMoO4 are produced with more Cu loading. But according to the results of H2-TPR, we can also know that tiny copper oxides also appeared. This may cause more severe over-oxidation and reduce methanol yield.
Fig. 7C reveals the evolution of surface active species on Cu(2)/MoO3 catalysts under different reaction atmosphere. The intensity of the three peaks gradually decreases from top to bottom, as the reactant gas changes from air to 15% CH4 + air following by only 15% CH4. At the beginning, only sending air into the reaction line helps the fabrication of CuMoO4. Then when the 15% CH4 is pouring into the tube simultaneously, the peak intensity decreases obviously, which means the consumption of CuMoO4. Finally, only 15% CH4 is blowing into the quartz tube, the signals of CuMoO4 basically disappear. Based on the above analysis, CuMoO4 is closely related to the activation process of methane. For the conversion of methane to methanol, CuMoO4 is an important active component, which provides sufficient active sites. This conclusion also explains the phenomena in Fig. 7A and B very well, which in turn further validates the role of CuMoO4.
3.4. Electronic states
The electronic states of elements on the catalyst surface were characterized by X-ray photoelectron spectroscopy (XPS). Mo 3d and O 1s XPS spectra of the four samples in different reaction situations are shown in Fig. 8 and the specific data are listed in Table S3.† Analyzing the Mo 3d XPS data, we can find four different binding energies appear in the spectra, which correspond to 233.09 eV, 236.19 eV, 231.99 eV and 234.99 eV, respectively. Based on the conclusions of other articles,53,69,70 the binding energies at 233.09 eV and 236.19 eV are assigned to Mo6+ 3d5/2 and Mo6+ 3d3/2. While the double hills at 231.99 eV and 234.99 eV can be regard as the orbital electrons of Mo5+ 3d5/2 and Mo5+ 3d3/2. In the light of the atomic ratios of Mo5+/Mo6+, we can demonstrate that molybdenum atoms with valence +6 dominate in Cu/MoO3 catalyst. At the same time, this ratio is also closely related to the number of oxygen vacancies in the catalyst.53,69 Under the calculation of Table S2,† the relationship between the atomic ratios of Mo5+/Mo6+ for the four samples is expressed as (e) > (a) > (g) > (c). Therefore, the relationship between the number of oxygen vacancies for the four samples is also expressed as (e) > (a) > (g) > (c).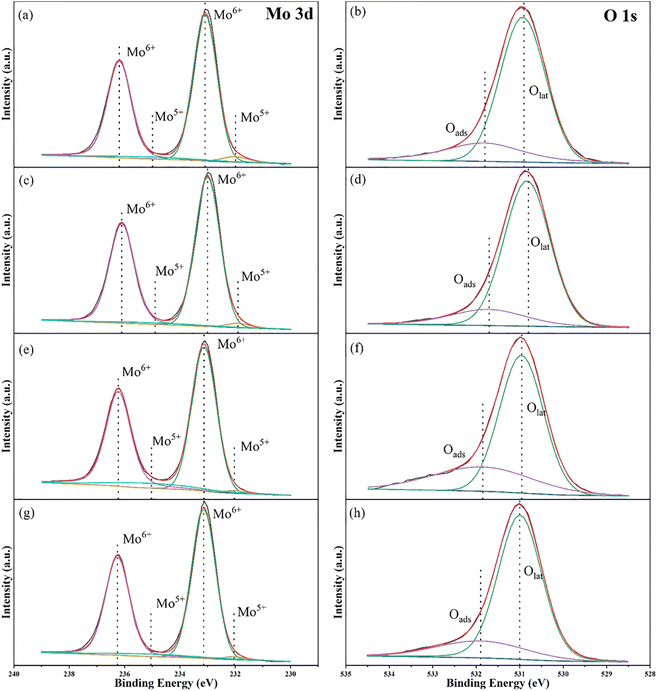 | ||
| Fig. 8 Mo 3d and O 1s XPS spectra of (a) and (b) Cu(0)/MoO3, (c) and (d): Cu(2)/MoO3, (e) and (f) Cu(2)/MoO3 before reaction at 600 °C, (g) and (h) Cu(2)/MoO3 after reaction at 600 °C. | ||
Conducting the same research on O 1s XPS data, two binding energies locating at 530.9 eV and 531.8 eV can be assigned to lattice oxygen (Olat) and adsorbed oxygen (Oads) on catalyst surface, respectively.69,71 At the same time, the ratio of Oads/Olat usually signifies the number of oxygen vacancies. Judging by the Table S2,† the quantitative relationship of the four samples can be stated as (f) > (b) > (h) > (d). This result is similar to the previous conclusion obtained from Mo 3d XPS spectra. In the catalytic oxidation of methane, oxygen vacancies can usually assume the role of adsorbing and activating the reactive gas. Numerous studies have shown that the greater the number of oxygen vacancies, the generally better catalyst activity.53,69,72,73 But comparing the XPS data of Cu(0)/MoO3 and Cu(2)/MoO3, we can find that the number of oxygen vacancies has decreased after Cu is impregnated on MoO3 support. While the methane conversion together with methanol yield have enhanced remarkably. Obviously, supported Cu can form new active species with MoO3, which could overcome the effects of reduced oxygen vacancies and increase the activity of methane oxidation simultaneously. During the preparation of catalysts, oxygen vacancies may play a role in trapping and immobilizing Cu elements.74 The effect of reaction temperature can also be explained by the comparison of Fig. 8a, b, e and f. As the reaction temperature increased to 600 °C, the number of oxygen vacancies also increased. This maybe another reason why high temperature is beneficial to methanol yield. During the reaction process, oxygen vacancies help activate methane and oxygen. Wherefore, the number of oxygen vacancies decreases accordingly after the reaction, which is shown in Fig. 8g and h.
3.5. Reaction parameters optimization
Previous reaction studies have demonstrated the effect of Cu loading and reaction temperature on STYCH3OH and methanol selectivity. And the main target of this research is to achieve high methanol productivity. Hence, we had made efforts to optimize the molar ratio of CH4![[thin space (1/6-em)]](https://www.rsc.org/images/entities/char_2009.gif) :
:![[thin space (1/6-em)]](https://www.rsc.org/images/entities/char_2009.gif) O2
O2![[thin space (1/6-em)]](https://www.rsc.org/images/entities/char_2009.gif) :
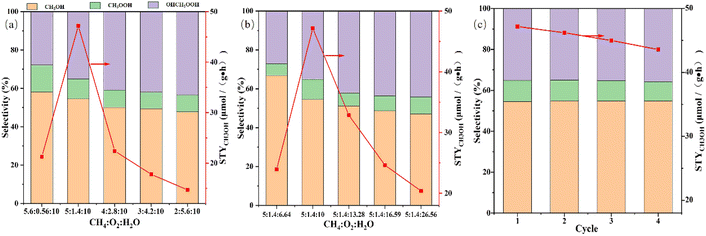
:![[thin space (1/6-em)]](https://www.rsc.org/images/entities/char_2009.gif) H2O to achieve methanol space-time yield improvement. Other articles have emphasized that the ratio of methane to oxygen has a stupendous effect on methanol yield.43,60,75 So while keeping the proportion of water unchanged, we change the molar ratio of methane to oxygen to observe the effect on reactivity. The consequence is shown in Fig. 9a. As we can comprehend from the picture that with the increasing proportion of oxygen, the selectivity of methanol has been decreasing, but the space-time yield of methanol has first increased and then decreased. And the best molar ratio is 5
H2O to achieve methanol space-time yield improvement. Other articles have emphasized that the ratio of methane to oxygen has a stupendous effect on methanol yield.43,60,75 So while keeping the proportion of water unchanged, we change the molar ratio of methane to oxygen to observe the effect on reactivity. The consequence is shown in Fig. 9a. As we can comprehend from the picture that with the increasing proportion of oxygen, the selectivity of methanol has been decreasing, but the space-time yield of methanol has first increased and then decreased. And the best molar ratio is 5![[thin space (1/6-em)]](https://www.rsc.org/images/entities/char_2009.gif) :
:![[thin space (1/6-em)]](https://www.rsc.org/images/entities/char_2009.gif) 1.4
1.4![[thin space (1/6-em)]](https://www.rsc.org/images/entities/char_2009.gif) :
:![[thin space (1/6-em)]](https://www.rsc.org/images/entities/char_2009.gif) 10, which helps the STYCH3OH to be maximized to 47.2 μmol g−1 h−1. This phenomenon suggests that in order to achieve higher methanol space-time yield, the molar ratio of methane to oxygen should be appropriate. Too little oxygen is not conducive to the activation of the catalyst, resulting in less methanol production, while too much oxygen will cause more serious excessive oxidation, and it is not beneficial to the preservation of the methanol produced. Effect of the proportion of water on STYCH3OH and methanol selectivity is shown in Fig. 9b. Keeping the molar ratio of methane to oxygen unchanged and adjusting the water content gradually increased, the trend of STYCH3OH and methanol selectivity are identical with Fig. 9a. The amount of water in this experimental setup has been excessive, which inhibits the oxidation of methanol well, so the space-time yield of methanol will initially increase. But when the content of water is several times that of methane and oxygen, too much water vapor can prevent methane and oxygen from coming into contact with the active site, thereby inhibiting methanol production. At the same time, the intermediate oxidation product OHCH2OOH will be better preserved, so the liquid phase selectivity of methanol will be reduced. Considering the STYCH3OH, molar ratio CH4
10, which helps the STYCH3OH to be maximized to 47.2 μmol g−1 h−1. This phenomenon suggests that in order to achieve higher methanol space-time yield, the molar ratio of methane to oxygen should be appropriate. Too little oxygen is not conducive to the activation of the catalyst, resulting in less methanol production, while too much oxygen will cause more serious excessive oxidation, and it is not beneficial to the preservation of the methanol produced. Effect of the proportion of water on STYCH3OH and methanol selectivity is shown in Fig. 9b. Keeping the molar ratio of methane to oxygen unchanged and adjusting the water content gradually increased, the trend of STYCH3OH and methanol selectivity are identical with Fig. 9a. The amount of water in this experimental setup has been excessive, which inhibits the oxidation of methanol well, so the space-time yield of methanol will initially increase. But when the content of water is several times that of methane and oxygen, too much water vapor can prevent methane and oxygen from coming into contact with the active site, thereby inhibiting methanol production. At the same time, the intermediate oxidation product OHCH2OOH will be better preserved, so the liquid phase selectivity of methanol will be reduced. Considering the STYCH3OH, molar ratio CH4![[thin space (1/6-em)]](https://www.rsc.org/images/entities/char_2009.gif) :
:![[thin space (1/6-em)]](https://www.rsc.org/images/entities/char_2009.gif) O2
O2![[thin space (1/6-em)]](https://www.rsc.org/images/entities/char_2009.gif) :
:![[thin space (1/6-em)]](https://www.rsc.org/images/entities/char_2009.gif) H2O = 5
H2O = 5![[thin space (1/6-em)]](https://www.rsc.org/images/entities/char_2009.gif) :
:![[thin space (1/6-em)]](https://www.rsc.org/images/entities/char_2009.gif) 1.4
1.4![[thin space (1/6-em)]](https://www.rsc.org/images/entities/char_2009.gif) :
:![[thin space (1/6-em)]](https://www.rsc.org/images/entities/char_2009.gif) 10 is the best experimental conditions, while the best value is 47.2 μmol g−1 h−1. Fig. 9c shows the stability test of Cu(2)/MoO3 in the optimized condition. We can find that the STYCH3OH is slightly reduced and the selectivity of liquid products are almost unchanged. Therefore, the catalysts possess a certain stability.
10 is the best experimental conditions, while the best value is 47.2 μmol g−1 h−1. Fig. 9c shows the stability test of Cu(2)/MoO3 in the optimized condition. We can find that the STYCH3OH is slightly reduced and the selectivity of liquid products are almost unchanged. Therefore, the catalysts possess a certain stability.
3.6. Probable reaction mechanism
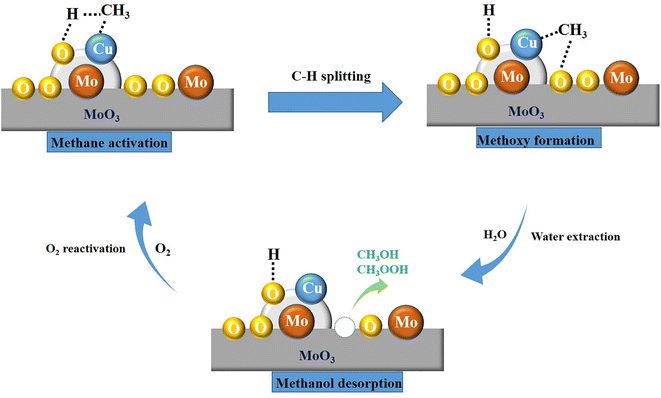
According to the above discussion, the probable reaction mechanism of methane oxidation to methanol is illustrated in Scheme 1. From the analysis on TS and Raman spectra, CuMoO4 is the main active component, which is indispensable for the methane adsorption and C–H splitting. And other articles have convinced that methane is connected with Cu element, then the C–H bond would be broken.43,50,52 Based on the result of 1H-NMR, CH3OH and CH3OOH are the main liquid products, which proved that the methoxy formation is a significant step. Therefore, after methane is adsorbed at the active site, it will react with the nearby reactive oxygen species to form a methoxy group. Many articles have demonstrated that water has extraction and weak oxidation functions in methane-to-methanol reactions.10,76,77 Thence, the methoxy group would convert to CH3OH and CH3OOH. After this step in the catalytic cycle, the active site will be inactivated, and the oxygen will mainly play a reactivation function and regenerate the catalyst activity. Thus, the probable reaction proceeds involve some basic steps as follows: (I) adsorption of methane molecule on the site of CuMoO4; (II) dehydrogenation of methane molecule into CH3−; (III) the –CH3 subsequently binds to the neighboring Cu attached O to form methoxy group; (IV) reaction with the OH− species derived from water; (V) CH3OH and CH3OOH formation and desorption from Cu/MoO3 interface; (VI) the catalyst activity is regenerated by O2 to complete the catalytic pathway.4. Conclusion
Cu/MoO3 catalyst prepared by a simple impregnation method is capable of achieving direct continuous oxidation of methane to methanol in the gaseous phase. Analysis of XRD, TEM and SEM data shows that Cu is uniformly dispersed on the surface of MoO3. And at the same time, it can interact with the carrier to form new species-CuMoO4. The characterization techniques such as TS, Raman, XPS and H2-TPR confirm the generation of CuMoO4 and illustrate its important role as a provider of active sites in the methane oxidation reaction. The improvement of methanol yield is accomplished by adjusting a series of reaction parameters. The loading of Cu and reaction temperature have a significant impact on the reactivity. Cu(2)/MoO3 catalyst reacted at 600 °C has the best performance among all experimental samples. Following by changing the molar ratio of CH4![[thin space (1/6-em)]](https://www.rsc.org/images/entities/char_2009.gif) :
:![[thin space (1/6-em)]](https://www.rsc.org/images/entities/char_2009.gif) O2
O2![[thin space (1/6-em)]](https://www.rsc.org/images/entities/char_2009.gif) :
:![[thin space (1/6-em)]](https://www.rsc.org/images/entities/char_2009.gif) H2O, methanol space-time yield reached its optimum value of 47.2 μmol g−1 h−1. In the single-step oxidation of methane to methanol, this catalyst demonstrates a new carrier possibility. And with more improvements, it has tremendous potential to accomplish high yield of methanol.
H2O, methanol space-time yield reached its optimum value of 47.2 μmol g−1 h−1. In the single-step oxidation of methane to methanol, this catalyst demonstrates a new carrier possibility. And with more improvements, it has tremendous potential to accomplish high yield of methanol.
Data availability
All relevant data are available from the authors on reasonable request.Author contributions
Wenjian Wu: conceptualization, formal analysis and writing-original draft; Wenzhi Li: funding acquisition and writing-review & editing; Mingwei Wu: writing-review & editing; Hao Zhang: software; Chen Zhu: investigation; Yihang Jiang: Investigation.Conflicts of interest
The authors declare no conflicts of interest.Acknowledgements
This work was supported by the Major Science and Technology Projects of Anhui Province (202003a05020022), the Key Research and Development Projects in Anhui Province (202004a06020053) and the Institute of Energy, Hefei Comprehensive National Science Center under Grant No. 21KZS219.References
- J. M. Chen, Innov., 2021, 2, 100127 CAS.
- L. Chen, G. Msigwa, M. Yang, A. I. Osman, S. Fawzy, D. W. Rooney and P. S. Yap, Environ. Chem. Lett., 2022, 20, 2277–2310 CrossRef CAS PubMed.
- R. Wang and L. Guo, IOP Conf. Ser. Earth Environ. Sci., 2020, 467, 012069 CrossRef.
- Y. Li and G. Veser, Energy Technol., 2020, 8, 2000460 CrossRef.
- Q. Y. Duan, C. H. Zhang, S. Sun, Y. Pan, X. Zhou, Y. Liu, K. Chen, C. S. Li, X. Z. Wang and W. Z. Li, J. Mater. Chem. A, 2020, 8, 7395–7404 RSC.
- A. W. Petrov, D. Ferri, F. Krumeich, M. Nachtegaal, J. A. van Bokhoven and O. Krocher, Nat. Commun., 2018, 9, 2545 CrossRef PubMed.
- D. Kiani, S. Sourav, Y. Tang, J. Baltrusaitis and I. E. Wachs, Chem. Soc. Rev., 2021, 50, 1251–1268 RSC.
- C. Karakaya and R. J. Kee, Prog. Energy Combust. Sci., 2016, 55, 60–97 CrossRef.
- S. Bai, Y. Xu, P. Wang, Q. Shao and X. Huang, ACS Catal., 2019, 9, 6938–6944 CrossRef CAS.
- X. Tang, L. Wang, B. Yang, C. Fei, T. Y. Yao, W. Liu, Y. Lou, Q. G. Dai, Y. F. Cai, X. M. Cao, W. C. Zhan, Y. L. Guo, X. Q. Gong and Y. Guo, Appl. Catal., B, 2021, 285, 119827 CrossRef CAS.
- W. N. Manan, W. N. R. Wan Isahak and Z. Yaakob, Catalysts, 2022, 12, 452 CrossRef CAS.
- D. A. Hickman and L. D. Schmidt, Science, 1993, 259, 343–346 CrossRef CAS PubMed.
- T. V. Choudhary and V. R. Choudhary, Angew. Chem., Int. Ed., 2008, 47, 1828–1847 CrossRef CAS PubMed.
- M. J. da Silva, Fuel Process. Technol., 2016, 145, 42–61 CrossRef.
- S. J. Freakley, N. Dimitratos, D. J. Willock, S. H. Taylor, C. J. Kiely and G. J. Hutchings, Acc. Chem. Res., 2021, 54, 2614–2623 CrossRef CAS PubMed.
- M. H. Ab Rahim, M. M. Forde, R. L. Jenkins, C. Hammond, Q. He, N. Dimitratos, J. A. Lopez-Sanchez, A. F. Carley, S. H. Taylor, D. J. Willock, D. M. Murphy, C. J. Kiely and G. J. Hutchings, Angew. Chem., Int. Ed. Engl., 2013, 52, 1280–1284 CrossRef CAS PubMed.
- G. Qi, T. E. Davies, A. Nasrallah, M. A. Sainna, A. G. R. Howe, R. J. Lewis, M. Quesne, C. R. A. Catlow, D. J. Willock, Q. He, D. Bethell, M. J. Howard, B. A. Murrer, B. Harrison, C. J. Kiely, X. Zhao, F. Deng, J. Xu and G. J. Hutchings, Nat. Catal., 2022, 5, 45–54 CrossRef CAS.
- N. Agarwal, S. J. Freakley, R. U. McVicker, S. M. Althahban, N. Dimitratos, Q. He, D. J. Morgan, R. L. Jenkins, D. J. Willock, S. H. Taylor, C. J. Kiely and G. J. Hutchings, Science, 2017, 358, 223–227 CrossRef CAS PubMed.
- J.-S. Min, H. Ishige, M. Misono and N. Mizuno, J. Catal., 2001, 198, 116–121 CrossRef CAS.
- Z. Jin, L. Wang, E. Zuidema, K. Mondal, M. Zhang, J. Zhang, C. Wang, X. Meng, H. Yang, C. Mesters and F. S. Xiao, Science, 2020, 367, 193–197 CrossRef CAS PubMed.
- F. Gu, X. Qin, M. Li, Y. Xu, S. Hong, M. Ouyang, G. Giannakakis, S. Cao, M. Peng, J. Xie, M. Wang, D. Han, D. Xiao, X. Wang, Z. Wang and D. Ma, Angew. Chem., Int. Ed. Engl., 2022, 61, e202201540 CAS.
- J. Shan, M. Li, L. F. Allard, S. Lee and M. Flytzani-Stephanopoulos, Nature, 2017, 551, 605–608 CrossRef CAS PubMed.
- M. W. Li, J. J. Shan, G. Giannakakis, M. Y. Ouyang, S. F. Cao, S. Lee, L. F. Allard and M. Flytzani-Stephanopoulos, Appl. Catal., B, 2021, 292, 120124 CrossRef CAS.
- R. Sharma, H. Poelman, G. B. Marin and V. V. Galvita, Catalysts, 2020, 10, 194 CrossRef CAS.
- Z. Zakaria and S. K. Kamarudin, Renew. Sustain. Energy Rev., 2016, 65, 250–261 CrossRef CAS.
- M. Alvarez, P. Marin and S. Ordonez, Mol. Catal., 2020, 487, 110886 CrossRef CAS.
- S. Grundner, M. A. Markovits, G. Li, M. Tromp, E. A. Pidko, E. J. Hensen, A. Jentys, M. Sanchez-Sanchez and J. A. Lercher, Nat. Commun., 2015, 6, 7546 CrossRef PubMed.
- A. Martini, M. Signorile, C. Negri, K. Kvande, K. A. Lomachenko, S. Svelle, P. Beato, G. Berlier, E. Borfecchia and S. Bordiga, Phys. Chem. Chem. Phys., 2020, 22, 18950–18963 RSC.
- M. Mao, L. Liu and Z. Liu, Molecules, 2022, 27, 7146 CrossRef CAS PubMed.
- D. T. Bregante, L. N. Wilcox, C. Liu, C. Paolucci, R. Gounder and D. W. Flaherty, ACS Catal., 2021, 11873–11884, DOI:10.1021/acscatal.1c03471.
- J. Ohyama, Y. Tsuchimura, A. Hirayama, H. Iwai, H. Yoshida, M. Machida, S. Nishimura, K. Kato and K. Takahashi, ACS Catal., 2022, 12, 2454–2462 CrossRef CAS.
- A. Hirayama, Y. Tsuchimura, H. Yoshida, M. Machida, S. Nishimura, K. Kato, K. Takahashi and J. Ohyama, Catal. Sci. Technol., 2021, 11, 6217–6224 RSC.
- B. Michalkiewicz, Appl. Catal., A, 2004, 277, 147–153 CrossRef CAS.
- B. Wu, T. J. Lin, Z. X. Lu, X. Yu, M. Huang, R. O. Yang, C. Q. Wang, C. Tian, J. Li, Y. H. Sun and L. S. Zhong, Chem, 2022, 8, 1658–1672 CAS.
- G. N. Li, P. Vassilev, M. Sanchez-Sanchez, J. A. Lercher, E. J. M. Hensen and E. A. Pidko, J. Catal., 2016, 338, 305–312 CrossRef CAS.
- G. Y. Zhao, E. Benhelal, A. Adesina, E. Kennedy and M. Stockenhuber, J. Phys. Chem. C, 2019, 123, 27436–27447 CrossRef CAS.
- J. R. Anderson and P. Tsai, J. Chem. Soc., Chem. Commun., 1987, 1435–1436, 10.1039/c39870001435.
- T. Yu, Z. Li, L. Lin, S. Q. Chu, Y. Su, W. Y. Song, A. Q. Wang, B. M. Weckhuysen and W. H. Luo, ACS Catal., 2021, 11, 6684–6691 CrossRef CAS.
- T. Yu, Y. Su, A. Wang, B. M. Weckhuysen and W. Luo, Chemcatchem, 2021, 13, 2766–2770 CrossRef CAS.
- Y. K. Chow, N. F. Dummer, J. H. Carter, C. Williams, G. Shaw, D. J. Willock, S. H. Taylor, S. Yacob, R. J. Meyer, M. M. Bhasin and G. J. Hutchings, Catal. Sci. Technol., 2018, 8, 154–163 RSC.
- M. V. Parfenov, E. V. Starokon, L. V. Pirutko and G. I. Panov, J. Catal., 2014, 318, 14–21 CrossRef CAS.
- H. V. Le, S. Parishan, A. Sagaltchik, H. Ahi, A. Trunschke, R. Schomäcker and A. Thomas, Chem.–Eur J., 2018, 24, 12592–12599 CrossRef CAS PubMed.
- S. E. Bozbag, P. Sot, M. Nachtegaal, M. Ranocchiari, J. A. van Bokhoven and C. Mesters, ACS Catal., 2018, 8, 5721–5731 CrossRef CAS.
- Z. Liu, E. Huang, I. Orozco, W. Liao, R. M. Palomino, N. Rui, T. Duchon, S. Nemsak, D. C. Grinter, M. Mahapatra, P. Liu, J. A. Rodriguez and S. D. Senanayake, Science, 2020, 368, 513–517 CrossRef CAS PubMed.
- M. T. Greiner, L. Chai, M. G. Helander, W. M. Tang and Z. H. Lu, Adv. Funct. Mater., 2013, 23, 215–226 CrossRef CAS.
- Y. Zhu, Y. Yao, Z. Luo, C. Pan, J. Yang, Y. Fang, H. Deng, C. Liu, Q. Tan, F. Liu and Y. Guo, Molecules, 2019, 25, 18 CrossRef PubMed.
- H. F. Liu, R. S. Liu, K. Y. Liew, R. E. Johnson and J. H. Lunsford, J. Am. Chem. Soc., 1984, 106, 4117–4121 CrossRef CAS.
- K. Aoki, M. Ohmae, T. Nanba, K. Takeishi, N. Azuma, A. Ueno, H. Ohfune, H. Hayashi and Y. Udagawa, Catal. Today, 1998, 45, 29–33 CrossRef CAS.
- C. Brookes, P. P. Wells, G. Cibin, N. Dimitratos, W. Jones, D. J. Morgan and M. Bowker, ACS Catal., 2014, 4, 243–250 CrossRef CAS.
- J. Zhu, F. Gao, L. Dong, W. Yu, L. Qi, Z. Wang, L. Dong and Y. Chen, Appl. Catal., B, 2010, 95, 144–152 CrossRef CAS.
- T. Akiyama, R. Sei and S. Takenaka, Catal. Sci. Technol., 2021, 11, 5273–5281 RSC.
- S. Patnaik, G. Swain and K. M. Parida, Nanoscale, 2018, 10, 5950–5964 RSC.
- B. Tang, W. Li, X. Zhang, B. Zhang, H. Zhang and C. Li, Fuel, 2022, 324, 124674 CrossRef CAS.
- W. G. Cortés Ortiz, D. Delgado, C. A. Guerrero Fajardo, S. Agouram, R. Sanchís, B. Solsona and J. M. López Nieto, Mol. Catal., 2020, 491, 110982 CrossRef.
- A. Wang and L. Olsson, Chem. Eng. J., 2020, 395, 125048 CrossRef CAS.
- Q. Lin, J. Liu, S. Liu, S. Xu, C. Lin, X. Feng, Y. Wang, H. Xu and Y. Chen, Dalton Trans., 2018, 47, 15038–15048 RSC.
- J. L. Brito, J. Laine and K. C. Pratt, J. Mater. Sci., 1989, 24, 425–431 CrossRef CAS.
- W. Yu, J. Zhu, L. Qi, C. Sun, F. Gao, L. Dong and Y. Chen, J. Colloid Interface Sci., 2011, 364, 435–442 CrossRef CAS.
- A. A. Latimer, A. Kakekhani, A. R. Kulkarni and J. K. Norskov, ACS Catal., 2018, 8, 6894–6907 CrossRef CAS.
- T. Takemoto, D. He, Y. Teng, K. Tabata and E. Suzuki, Appl. Catal., A, 2002, 225, 177–184 CrossRef CAS.
- J. S. Woertink, P. J. Smeets, M. H. Groothaert, M. A. Vance, B. F. Sels, R. A. Schoonheydt and E. I. Solomon, Proc. Natl. Acad. Sci. U. S. A., 2009, 106, 18908–18913 CrossRef CAS PubMed.
- P. J. Smeets, M. H. Groothaert and R. A. Schoonheydt, Catal. Today, 2005, 110, 303–309 CrossRef CAS.
- L. Huang, H. Xu, R. Zhang, X. Cheng, J. Xia, Y. Xu and H. Li, Appl. Surf. Sci., 2013, 283, 25–32 CrossRef CAS.
- P. C. H. Mitchell and F. Trifiro, J. Chem. Soc. A, 1970, 3183–3188 RSC.
- U. Steiner, T. Morgenstern, W. Reichelt, H. Borrmann and A. Simon, Z. fur Anorg. Allg. Chem., 1994, 620, 1905–1908 CrossRef CAS.
- B. Zhang, S. T. Xiang, A. I. Frenkel and I. E. Wachs, ACS Catal., 2022, 12, 3226–3237 CrossRef CAS.
- P. Chen, Z. Xie, Z. Zhao, J. Li, B. Liu, B. Liu, X. Fan, L. Kong and X. Xiao, Catal. Sci. Technol., 2021, 11, 4083–4097 RSC.
- B. Saravanakumar, G. Ravi, R. Yuvakkumar, V. Ganesh and R. K. Guduru, Mater. Sci. Semicond. Process., 2019, 93, 164–172 CrossRef CAS.
- L. Xu, W. Zhou, S. Chao, Y. Liang, X. Zhao, C. Liu and J. Xu, Adv. Energy Mater., 2022, 12, 2200101 CrossRef CAS.
- Q. L. Wu, S. X. Zhao, L. Yu, X. X. Zheng, Y. F. Wang, L. Q. Yu, C. W. Nan and G. Z. Cao, J. Mater. Chem. A, 2019, 7, 13205–13214 RSC.
- G. Wei, Z. Zhou, X. Zhao, W. Zhang and C. An, ACS Appl. Mater. Interfaces, 2018, 10, 23721–23730 CrossRef CAS PubMed.
- K. Chen, W. Z. Li, Z. A. Zhou, Q. F. Huang, Y. Liu and Q. Y. Duan, Catal. Sci. Technol., 2020, 10, 2573–2582 RSC.
- Y. Jiang, W. Li, K. Chen, X. Zhang, C. Shen and L. Yuan, Mol. Catal., 2022, 522, 112229 CrossRef CAS.
- J. F. Chen, X. Y. Wang, L. L. Zhang and Z. B. Rui, Appl. Catal., B, 2021, 297, 120410 CrossRef CAS.
- L. L. Sun, Y. Wang, C. M. Wang, Z. K. Xie, N. J. Guan and L. D. Li, Chem, 2021, 7, 1557–1568 CAS.
- B. Wu, T. Lin, M. Huang, S. Li, J. Li, X. Yu, R. Yang, F. Sun, Z. Jiang, Y. Sun and L. Zhong, Angew. Chem., Int. Ed., 2022, 61, e202204116 CAS.
- V. L. Sushkevich, D. Palagin, M. Ranocchiari and J. A. van Bokhoven, Science, 2017, 356, 523–527 CrossRef CAS.
Footnote |
| † Electronic supplementary information (ESI) available. See DOI: https://doi.org/10.1039/d3ra00058c |
| This journal is © The Royal Society of Chemistry 2023 |

