 Open Access Article
Creative Commons Attribution 3.0 Unported Licence
Combined theoretical and experimental insights on DNA and BSA binding interactions of Cu(II) and Ni(II) complexes along with the DPPH method of antioxidant assay and cytotoxicity studies†
Prasun Acharyaa,
Arun Kuilaa,
Ushasi Pramanikb,
Venkatesha R. Hathwarc,
Paula Brandao d,
Saptarshi Mukherjee
 b,
Swapan Maitye,
Tithi Maity
 f,
Ribhu Maitya and
Bidhan Chandra Samanta
 *a
*a
aDepartment of Chemistry, Mugberia Gangadhar Mahavidyalaya, Bhupatinagar, Purba Medinipur-721425, West Bengal, India. E-mail: bsmgm1977@gmail.com; bidhansamanta@yahoo.in; Tel: +91-3220-270236
bDepartment of Chemistry, IISER Bhopal, Bhopal Bypass Road, Bhauri, Bhopal 462 066, Madhya Pradesh, India
cSchool of Physical and Applied Sciences, Goa University, Taleigao Plateau, Goa 403 206, India
dDepartamento de Química, CICECO, Universidade de Aveiro, 3810-193 Aveiro, Portugal
eSchool of Materials Science and Technology (SMST), Indian Institute of Technology (IIT), BHU, India
fDepartment of Chemistry, Prabhat Kumar College, Purba Medinipur-721401, Contai, West Bengal, India
First published on 8th March 2023
Abstract
This present study delineates the syntheses, detailed characterization and anti-proliferative potential against SiHa (cervical cancer cell) of two mononuclear complexes of Cu(II) and Ni(II) using a Schiff base ligand (L) derived from 2-hydroxybenzaldehyde and N-methyl-propane 1,3-diamine. The crystallographic results show the centro-symmetric space group of orthorhombic nature (Pccn) for Cu(II) complex (1) where the central Cu(II) has an inversion center symmetry with six co-ordinations resulting in a distorted octahedral geometry. Whereas, in complex (2), the two independent Ni(II) atoms present in the special position within version symmetry and form a distorted geometry of octahedral nature with six coordinations. Absorption spectral titrations with Calf Thymus (CT) DNA and the extent of the decrease in relative emission intensities of DNA-bound ethidium bromide (EB) upon adding the complexes reveal the parallel trend in DNA binding affinities for both the complexes but with a small extent of binding capabilities. Bovine serum albumin (BSA) interaction studies demonstrate that complex 1 exhibits more promiscuous binding with BSA as compared to complex 2 from the spectroscopic and theoretical approaches. α,α-Diphenyl-β-picrylhydrazyl (DPPH) free radical scavenging method shows a little antioxidant or free radical scavenging activity for both the studied complexes. Cytotoxicity studies against SiHa expressed that the percentage of cell viability was reduced with time whereas in the same concentration and conditions, the viability percentage was higher for 3T3-L1 (several normal cell lines of mouse). The fluorescence imaging obtained from acridine orange (AO) and ethidium bromide (EtBr) demonstrates that the colour of the cancer cells has changed gradually dictating the cell apoptosis from day 1 to day 3.
Introduction
Co-ordination complexes of transition metals acquire notable anti-tumor, anti-microbial properties and provide broad opportunities in the field of drug discovery controlled by varieties of ligand, metal or changes in oxidation states of metal ions during coordination.1 The foremost privilege of these metal based drugs over organic pharmaceuticals is the capability of those compounds to adjust coordination number, redox states and geometry.2 Hence researchers are interested to use the transition metals as core constituent elements in the group of developed medicines, which in turn increase the significance of synthesizing metal complexes. Additionally, Schiff base complexes are of special interest in the bioinorganic field due to their chelation property3,4 and tuning efficacy between anti-tumor activity and substitutions used in the aromatic moieties.Over the past decades, cisplatin, the platinum-based drug has been extensively used efficiently in antitumor remedy but high toxicity and side effects have limited its use to patients. Copper5–8 and ruthenium9–15 complexes show potential anticancer properties and are considered as alternatives to platinum complexes. Copper, among the transition metals, is significantly essential in +2 oxidation states because in this state it has a vital responsibility in DNA damage linked to cancer16 and demonstrates general toxicity lower than platinum. So some Cu(II) co-ordination complexes are now projected as prospective tumor inhibiting substances.17–19 Not only Cu, nickel (Ni) complexes are also still emerging in this respect because of its exciting structural aspects, low cost, low toxicity and easy availability.20,21 Herein, we have reported the syntheses of Cu(II) and Ni(II) complexes containing Schiff base ligand of 2-hydroxybenzaldehyde and N-methyl-propane 1,3-diamine along with their characterizations through several experimental and theoretical approaches.
Researchers have also developed profound interests to decipher the interaction studies of those metal complexes with biomolecules viz. DNA22–25 and proteins.26–28 These investigations provide detailed information regarding the drug transporting, metabolism and promote the development of new metallo-pharmaceuticals. Consequently, the interaction study of metal-based complexes with albumin and DNA is one of the best models to get primary insights regarding the binding interactions of those complexes with biomolecules. DNA being the key target molecule for the majority of anticancer and antiviral therapies, thus, to develop prospective DNA targeting anti-proliferative drugs, the binding interactions of metal complexes to DNA are planned. In this regard, bovine serum albumin (BSA) has also been extensively used during the last decades due to its structural homology with HSA (Human Serum Albumin).29,30 As antioxidants effectively combat the free radicals which are known to cause various degenerative disorders, like mutagenesis, carcinogenesis, cardiovascular disturbances and ageing, so, it is important to measure antioxidant capacity that is free radical scavenging activity of a compound to be used as antitumor drug.31,32 α,α-Diphenyl-β-picrylhydrazyl (DPPH) free radical scavenging method offers the first approach for evaluating the antioxidant potential of a compound. It is a rapid, simple, inexpensive and widely used method to measure the ability of compounds to act as free radical scavengers.33
In this context, we have reported DPPH method for determining antioxidant capacity of the studied complexes along with binding interactions of those complexes with DNA and BSA using various spectroscopic techniques. The in vitro cytotoxic studies against SiHa cancer cells and 3T3-L1 normal cells have also been investigated in the present study.
Experimental section
Materials
Materials used for the experiments done in the current work were employed in the experiments without further purifications. From Merck, 2-hydroxybenzaldehyde, N-methyl propane 1,3-diamine, imidazole, methanol, CuCl2·2H2O, Ni(ClO4)2·6H2O etc. were procured. BSA and DNA was purchased from Sigma-Aldrich Chemicals (USA) and was prepared in 10 mM Phosphate Buffer (pH 7.4). For steady-state and time-resolved experiments, the concentration of BSA was kept as 5 μM, whereas 2 μM BSA was used for Circular Dichroism (CD) spectroscopic studies.Ligand (L) synthesis
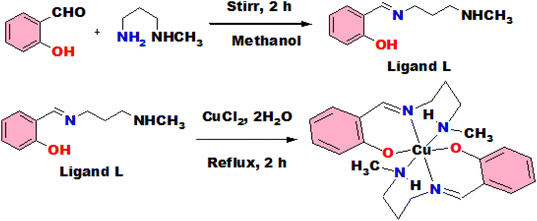
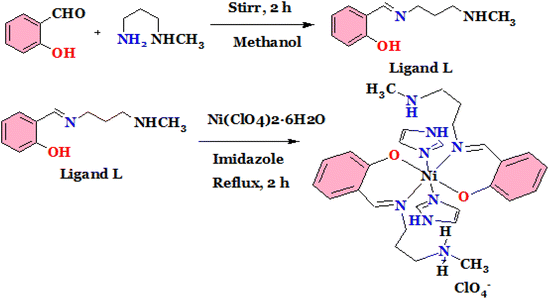
It was synthesized by stirring the mixture of 2-hydroxybenzaldehyde and N-methyl propane 1,3-diamine taking 1 mmol each in methanol for 2 h. The reaction mixture was transformed into a yellow solution and employed directly for the preparation of complexes (Scheme 1).Synthesis of complex (1)
Complex 1 was prepared by a refluxing mixture of CuCl2·2H2O (0.5 mmol) and L (1 mmol) for about 3 h in methanol. A green colour solution was observed and allowed to evaporate slowly (Scheme 1). Few days later, single crystals of green colour were produced from slow evaporation technique and employed for X-ray diffraction study.Yield: 85%. Molecular formula C22H30CuN4O2; characteristic FTIR peaks (KBr, cm−1; br = broad, s = strong, m = medium, vs = very strong): 1639 (m), 1317 (s), 1209 (s). UV absorption in MeOH [λmax, nm]: 375. Mass spectra m/z: expected for [C22H30CuN4O2]+ 445.55, observed 445.18.
Synthesis of complex (2)
This was synthesized by reacting the mixture of Ni(ClO4)2·6H2O (0.5 mmol), ligand (1 mmol) and imidazole (1 mmol) under reflux condition for about 3 h in methanol. A light brown colour solution was observed that was allowed to evaporate slowly. Few days later, single crystals were produced from slow evaporation technique and employed for X-ray diffraction study (Scheme 2).Yield: 86%. Molecular formula C28H39N8NiClO6; characteristic FTIR peaks (KBr, cm−1; br = broad, s = strong, m = medium, vs = very strong): 1648 (s), 3235 (m), 1442 (s), 1317 (s), 1203 (s), 3158 (m), 2950 (m). UV absorption in MeOH [λmax, nm]: 372. Mass spectra m/z: expected for [C28H39N8NiClO6]+ 677.19, found 677.49.
Characterizations
FTIR study was performed using KBr plate in Shimadzu IR Affinity – 1S spectrometer. For UV studies, UV-Vis spectrophotometer (Systronic, India) was employed. Mass spectroscopic study of the complex was carried out in Waters XEVO G2-XS QTOF mass spectrometer.Crystallographic studies by X-ray diffraction
Crystal data collection was performed at 150 K by a graphite monochromated X-ray diffractometer (Bruker Kappa) with Mo Kα radiation of λ = 0.71073 Å. APEX-II (v2.0-2) program (Bruker) was employed for data processing using φ and ω-scan techniques. For data correction towards Lorentz and polarization effects, SADABS program34 was used. SHELXT 2014/5 was utilized for solving the structure by direct method and subsequent refinement was performed with the help of F2 by means of SHELXL2018/3.35 Refinement of non-hydrogen atoms was done including parameters related to anisotropic displacement. Thermal parameters used for refinement of hydrogen atoms are 1.2 or 1.5 times greater than subsequent mother atoms. Table 1 shows data and parameters related to crystallographic studies of the complexes. The CCDC number, 2179951 (complex 1) and 2179957 (complex 2) are gained from CCDC Centre (Cambridge).| Crystal data | Complex (1) | Complex (2) |
| Chemical formula | C22H36CuN4O5 | C50H70Cl2N12Ni2O12 |
| Molecular weight | 500.09 | 1219.50 |
| Crystal system | Orthorhombic | Monoclinic |
| Space group | Pccn | P21/c |
| Wavelength (Å) | 0.71073 | 0.71073 |
| a (Å) | 16.0184(6) | 10.5595(5) |
| b (Å) | 17.2661(7) | 12.9431(7) |
| c (Å) | 8.8793(4) | 20.8682(11) |
| α (°) | 90 | 90 |
| β (°) | 90 | 98.743(2) |
| γ (°) | 90 | 90 |
| V (Å3) | 2455.79(17) | 2819.0(3) |
| Z | 4 | 2 |
| T (K) | 150 | 150 |
| μ (mm−1) | 0.93 | 0.83 |
| Crystal size (mm) | 0.18 × 0.08 × 0.04 | 0.26 × 0.18 × 0.04 |
| Tmin, Tmax | 0.851, 0.928 | 0.813, 0.967 |
| Measured reflections | 68![[thin space (1/6-em)]](https://www.rsc.org/images/entities/char_2009.gif) 421 421 |
79![[thin space (1/6-em)]](https://www.rsc.org/images/entities/char_2009.gif) 737 737 |
| Unique reflections | 2719 | 6226 |
| Observed reflections [I > 2σ(I)] | 2127 | 5407 |
| Rint | 0.049 | 0.032 |
| θrange | 2.36–27.15 | 1.86–27.13 |
| R[F2> 2σ(F2)], wR(F2), S | 0.040, 0.122, 1.129 | 0.035, 0.090, 1.071 |
| No. of parameters | 164 | 373 |
| H-atom treatment | Constrained | Constrained |
| Δρmax, Δρmin (e Å−3) | 0.45, −0.72 | 0.92, −0.96 |
Hirshfeld surface (HS) analyses
The quantitative analysis of intermolecular interactions in the crystal structure is obtained by HS analysis using Crystal Explorer 3.1 software.36 The HS analysis involves the partition of electron density (ED) of a molecule into atomic fragments such that a molecule within a crystal is given by a weighting functionwhere ρ(r) is a spherically averaged Hartree–Fock atomic ED function of ith nucleus. The cutoff of the weight function is 0.5 Å.
Further, the visualization of different interactions in the crystal structure is performed using different functions such as de, di, dnorm, shape index and curvedness mapped on the HS of the molecules. The normalized contact distance (dnorm) in the HS analysis is given by
Interaction studies with BSA
| F = Fobs × antilog(Aex+Aem)/2 | (1) |
 | (2) |
 | (3) |
 | (4) |
![[thin space (1/6-em)]](https://www.rsc.org/images/entities/char_2009.gif) 000.
000.| Scavenging activity (%) = [(A0 − A1)/A0] × 100 |
Cytotoxicity studies
 | (5) |
Results and discussions
Characterization of the complexes
The studied complexes were prepared according to the procedures as described in the Schemes 1 and 2 and spectroscopic characterizations were performed using FTIR and ESI-MS spectrophotometers. From X-ray single crystal studies, crystal structures were identified.The FTIR spectrum is shown in Fig. S1† for the complex from which it is observed that the strong peak for azomethine (C![[double bond, length as m-dash]](https://www.rsc.org/images/entities/char_e001.gif) N) group obtained at 1639 cm−1 indicating the formation of Schiff base. The band at 1317 cm−1 is assigned for aromatic C
N) group obtained at 1639 cm−1 indicating the formation of Schiff base. The band at 1317 cm−1 is assigned for aromatic C![[double bond, length as m-dash]](https://www.rsc.org/images/entities/char_e001.gif) C stretching and peak at 1209 cm−1 is due to C–C stretching. The Fig. S2† shows the FTIR spectrum for complex 2 from which it is observed that azomethine (C
C stretching and peak at 1209 cm−1 is due to C–C stretching. The Fig. S2† shows the FTIR spectrum for complex 2 from which it is observed that azomethine (C![[double bond, length as m-dash]](https://www.rsc.org/images/entities/char_e001.gif) N) group appears at 1648 cm−1. The bands at 3235 cm−1 and 1442 cm−1 are assigned for stretching and bending frequencies of N–H respectively. The characteristic stretching peaks for aromatic C
N) group appears at 1648 cm−1. The bands at 3235 cm−1 and 1442 cm−1 are assigned for stretching and bending frequencies of N–H respectively. The characteristic stretching peaks for aromatic C![[double bond, length as m-dash]](https://www.rsc.org/images/entities/char_e001.gif) C, C–C, aromatic C–H and aliphatic C–H are observed at 1317 cm−1, 1203 cm−1, 3158 cm−1 and 2950 cm−1 respectively which strongly support the formation of the said complex. The λmax values of 375 and 372 nm for complex 1 and 2 in the UV spectra are due to the π–π* transitions of aromatic rings and azomethine groups.
C, C–C, aromatic C–H and aliphatic C–H are observed at 1317 cm−1, 1203 cm−1, 3158 cm−1 and 2950 cm−1 respectively which strongly support the formation of the said complex. The λmax values of 375 and 372 nm for complex 1 and 2 in the UV spectra are due to the π–π* transitions of aromatic rings and azomethine groups.
The ESI-MS spectrum of the complexes 1 and 2 are shown in Fig. S3 and S4† respectively. From the spectra, it is noted that prominent peaks for the possible m/z fragmented values of the complexes are observed which support the crystallographic structures of the complexes.
Structural analyses for complex 1
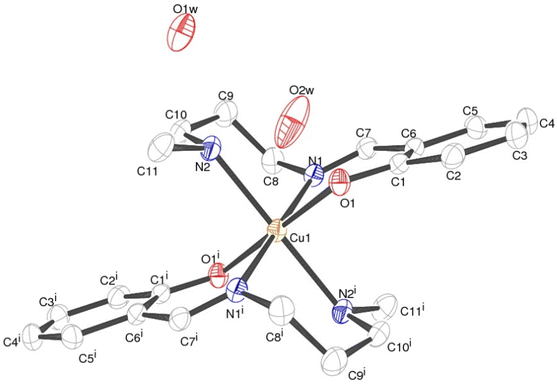
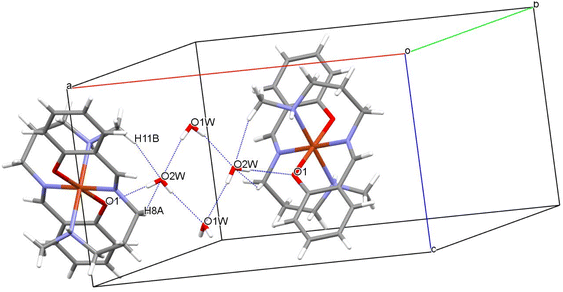
Crystallographic studies reveal the centro-symmetric space group of orthorhombic nature (Pccn) for the complex (1) in which a central Cu(II) is occupying an inversion center symmetry with six co-ordinations resulting in a distorted geometry of octahedral nature (Fig. 1). Table 1 shows all details regarding crystallographic and structural refinement. In the crystal, two water molecules are present and one of them is found on the 2-fold rotational axis. The Cu1–N2 is longer [2.184(2) Å] than the Cu1–N1 and Cu1–O1 bond lengths [2.050(2) Å] (Table S1†). The N–Cu–N, and O–Cu–N bond angle bond angles are in the range between 82.78(8)–87.13(8)° indicating that the {CuN4O2} octahedron is distorted (Table S1†). Hydrogen bonded water molecules form a channel along the ‘c’ axis. Fig. 2 depicts the H-bonding and the data are listed in Table 2. Hydrogen bonds from water molecules are strong and H⋯O distances vary from 2.075(3) to 2.176(5) Å. Further, water molecules are held by the molecular framework by feeble C–H⋯O interactions as shown in Fig. 2. The percentage contribution for various interactions obtained from HS fingerprint plot is shown in Fig. S5a.† Further, Fig. S6† expresses mapping of dnorm, shape-index and curvedness properties.| Interactions | Interaction distance d (Å) | Angle θ (°) | Symmetry |
|---|---|---|---|
| O2W–H2WA⋯O1 | 2.089(5) | 174.4(1) | x,y,z |
| C11–H11B⋯O2W | 2.637(3) | 143.6(1) | x,y,z |
| O2W–H2WB⋯O1W | 2.176(5) | 175.1(1) | x,−y + 1/2,+z + 1/2 |
| O2W–H2WB⋯O1W | 2.176(5) | 175.1(1) | −x + 1/2 + 1,+y,+z + 1/2 |
| O1W–H1W⋯O2W | 2.075(3) | 168.2(1) | −x + 1/2 + 1,−y + 1/2,+z |
| C8–H8A⋯O2W | 2.598(1) | 127.9(1) | −x + 1,−y + 1,−z + 1 |
Structural analyses for complex 2
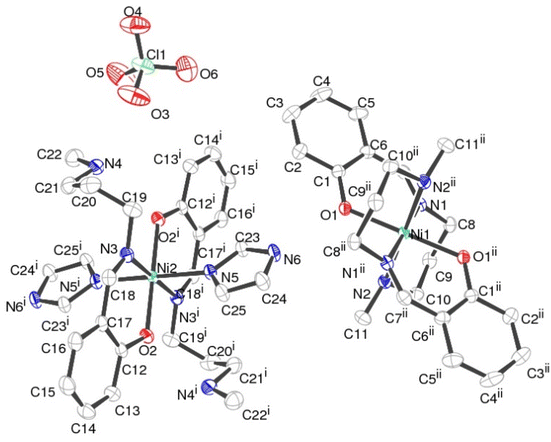
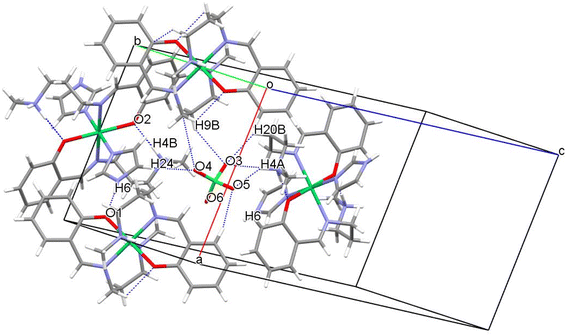
The crystallographic studies show that complex 2 possesses P21/c space group which is centrosymmetric and monoclinic in nature. There are two independent Ni(II) atoms present in the special position within version symmetry and resulting in a distorted octahedral geometry with six coordinations in the crystal structure (Fig. 3). Further, the charge is balanced by a perchlorate ion in the crystal structure. One of the Ni–N bond is longer [2.181(2) Å] than the remaining Ni–N and Ni–O bond lengths [about 2.046(2)Å] (Table S2†). The N–Ni–N, and O–Ni–N bond angle bond angles are in the range between 83.23(6)–89.05(6)° indicating that the {NiN4O2} octahedron is distorted (Table S2†). The perchlorate ion forms many structure stabilizing hydrogen bonds. Among them, hydrogen bonds consisting of N–H⋯O are strong with N–H⋯O angles of 175.0(1)–178.0(1)° and H⋯O distances of 1.731(3)–1.860(3)Å. Further, weak C–H⋯O interaction (Fig. 4 and Table 3) stabilizes the crystal structure. The percentage contribution for various interactions obtained from HS fingerprint plot is shown in Fig. S5b.† The H⋯O interactions constitute about 23.3% of total interactions present the packing of molecules. Fig. S7† expresses mapping of dnorm, shape-index and curvedness properties.| Interactions | Interaction distance d (Å) | Angle θ (°) | Symmetry |
|---|---|---|---|
| N4–H4B⋯O2 | 1.731(3) | 178.0(1) | −x + 1,−y + 1,−z + 1 |
| N6–H6⋯O1 | 1.860(3) | 175.0(1) | −x + 1,−y + 1,−z + 1 |
| C8–H8A⋯N6 | 2.817(2) | 146.1(1) | −x + 2,−y + 2,−z + 1 |
| C5–H5⋯O5 | 2.536(3) | 162.0(2) | −x + 2,+y + 1/2,−z + 1/2 |
| C9–H9B⋯O3 | 2.625(2) | 145.8(1) | x + 1,−y + 1/2 + 1,+z + 1/2 |
| C24–H24⋯O4 | 2.484(2) | 145.9(1) | x,−y + 1/2 + 1,+z + 1/2 |
| C19–H19A⋯O2 | 2.407(1) | 124.1(1) | −x + 1,−y + 1,−z + 1 |
| C13–H13⋯O6 | 2.770(3) | 146.3(1) | −x + 1,−y + 1,−z + 1 |
Interaction studies of the complexes with BSA
BSA has strong absorption at ∼280 nm which shows increment in the presence of complex 1 (Fig. S8a†) and complex 2 (Fig. S8b†). Upon excitation at 295 nm Tryptophan (W) of BSA elicits fluorescence emission centered at 350 nm,43–47 which shows reduction in its intensity (Fig. 5a and b) with successive addition of both the complexes as a result of quenching.37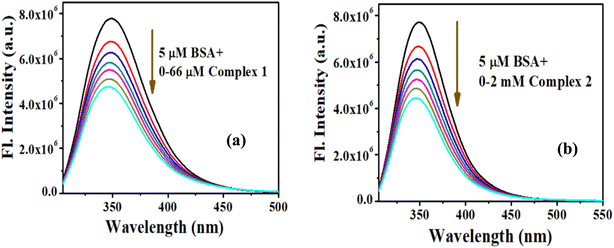 | ||
| Fig. 5 Emission spectra of BSA (5 μM) with rising concentrations of (a) complex 1 and (b) complex 2. | ||
Quenching of fluorescence intensity can be attributed to the ground-state complex formation between the quencher and fluorophore or excited-state collision/diffusion between fluorophore and quencher, which can be analyzed by using the Stern–Volmer equation:37
 | (6) |
 | (7) |
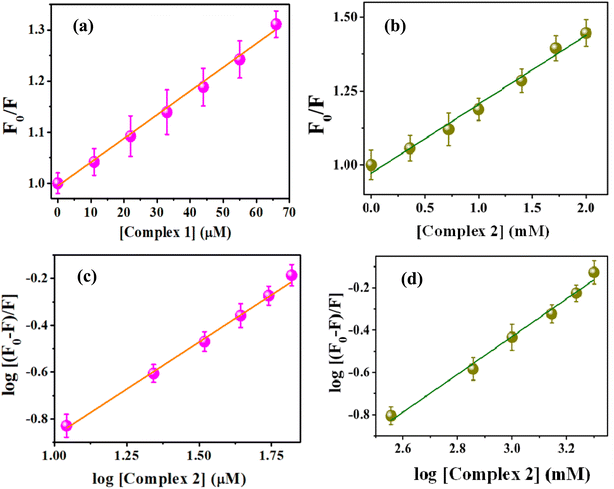 | ||
| Fig. 6 SV plot of interaction between BSA with (a) complex 1 and (b) complex 2. Double log plot of interaction between BSA with (c) complex 1 and (d) complex 2. | ||
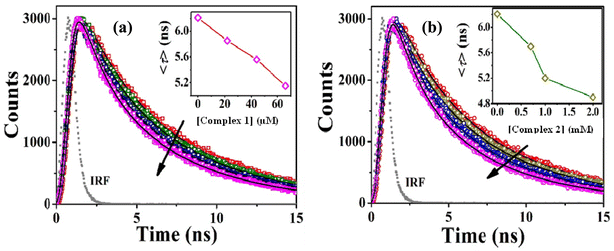
To elucidate the exact nature of binding phenomenon, we further performed time-resolved studies. The excited-state lifetime of tryptophan in BSA decreases with rising concentrations of complex 1 and 2. The reduction in the lifetime dictates the quenching nature is a result of the excited-state collision of BSA with the complexes (Fig. 7a and b, Tables S4 and S5†). A plot of F0/F or τ0/τ as a function of the concentration of complexes (Fig. S9a and b†) follows similar trend. This observation also depicts that the quenching of BSA occurs through excited-state collision or diffusion with the said complexes. Thus, it can be concluded that the quenching governing the said interaction is dynamic in nature.37
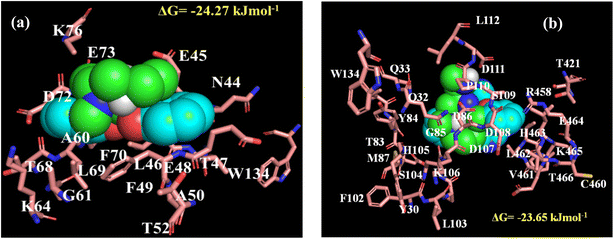
Furthermore, we have investigated the changes in the conformation of the protein upon the said interactions by circular dichroism (CD) spectroscopy. BSA shows helical nature in the CD spectra (Fig. S10a and b†) with two negative ellipticity bands at 222 nm and 208 nm corresponding to n → π* and π → π* transitions, respectively.44 It is important to note that, we could not monitor the CD spectra of the protein in the presence of the complexes below 220 nm, as they show strong absorption below this wavelength range and also due to observing high voltage values for the instrumental limitation within the mentioned wavelength range.44 None of the complexes cause any alteration in the secondary structure of BSA enabling the fact that though both the complexes interact with the protein, they have not induced any structural changes of the native state of BSA. To predict the probable binding site of the complexes within BSA, we have performed AutoDock based blind molecular docking study. The complexes locate them within BSA (Fig. S11a and b†). Moreover, the binding locale of both the complexes is in near vicinity with tryptophan and some hydrophobic amino acid residues of the protein (Fig. 8a and b). The observed binding energy from docking study also dictates that complex 1 has more affinity than complex 2, which well corroborate with our steady-state observations (Table S3†). The binding energies for the complex 1 and complex 2 with BSA were estimated as −24.27 kJ mol−1 and −23.65 kJ mol−1 respectively.
DNA binding results
The changes in absorption maximum value of 5 μM of CT-DNA was governed by the addition of both the complexes and the results are shown in Fig. S16a & b.† It is observed that the intensity of the band for DNA slightly increases with addition of high concentration of the complexes. These clearly indicate that there is a little binding affinity of the complexes with the base pairs of CT-DNA.In the fluorescence studies, CT-DNA bounded ethidium bromide (EtBr) shows an emission at 612 nm on excitation at 500 nm. On addition of the complex, almost no quenching of the EtBr-(CT-DNA) fluorescence intensity obtained for both the complexes (Fig. 9). This is further supported from the molecular docking studies of complex 1 and 2 with ct-DNA (Fig. S17 & S18†). The binding energies (change of free energy) for complex 1, 2 and EtBr with ct-DNA were found as −21.84, −21.21 and −36.21 kJ mol−1 respectively which reflects the weak capability of the complexes for quenching the fluorescence intensity of EtBr-(CT-DNA) adduct by replacing EtBr from this adduct. All these DNA binding studies clearly demonstrate no significant binding capability of the complexes with DNA.
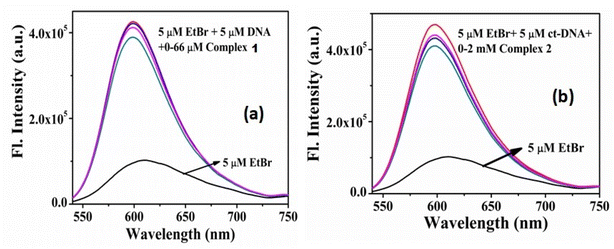 | ||
| Fig. 9 Addition effects of complexes 1 and 2 on the emission intensity of the CT-DNA bound EtBr at different concentrations. | ||
In vitro DPPH assay for antioxidant activities
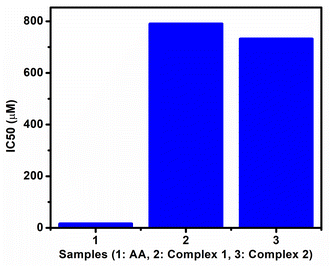
The oxidative assay of DPPH is used extensively for assessing the capability of radical scavenging activity or hydrogen donor's ability of complexes in terms of IC50 values (50% inhibition).42 The examined changes in the free radical scavenging ability of the test complexes on the basis of percentage inhibition are presented in Fig. S19a–c.† From the comparison plot of IC50 values (Fig. 10), it is shown that the studied complexes showed weak antioxidant activities with respect to ascorbic acid (AA) used as standard and it is also revealed that complex 2 showed slightly better antioxidant capacity than complex 1. The pictures which show color changes on gradual addition of AA and complexes to pure DPPH violet solution (Fig. S13b, S14b & S15b†) also support the above facts.In vitro cytotoxicity studies
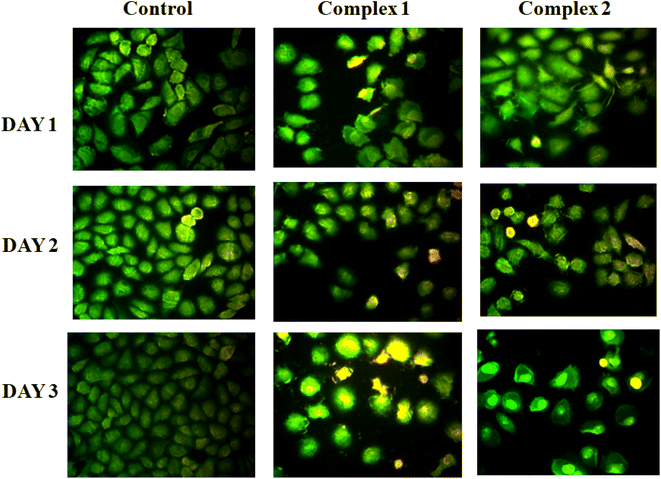
Cytotoxic effect of the studied complexes against SiHa cancer cells and cell proliferation inhibition have been inspected in vitro after incubation of cells by fixed concentration of the complexes for 72 h using MTT assay. As control, the refined cells without sample are taken and 50 μg mL−1 of each complex was utilized for this study. Fig. S12† shows the results with mean ±1–1.5 standard deviation values with respect to individual experiments. Studies showed that for both the cases, presence of complex caused a momentous gradual decreasing of cell viabilities with time in cancerous cell lines than the control revealing their cytotoxic nature. To support these data additionally, fluorescent images were collected using AO and EtBr dye. AO and EtBr recognize the normal cells from apoptotic cells on the basis of cell membrane permeability. It is generally observed that AO shows green fluorescence and EtBr demonstrates red fluorescence on binding with DNA. Generally, dead cells shine red and permeable to both the AO and EtBr dye. Whereas, the living cells shine green and permeate only AO. After treatment, the comparative number density of cells can be visualized from fluorescent images of specimen staining with AO/EtBr (Fig. 11). Moreover, the colour of the cell after treatment gradually changes from green to yellow indicating cell apoptosis from day 1 to day 3. The cell viability obtained for the complexes after 72 h against the cancer cells is very much analogous to the reported values in literature.48,49 So, the complexes are significantly cytotoxic in nature and have potential to act as anticancer agent.We have also checked the cytotoxicity of the studied complexes against normal cell besides cancer cell lines to ensure whether our complexes are toxic or not against normal cell. We have observed that the cell viability percentages of our complexes against 3T3-L1 cells (several normal cell lines of mouse) are higher (Fig. S20†) than cancer cell lines indicating that our complexes are less toxic with the normal cell but more toxic against cancer cell thereby demonstrating their uses as anticancer therapeutics.
Conclusions
The present investigation derives from the syntheses and characterizations of Cu(II) and Ni(II) Schiff base complexes with respect to crystal structure, Hirshfeld surface, BSA interaction and cytotoxicity studies against SiHa cancer cell. Both the complex 1 and complex 2 show a distorted octahedral geometry in the crystal structure. From the experimental studies of BSA interaction it is observed that complex 1 shows greater binding competence with BSA than complex 2 whereas DNA binding results reveal the similar trend in DNA binding affinities for both the complexes with a small extent of binding capabilities. The DPPH assay studies demonstrate that the studied complexes possess weak antioxidant activities with respect to standard ascorbic acid (AA). Interestingly, these newly designed complexes depicted the in vitro anti-proliferative activities against SiHa cancerous cells. The strong protein binding affinity of the complexes apart from their weak DNA binding affinities may be responsible for the cytotoxicity against SiHa cancerous cell. Moreover, these complexes are less toxic for 3T3-L1 normal cell lines demonstrating their scope in chemo-therapeutics as specific anticancer components.Conflicts of interest
It is hereby confirmed that no conflicts of interest to be declared.Acknowledgements
Financial assistance from DBT, Govt. of India to Mugberia Gangadhar Mahavidyalaya under Star College Strengthening Scheme (Order No. HRD-11011/161/2020-HRD-DBT, Dated 24/08/2020) is sincerely acknowledged by Dr Bidhan Chandra Samanta. FTIR and Mass spectroscopic data collection and analyses by Dr Debaprasad Mandal, Dept. of Chemistry, IIT, Ropar are gratefully acknowledged here. Kind assistance from Prof. Pralay Maiti, IIT, BHU for cell viability studies is sincerely acknowledged. Prasun Acharya and Arun Kuila wish to thank the authority of Mugberia Gangadhar Mahavidyalaya for having laboratory facilities to carry out the experiments. Ushasi Pramanik would like to acknowledge IISER Bhopal for fellowship. Paula Brandao would like to acknowledge financial assistance of national funds through the FCT/MCTES (PIDDAC) for the project CICECO-Aveiro Institute of Materials, UIDB/50011/2020, UIDP/50011/2020 & LA/P/0006/2020.References
- C. Orvig and M. J. Abrams, Medicinal inorganic chemistry: introduction, Chem. Rev., 1999, 99, 2201–2204 CrossRef CAS PubMed.
- N. Pravin and N. Raman, DNA interaction and antimicrobial activity of novel tetradentate imino-oxalato mixed ligand metal complexes, Inorg. Chem. Commun., 2013, 36, 45–50 CrossRef CAS.
- S.-Y. Lee, A. Hille, C. Frias, B. Kater, B. Bonitzki, S. Wölfl, H. Scheffler, A. Prokop and R. Gust, [NiII(3-OMe-salophene)]: A Potent Agent with Antitumor Activity, J. Med. Chem., 2010, 53, 6064–6070 CrossRef CAS PubMed.
- C. P. Matos, A. Valente, F. Marques, P. Adao, M. P. Robalo, R. F. M. de Almeida, J. C. Pessoa, I. Santos, M. H. Garcia and A. I. Tomaz, New polydentate Ru (III)-Salan complexes: Synthesis, characterization, anti-tumour activity and interaction with human serum proteins, Inorg. Chim. Acta, 2013, 394, 616–626 CrossRef CAS.
- P. U. Maheswari, S. Roy, H. D. Dulk, S. Barends, G. V. Wezel, B. Kozlevcar, P. Gamez and J. Reedijk, The Square-Planar Cytotoxic [CuII(pyrimol)Cl] Complex Acts as an Efficient DNA Cleaver without Reductant, J. Am. Chem. Soc., 2006, 128, 710–711 CrossRef CAS PubMed.
- J. D. Ranford, P. J. Sadler and D. A. Tocher, Cytotoxicity and antiviral activity of transition-metal salicylato complexes and crystal structure of Bis(diisopropylsalicylato)(1,10 phenanthroline)copper(II), J. Chem. Soc., Dalton Trans., 1993, 22, 3393–3399 RSC.
- C. H. Ng, K. C. Kong, S. T. Von, P. Balraj, P. Jensen, E. Thirthagiri, H. Hamada and M. Chikira, Synthesis, characterization, DNA-binding study and anticancer properties of ternary metal(ii) complexes of edda and an intercalating ligand, Dalton Trans., 2008, 4, 447–454 RSC.
- A. Barve, A. Kumbhar, M. Bhat, B. Joshi, R. Butcher, U. Sonawane and R. Joshi, Mixed-ligand copper(II) maltolate complexes: synthesis, characterization, DNA binding and cleavage, and cytotoxicity, Inorg. Chem., 2009, 48, 9120–9132 CrossRef CAS PubMed.
- A. C. G. Hotze, B. M. Kariuki and M. Hannon, Dinuclear Double-Stranded Metallo supramolecular Ruthenium Complexes: Potential Anticancer Drugs, Angew. Chem., Int. Ed., 2006, 45, 4839–4842 CrossRef PubMed.
- C. G. Hartinger, S. Zorbas-Seifried, M. A. Jakupec, B. Kynast, H. Zorbas and B. K. Keppler, From bench to bedside--preclinical and early clinical development of the anticancer agent indazolium trans-[tetrachlorobis (1H-indazole)ruthenate(III)] (KP1019 or FFC14A), J. Inorg. Biochem., 2006, 100, 891–904 CrossRef CAS PubMed.
- M. A. Fuertes, C. Alonso and M. Perez, Biochemical modulation of Cisplatin mechanisms of action: enhancement of antitumor activity and circumvention of drug resistance, J. Chem. Rev., 2003, 103, 645–662 CrossRef CAS PubMed.
- M. Cocchietto and G. Sava, Blood concentration and toxicity of the antimetastasis agent NAMI-A following repeated intravenous treatment in mice, J. Pharmacol. Toxicol., 2000, 87, 193–207 CrossRef CAS PubMed.
- G. Sava, K. Clerici, I. Capozzi, M. Cocchietto, R. Gagliardi, E. Alessio, G. Mestroni and A. Perbellini, Reduction of lung metastasis by ImH[trans-RuCl4(DMSO)Im]: mechanism of the selective action investigated on mouse tumors, Anti-Cancer Drugs, 1999, 10, 129–138 CrossRef CAS PubMed.
- E. D. Kreuser, B. K. Keppler, W. E. Berdel, A. Piest and E. Thiel, Synergistic antitumor interactions between newly synthesized ruthenium complexes and cytokines in human colon carcinoma cell lines, Semin. Oncol., 1992, 19, 73–81 CAS.
- K. Y. Yan, V. Melchart, A. Habtemariam and P. Sadler, Organometallic chemistry, biology and medicine: ruthenium arene anticancer complexes, Chem. Commun., 2005, 38, 4764–4776 RSC.
- B. N. Ames, M. K. Shigenaga and T. M. Hagen, Oxidants, antioxidants, and the degenerative diseases of aging, Proc. Natl. Acad. Sci. U. S. A., 1993, 90, 7915–7922 CrossRef CAS PubMed.
- K. Jeyalakshmi, N. Selvakumaran, N. S. P. Bhuvanesh, A. Sreekanth and R. Karvembu, DNA/protein binding and cytotoxicity studies of copper(II) complexes containing N,N′,N′′-trisubstituted guanidine ligands, RSC Adv., 2014, 4, 17179–17195 RSC.
- B. C. Bales, T. Kodama, Y. N. Weledji, M. Pitie, B. Meunier and M. M. Greenberg, Mechanistic studies on DNA damage by minor groove binding copper-phenanthroline conjugates, Nucleic Acids Res., 2005, 33, 5371–5379 CrossRef CAS PubMed.
- D. H. Petering, Carcinostatic copper complexes, in Metal Ions in Biological Systems ed. Siget, H., Marcel Dekker, New York, 1980, vol. 11, pp. 197–229 Search PubMed.
- N. Zhang, R. Jin, G. Mao, J. Tan, L. Chen, C. Li and J. Wang, Nickle-Schiff base covalently grafted to UiO-66-NH2 as heterogeneous catalyst for ethylene oligomerization, Inorg. Chim. Acta, 2022, 531, 120674 CrossRef CAS.
- Z. Afrasiabi, E. Sinn, W. Lin, Y. Ma, C. Campana and S. Padhye, Nickel (II) complexes of naphthaquinone thiosemicarbazone and semicarbazone: Synthesis, structure, spectroscopy, and biological activity, J. Inorg. Biochem., 2005, 9, 1526–1531 CrossRef PubMed.
- S. Rajalakshmi, M. S. Kiranb and B. U. Nair, DNA condensation by copper(II) complexes and their anti-proliferative effect on cancerous and normal fibroblast cells, Eur. J. Med. Chem., 2014, 80, 393–406 CrossRef CAS PubMed.
- F. Arjmand, G. C. Sharma, M. Muddassir and S. Tabassum, Synthesis and enantiopreferential DNA-binding profile of late 3d transition metal R- and S-enantiomeric complexes derived from N,N-bis-(1-benzyl-2-ethoxyethane): validation of R-enantiomer of copper(II) complex as a human topoisomerase II inhibitor, Chirality, 2013, 23, 557–567 CrossRef PubMed.
- A. C. Komor and J. K. Barton, The path for metal complexes to a DNA target, Chem. Commun., 2013, 49, 3617–3630 RSC.
- N. Pravin and N. Raman, Investigation of in vitro anticancer and DNA strap interactions in live cells using carboplatin type Cu(II) and Zn(II) metalloinsertors, Eur. J. Med. Chem., 2014, 85, 675–687 CrossRef CAS PubMed.
- C. Santini, M. Pellei, V. Gandin, M. Porchia, F. Tisato and C. Marzano, Advances in Copper Complexes as Anticancer Agents, Chem. Rev., 2014, 114, 815–862 CrossRef CAS PubMed.
- M. Kumar, G. Kumar, K. M. Dadure and D. T. Masram, Copper(II) complexes based on levofloxacin and 2N-donor ligands: synthesis, crystal structures and in vitro biological evaluation, New J. Chem., 2019, 43, 15462–15481 RSC.
- M. Kumar, G. Kumar and D. T. Masram, Copper(II) complexes containing enoxacin and heterocyclic ligands: synthesis, crystal structures and their biological perspectives, New J. Chem., 2020, 44, 8595–8613 RSC.
- N. Zhou, Y. Z. Liang and P. Wang, 18β–Glycyrrhetinic acid interaction with bovine serum albumin, J. Photochem. Photobiol., A, 2007, 185, 271–276 CrossRef CAS.
- L. Shang, X. Jiang and S. Dong, In vitro study on the binding of neutral red to bovine serum albumin by molecular spectroscopy, J. Photochem. Photobiol., A, 2006, 184, 93–97 CrossRef CAS.
- S. Singh and R. P. Singh, In vitro methods of assay of antioxidants: an overview, Food Rev. Int., 2008, 24, 392–415 CrossRef.
- K. Cui, X. Luo and M. R. V. Murthy, Role of oxidative stress in neurodegeneration: recent developments in assay methods for oxidative stress and nutraceutical antioxidants, Prog. Neuropsychopharmacol. Biol., 2004, 28, 771–799 CrossRef CAS PubMed.
- S. B. Kedare and R. P. Singh, Genesis and development of DPPH method of antioxidant assay, J. Food Sci. Technol., 2011, 48, 412–422 CrossRef CAS PubMed.
- G. M. Sheldrick, SADABS, University of Göttingen, Germany, 1996 Search PubMed.
- G. M. Sheldrick, A short history of SHELX, Acta Crystallogr., Sect. A: Found. Crystallogr., 2008, 64, 112–122 CrossRef CAS PubMed.
- M. A. Spackman and D. Jayatilaka, Hirshfeld Surface Analysis, CrystEngComm, 2009, 11, 19–32 RSC.
- J. R. Lakowicz, Principles of Fluorescence Spectroscopy; Plenum, New York, 3rd edn, 2006 Search PubMed.
- U. Pramanik, A. A. Kongasseri, S. Shekhar, A. Mathew, R. Yadav and S. Mukherjee, Structural Compactness in Hen Egg White Lysozyme Induced by Bisphenol S: A Spectroscopic and Molecular Dynamics Simulation Approach, ChemPhysChem, 2021, 22, 1745–1753 CrossRef CAS PubMed.
- G. M. Morris, D. S. Goodsell, R. S. Halliday, R. Huey, W. E. Hart, R. K. Belew and A. J. Olsen, Automated docking using a Lamarckian genetic algorithm and an empirical binding free energy function, J. Comput. Chem., 1998, 19, 1639–1662 CrossRef CAS.
- J. Frisch, G. W. Trucks, H. B. Schlegel, G. E. Scuseria, M. A. Robb, J. R. Cheeseman, G. Scalmani, V. Barone, B. Mennucci, G. A. Petersson, et. al., Gaussian 09 Revision E.01, Inc., Pittsburg, PA, 2009 Search PubMed.
- Schrödinger, L. L. C., The PyMOL Molecular Graphics System, Version-1.8, 2015 Search PubMed.
- M. S. Blois, Antioxidant determinations by the use of a stable free radical, Nature, 1958, 181, 1199–1200 CrossRef CAS.
- U. Anand, L. Kurup and S. Mukherjee, Deciphering the role of pH in the binding of Ciprofloxacin Hydrochloride to Bovine Serum Albumin, Phys. Chem. Chem. Phys., 2012, 14, 4250–4258 RSC.
- R. Maity, N. Sepay, U. Pramanik, K. Jana, S. Mukherjee, S. Maity, D. Mal, T. Maity and B. C. Samanta, Exploring the Noncovalent Interactions of the Dinuclear Cu (II) Schiff Base Complex with Bovine Serum Albumin and Cell Viability against the SiHa Cancer Cell Line, J. Phys. Chem. B, 2021, 125, 11364–11373 CrossRef CAS PubMed.
- U. Anand, C. Jash, R. K. Boddepalli, A. Shrivastava and S. Mukherjee, Exploring the Mechanism of Fluorescence Quenching in Proteins Induced by Tetracycline, J. Phys. Chem. B, 2011, 115, 6312–6320 CrossRef CAS PubMed.
- M. Bhattacharya, N. Jain and S. Mukhopadhyay, Insights into the Mechanism of Aggregation and Fibril Formation from Bovine Serum Albumin, J. Phys. Chem. B, 2011, 115, 4195–4205 CrossRef CAS PubMed.
- R. Ghosh and N. Kishore, Physicochemical Insights into the Role of Drug Functionality in Fibrillation Inhibition of Bovine Serum Albumin, J. Phys. Chem. B, 2020, 124, 8989–9008 CrossRef CAS PubMed.
- N. Margiotta, G. Natile, F. Capitelli, F. P. Fanizzi, A. Boccarelli, P. D. Rinaldis, D. Giordano and M. Coluccia, Sterically hindered complexes of platinum(II) with planar heterocyclic nitrogen donors. A novel complex with 1-methyl-cytosine has a spectrum of activity different from cisplatin and is able of overcoming acquired cisplatin resistance, J. Inorg. Biochem., 2006, 100, 1849–1857 CrossRef CAS PubMed.
- C. Barbara, P. Orlandi, G. Bocci, A. Fiorovanti, A. D. Paolo, G. Natale, M. D. Tacca and R. Danesi, In vitro and in vivo antitumour effects of novel, orally active bile acid-conjugated platinum complexes on rat hepatoma, Eur. J. Pharmacol., 2006, 549, 27–34 CrossRef CAS PubMed.
Footnote |
| † Electronic supplementary information (ESI) available. CCDC 2179951 and 2179957 for complex 1 and 2 respectively. For ESI and crystallographic data in CIF or other electronic format see DOI: https://doi.org/10.1039/d2ra08341h |
| This journal is © The Royal Society of Chemistry 2023 |

