 Open Access Article
Facile preparation and dielectric properties of BaTiO3 with different particle sizes and morphologies
Xinxiao Wu a,
Hepan Zhaoa,
Weining Hana,
Zhimiao Wang
 a,
Fang Liab,
Jing Li*c and
Wei Xue
 *ab
*ab
aHebei Provincial Key Laboratory of Green Chemical Technology, High Efficient Energy Saving, School of Chemical Engineering and Technology, Hebei University of Technology, Tianjin 300130, China. E-mail: weixue@hebut.edu,cn
bTianjin Key Laboratory of Chemical Process Safety, Tianjin 300130, China
cSchool of Civil and Transportation Engineering, Hebei University of Technology, Tianjin 300401, China
First published on 6th April 2023
Abstract
BaTiO3 nanoparticles were prepared by the hydrothermal method, and the effect of 1-(propyl-3-methoxysilyl)-3-methylimidazole chloride on the size of BaTiO3 particles was investigated. The obtained BaTiO3 was characterized by XRD, SEM, TEM, and Raman spectroscopy; and the dielectric properties of BaTiO3 ceramic sheets were tested. The results indicate that the spherical BaTiO3-N prepared without an ionic liquid was in a tetragonal phase with an average particle size of 129 nm. When an ionic liquid was added, the size of the BaTiO3-IL decreased and the degree of agglomeration increased. In addition, with increasing quantity of ionic liquid, the tetragonal-phase content of BaTiO3-IL gradually decreased until complete transformation into cubic phase. The dielectric constant of the BaTiO3-N ceramics was the highest, and the dielectric constant decreased with decreasing BaTiO3 particle size. Moreover, two types of BaTiO3 nanoparticles (bowl- and sea urchin-shaped) were prepared by changing the hydrothermal conditions and additives. The average particle size of the former was 92 nm, the tetragonal-phase content was ca. 90%, and the dielectric constant was large; whereas the sea urchin-shaped BaTiO3 consisted of small particles in the cubic phase, and the dielectric constant was small.
1. Introduction
Barium titanate (BaTiO3) is a ferroelectric compound with excellent properties in the barium oxide–titanium dioxide (BaO–TiO2) system,1 which exhibits good dielectric as well as ferroelectric properties and is the basic material for electronic ceramic components.2,3 Barium titanate nanoparticles are widely used to make small, high-capacity microcapacitors and temperature-compensating components;4,5 as well as nonlinear components, dielectric amplifiers, memory components for electronic computers, ceramic sensitive components, microwave ceramics, and piezoelectric ceramics.6,7 In recent years, with the continuous development of the electronics industry, the demand for BaTiO3-based ceramics has been increasing; and higher requirements for BaTiO3 purity, particle size, crystal shape, and dispersion have been proposed.1,8 There is broad utility in preparing high-purity, ultrafine BaTiO3 powder.9,10Currently, the main methods for synthesizing nano-BaTiO3 include solid-phase synthesis, co-precipitation, sol–gel, and hydrothermal synthesis.11,12 Solid-phase synthesis requires a high temperature of ca. 1100 °C, and the resulting barium titanate powder exhibits a large grain size as well as low powder purity.13 Co-precipitation requires high-temperature roasting, which is prone to impart agglomeration of and a nonuniform particle size to the synthesized powder.12 Sol–gel method process conditions are not suitable for control and the organic solvent is highly toxic.14,15 In contrast, the hydrothermal method is excellent for preparing BaTiO3 powder.1 The resulting powder or nanocrystals are well-developed, with a composition close to stoichiometry as well as a uniform and controllable particle size distribution, and the average grain size of the resulting nano-BaTiO3 is small (as little as tens or even several nanometers).16,17 At present, BaTiO3 particles obtained by hydrothermal preparation with Ba(OH)2·8H2O and TiO2 as raw materials are is generally >100 nm in size and require high-temperature calcination to obtain smaller particles.17,18 Therefore, how to reduce the average size of nano-BaTiO3 particles by hydrothermal synthesis under mild conditions is an active area of research.
Furthermore, the properties of nanomaterials are not only dependent on their size, but the influence of the microscopic morphology is also crucial, which has led to substantial interest in preparing barium titanate in various morphologies and sizes. Ma et al.19 used oleic acid and tert-butylamine as additives to synthesize BaTiO3 nanocubes, with a smooth surface and an average size of 25 nm, by the hydrothermal method. Inada et al.20 obtained tetragonal-phase barium titanate nanorods using BaCl2 and TiCl4 as raw materials, and ethylene glycol as the solvent by the hydro/solvothermal method. Their mechanistic analysis suggests that ethylene glycol played an important role in the nucleation and anisotropic growth of tetragonal barium titanate. Li et al.21 prepared a nano-BaTiO3 supercage structure—without organic additives—that exhibited excellent microwave absorption. Zhu et al.22 used a simple method to prepare cubic-phase BaTiO3 nanotubes with an average diameter of 10 nm and a wall thickness of 3 nm. The material exhibited excellent high-frequency absorption and is a promising microwave-absorbing material. Surmenev et al.23 prepared one-dimensional, nano/micron-sized, rod-shaped BaTiO3 by the hydrothermal method and found that BaTiO3 with various morphologies, sizes, and phase compositions could be prepared by adjusting the temperature, time, and alkalinity of the hydrothermal process.
Ionic liquids have many unique properties—such as wide electrochemical windows, low surface tension, and high thermal stability.26,27 In recent years, the advantages of ionic liquids in synthesizing inorganic nanomaterials have been gradually discovered and there are an increasing number of applications.24,25 Ionic liquids can act as reactants, solvents, and templates in preparing inorganic nanomaterials.29,30 The low surface tension of ionic liquids can lead to high nucleation rates and Ostwald ripening, and ultimately to small particles. Ionic liquids can also interact with the particle surface and thus play an important role in particle growth.28 Zhou et al.31 used the ionic liquid [Bmim]BF4 as an additive and prepared TiO2 nanocrystals with an average size of only 2–3 nm under mild conditions. Cao et al.32 synthesized ultrafine amorphous metal hydroxide nanoparticles for efficient oxygen evolution by a one-step method with 1-aminopropyl-3-methylimidazolium tetrafluoroborate, resulting in particle sizes of 2–3 nm. Paszkiewicz et al.33 prepared TiO2 microspheres with ionic liquids as additives. The effect of the cation chain length of imidazole-based ionic liquids on the resulting TiO2 morphology and photoactivity were systematically studied; both the electrostatic stability and coordination of imidazole cations facilitated growth of TiO2 spheres. Kim et al.34 prepared Ag nanostructures with various morphologies—including nanowires—with 1-butyl-3-methylimidazole-based ionic liquids as additives, and concluded that forming these morphologies was related to the stabilizing effect as well as self-organization of the ionic liquids.
As mentioned previously, ionic liquids play an important role in preparing inorganic nanomaterials. However, preparing BaTiO3 with ionic liquids has not been reported to date. In the present paper, the 1-(propyl-3-methoxysilyl)-3-methylimidazole chloride ([Tmospmim]Cl) was used as an additive, and anatase TiO2 as well as Ba(OH)2·8H2O were used as raw materials to prepare nano-BaTiO3 by the hydrothermal method. The effects of the quantity of ionic liquid on the size, morphology, and tetragonal-phase content of BaTiO3 were investigated; and the dielectric properties of BaTiO3 were measured. In addition, hollow, bowl-shaped nano-BaTiO3 with a small size and excellent dielectric properties was also prepared with polyvinylpyrrolidone (PVP) instead of an ionic liquid.
2. Experimental
2.1 Materials and reagents
Ba(OH)2·8H2O, TiO2, Polyvinylpyrrolidone (PVP) and ammonia (NH3·H2O) were of analytical grade and used without further purification. 1-(Propyl-3-methoxysilyl)-3-methylimidazole chloride ([Tmospmim]Cl, 99%) was purchased from Shanghai Chengjie Chemical Co., Ltd Formic acid anhydrous (HCOOH, 98%) was purchased from Tianjin Comio Chemical Reagent Co., Ltd.2.2 Hydrothermal synthesis of BaTiO3
Hydrothermal synthesis of BaTiO3 was conducted in a 100 mL PTFE-lined crystallization kettle. Firstly, Ba(OH)2·8H2O (14.2 g, 45 mmol), TiO2 (1.4 g, 18 mmol), deionized water (30 mL) and [Tmospmim]Cl (1.0 g, 3.0 g or 5.0 g) were added to the kettle in turn and stirred well. Then, NH3·H2O (14 mL, 25%) was added to adjust the alkalinity of the system. The hydrothermal process was conducted at 200 °C for 48 h. When the reaction was finished, the crystallization kettle was cooled to room temperature and the solid was separated from the liquid. Afterwards, it was repeatedly washed with formic acid (1 mol L−1) and water until the filtrate was neutral. The resulting solid was dried at 80 °C to a constant weight and designated as BaTiO3-IL-X (X = 1, 3, or 5).The preparation process without the addition of ionic liquid was the same as the above steps, and the resulting product was noted as BaTiO3-N.
Urchin-like nano-BaTiO3: Ba(OH)2·8H2O (4.7 g, 15 mmol), deionized water (30 mL), TiO2 (0.48 g, 6 mmol) and [Tmospmim]Cl (5.0 g) were added to a 100 mL PTFE-lined crystallization kettle and stirred well. Then, NH3·H2O (25%, 14 mL) was added to adjust the alkalinity. The next reaction procedure was the same as BaTiO3-IL. The prepared urchin-like nano-BaTiO3 was denoted as BaTiO3-U.
Hollow bowl-shaped of nano-BaTiO3: the preparation process was similar to BaTiO3-IL, except that polyvinylpyrrolidone (5.0 g, PVP) was used instead of ionic liquid and the resulting hollow bowl-shaped nano-BaTiO3 was noted as BaTiO3-B.
2.3 Characterization
X-ray diffraction (XRD) of samples were collected with a Bruker D8 Discover X-ray diffractometer using a graphite monochrome filter and Cu Kα radiation. The tube voltage and the tube current were set at 40 kV and 40 mA, respectively. The samples were scanned in the 2θ range of 15–90°, scanning speed of 6° min−1.Transmission electron microscope (TEM) from FEI Talos F200S with a voltage of 200 kV and a resolution of 0.12 nm was used to observe the morphology and size of BaTiO3 particles.
Scanning electron microscopy (SEM) from the FEI Nova Nano S450 was used to observe the morphology and particle size of the samples by collecting signals from secondary electrons and backscattered electrons for microscopic morphology analysis.
A LabRAM HR Evolution laser Raman spectrometer from HORIBA Jobin Yvon was used to perform the samples with a 532 nm Nd: YAG laser. The spectral range was 100–1000 cm−1, and the spectral resolution was less than 1 cm−1.
Bulk density was measured via Archimede's method.
2.4 Electrical performance test
A high frequency dielectric spectrometer, Agilent E4991A, was used to test the dielectric constants and dielectric losses of the ceramic samples at different temperatures at 1000 Hz and a DC voltage of 1 V. The dielectric constants of the BaTiO3 ceramics were calculated according to eqn (1).| ε = C·h/ε0S | (1) |
The dielectric properties of nano-BaTiO3 with different grain sizes were tested. Paraffin wax of 7% was mixed with 0.8 g nano-BaTiO3 powder, and the wax was fried on a microwave induction oven to make the wax uniformly dispersed in the BaTiO3 powder. The powder was passed through an 80 mesh sieve, sieved, and then pressed into shape under a pressure of 4 MPa to obtain raw flakes.
The raw BaTiO3 ceramic flakes obtained after pressing were placed in a high-temperature sintering furnace for sintering. The sintering procedure is set at room temperature to 550 °C with a heating rate of 2.5 °C min−1. After 550 °C, the binder is removed from the billets by holding them for 1 h. Afterwards, the temperature is rapidly increased to 1250 °C (8 °C min−1) and held for 4 h. After the sintering is completed, the temperature is cooled down (3 °C min−1) to room temperature. Finally, the BaTiO3 ceramic sheets were coated with silver paste on both sides and tested for their dielectric properties after silver firing.
3. Results and discussion
3.1 Preparation of BaTiO3 with various particle sizes
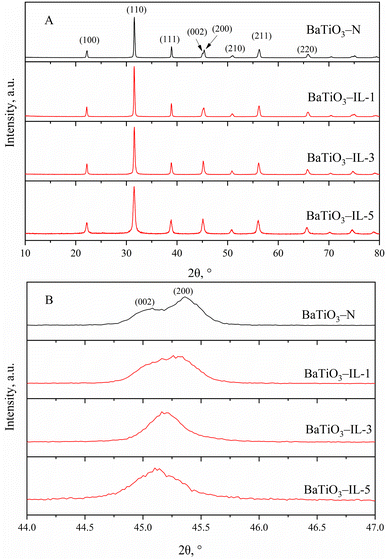
BaTiO3 nanoparticles were prepared by the hydrothermal method with the ionic liquid [Tmospmim]Cl as an additive, and the effect of the quantity of ionic liquid was investigated. The obtained BaTiO3 was characterized (Fig. 1–3).Fig. 1 shows the XRD patterns of the BaTiO3 samples. Based on the XRD pattern of BaTiO3-N in Fig. 1A, diffraction peaks with 2θ of 22.26°, 31.56°, 38.91°, 45.08°, 45.38°, 51.08°, 56.25°, and 65.78° were evident; corresponding to the (100), (110), (111), (002), (200), (210), (211) and (220) crystal planes, respectively.35 In particular, the diffraction peak near 45° was split into two peaks (Fig. 1B), which indicates that the prepared BaTiO3-N was in the tetragonal phase (JCPDS NO. 05-0626).36,47 The calculated axial ratio c/a was 1.0086, which indicates that the content of tetragonal-phase BaTiO3 was approximately 95%.37 The XRD pattern of BaTiO3-IL was similar to that of BaTiO3-N after adding the ionic liquid [Tmospmim]Cl. However, the split two peaks at 45° gradually merged into a single peak with increasing ionic liquid dosage, indicating that the ionic liquid facilitated formation of the cubic-phase BaTiO3 (JCPDS NO. 31-0174).38
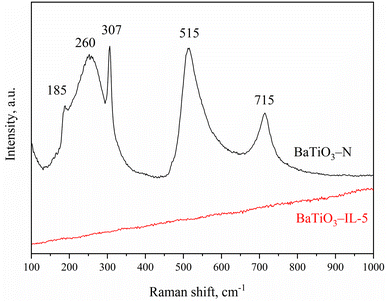
Fig. 2 shows the Raman spectra of BaTiO3-N and BaTiO3-IL-5. The Raman peaks of tetragonal BaTiO3 were evident at 185, 260, 307, 515, and 715 cm−1 in the spectrum of BaTiO3-N. In contrast, the Raman spectrum of BaTiO3-IL-5 exhibited no peaks, indicating that it exhibited no Raman activity and was all cubic-phase BaTiO3, which is consistent with the XRD results. Adding an ionic liquid facilitated formation of cubic-phase BaTiO3.
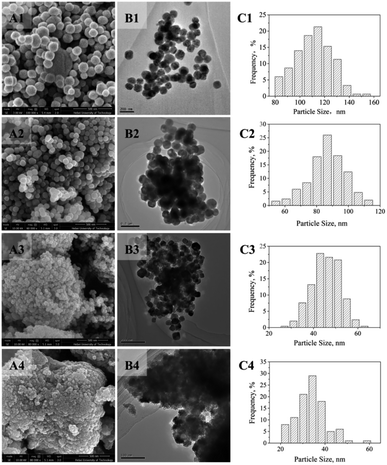
Fig. 3 shows SEM and TEM images of BaTiO3 samples, as well as the particle size distributions. As evident from Fig. 3A1 and B1, the BaTiO3-N particles were nearly spherical with uniform size and good dispersion. The diameter of the BaTiO3-N particles was 129 nm. The BaTiO3-IL-1 particles prepared with an ionic liquid were smaller: 86 nm (Fig. 3A2, B2, C2). With increasing quantity of ionic liquid, the particle size of BaTiO3-IL-3 decreased substantially to only 46 nm. However, the dispersion deteriorated with obvious agglomeration. The average particle size of BaTiO3-IL-5 was 34 nm and agglomeration of the particles was substantial. Adding an ionic liquid reduced the surface tension of the system and increased the nucleation rate of BaTiO3, resulting in smaller particles.28,39 In addition, the viscosity of the reaction system increases with increasing quantity of ionic liquid,40 which is not conducive to growth of BaTiO3 microcrystals and thus also led to a gradual decrease in the particle size.
The dielectric properties of the aforementioned BaTiO3 samples were evaluated at 1000 Hz after processing into ceramics; Fig. 4 shows the dielectric temperature curves. The dielectric constant of BaTiO3-N with 95% tetragonal phase was ca. 2500 at room temperature and 8100 at the Curie temperature, and the dielectric loss was very small over the entire temperature range. With the addition of ionic liquid and the increase in the amount of ionic liquid, the dielectric constant of BaTiO3-IL samples gradually decreased. The dielectric peak at Curie temperature gradually decreased and broadened, and the phenomenon of dielectric dispersion appeared, among which the dielectric loss of BaTiO3-IL-1 and BaTiO3-IL-3 did not change significantly compared with BaTiO3-N samples. The dielectric constants of BaTiO3-IL-1 and BaTiO3-IL-3 at room temperature were 1900 and 1300, respectively, and at the Curie temperature were 4000 and 2000, respectively. When the amount of ionic liquid was increased to 5 g, the dielectric constant of BaTiO3-IL-5 ceramic sample was very low, only about 40, and remained unchanged with the change of temperature. Its dielectric loss increases significantly. In accordance with these characterization results, the dielectric constant of BaTiO3 ceramics increased with increasing tetragonal-phase content.
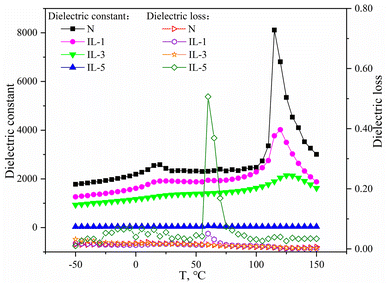 | ||
| Fig. 4 Effect of ILs loadings on dielectric constant and dielectric loss of BaTiO3 ceramics at different temperature. | ||
The densities of BaTiO3-N and BaTiO3-IL-5 ceramic samples were determined by Archimedes' method, which were 5.78 and 4.9 g cm−3, respectively. According to the theoretical density of pure BaTiO3 ceramics (6.08 g cm−3), the relative densities of the two are calculated to be 95.1% and 80.6%, respectively. The low relative density of BaTiO3-IL-5 ceramic sample is due to the use of a large amount of ionic liquid in the preparation process. Due to the decomposition of ionic liquid in the roasting process, the BaTiO3-IL-5 ceramic sample is relatively loose. This is also one of the reasons for its poor dielectric properties. Similar results were obtained by Ashokkumar et al.52 They prepared nano-sized BaTiO3 with citric acid by hydrothermal method. The average grain size of BaTiO3 ranges from 10–28 nm, and its dielectric constant is less than 50 when T < 200 °C, which increases with the increase of temperature.
Furthermore, the dielectric constants of the BaTiO3 ceramics were also influenced by the particle size. BaTiO3-IL-3 and BaTiO3-IL-5 were both in the cubic phase, but the former exhibited a much larger dielectric constant than the latter because the particle size of BaTiO3-IL-5 was only 34 nm. In accordance with Ruan et al.,41 with decreasing grain size of BaTiO3, the volume of the surface layer increased, resulting in incomplete crystallization and thus a smaller dielectric constant. In addition, there is a critical size of BaTiO3. Upon reducing the grain size to a certain value, BaTiO3 changes from tetragonal phase to cubic phase. Mandal et al.37 suggested that the tetragonal phase content of nano-BaTiO3 is negatively correlated with the grain size. Li et al.42 reported that the critical size of BaTiO3 was 56 nm, and the tetragonal phase was evident only when the grain size was >56 nm. Uchino et al.43 obtained the critical size of BaTiO3 to be ca. 44 nm by theoretical calculations. In the present study, the critical size could not be determined precisely because the grain size of the nano-BaTiO3 was not continuous, but the results indicate that BaTiO3 with a grain size of <46 nm was cubic phase.
3.2 Preparation of BaTiO3 with various morphologies
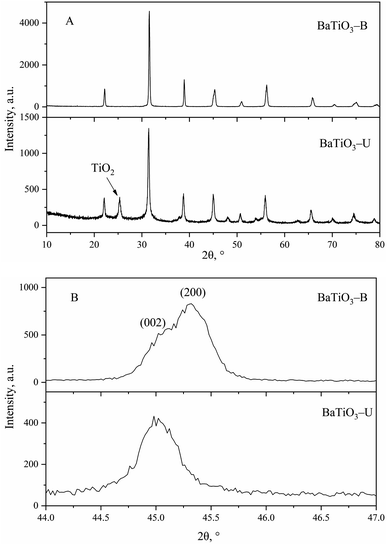
BaTiO3-U was prepared by the hydrothermal method with [Tmospmim]Cl as an additive, and BaTiO3-B was prepared with PVP as a morphology control agent. Both were characterized (Fig. 5 and 6).Based on the XRD pattern of BaTiO3-B (Fig. 5), there was a split peak near 45°, indicating that it contained tetragonal phase. The axial rate c/a was 1.0081 and the tetragonal-phase content was ca. 90%. In contrast, the XRD pattern of BaTiO3-U exhibited a single peak near 45°, indicating a cubic-phase structure. In addition, a diffraction peak of TiO2 was evident in the XRD pattern of BaTiO3-U,48 which is the result of an incomplete hydrothermal process, indicating that adding PVP was not conducive to the reaction between TiO2 and Ba(OH)2.
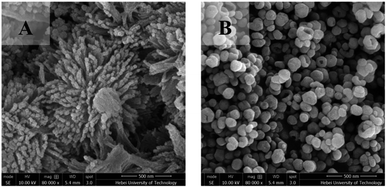
Fig. 6A shows an SEM image of BaTiO3-U. BaTiO3-U exhibited a three-dimensional structure; which was a sea urchin-like structure consisting of small, one-dimensional, rod-like grains. The crystal plane energies of (100), (110), and (111) of BaTiO3 are different, among which the crystal plane energy of (111) is the largest and the growth rate in this direction is also the fastest.44 When there was no ionic liquid in the system, the morphology of the product was approximately spherical. Adding an ionic liquid to the solution can inhibit irregular growth of the particles by chelation with one of the crystal surfaces, and control the morphology as well as size of the product. In the present study, the quantity of ionic liquid used for preparing BaTiO3-U was much larger than that for preparing BaTiO3-IL, and its effect was more obvious. During formation of BaTiO3, the ionic liquid adsorbs onto the (100) and (110) crystal planes through chelation, which reduces the crystal energy and decreased the growth rate, thus facilitating growth of BaTiO3-U along the (111) crystal plane direction and formation of a one-dimensional rod structure. Moreover, the alkyl chains of ionic liquids can assemble and form micelles in water, and the resulting rod-like BaTiO3 aggregates onto the surface of IL micelles in a manner that forms a sea urchin-like, three-dimensional structure.
Fig. 6B shows an SEM image of BaTiO3-B. These particles were hollow and bowl-shaped, with an average size of 92 nm. Formation of hollow particles is usually based on the Ostwald ripening mechanism or the Kirkendall effect.45,46 From a thermodynamic standpoint, during Ostwald maturation, larger particles are more stable than smaller particles, the latter of which exhibit a higher solubility and the ions that result from dissolution crystallize onto the surface of the larger particles, which further enlarges the particles. During diffusion of the ions, the smaller pores gradually increase and eventually form a hollow structure. The Kirkendall effect arises from the difference in ion diffusion rates at the interface. In a manner that compensates for the difference in diffusion rates during the internal diffusion of metal ions, there is vacancy diffusion, and the limited particle size and structural constraints lead to supersaturation of lattice vacancies, which initiates a concentration of over-generated interstitial spaces and eventually formation of hollow structures within the particles.
The effect of the BaTiO3 morphology on the dielectric constant and loss was investigated; Fig. 7 shows the dielectric temperature curves. The room-temperature dielectric constant of BaTiO3-B ceramics was 3000 and the dielectric constant at the Curie-temperature was 6700.
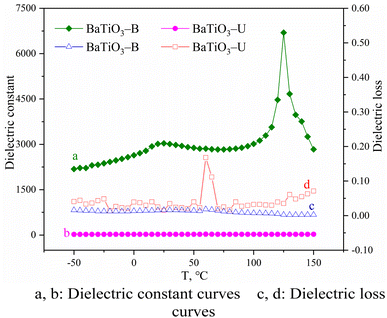 | ||
| Fig. 7 Temperature-dependence of the dielectric constant and dielectric loss of BaTiO3 ceramics with different morphologies. | ||
The density of the BaTiO3-B ceramic sample was 5.36 g cm−3 and the relative density was calculated to be 88.2%. Compared with BaTiO3-N, which exhibited a large dielectric constant as previously mentioned, BaTiO3-B exhibited a relatively large room-temperature dielectric constant and a small Curie-temperature dielectric constant. Moreover, the dielectric loss of BaTiO3-B ceramics was very small, similar to that of BaTiO3-N. However, the dielectric constant of BaTiO3-U ceramics was only about 25 and almost not changes with temperature, and the dielectric loss was significantly greater than that of BaTiO3-B ceramics. As previously mentioned, the magnitude of the dielectric constant of BaTiO3 is related to the quantity of tetragonal-phase content in the particle; BaTiO3 with a high tetragonal-phase content exhibited a stronger electric field response. Based on the characterization results, BaTiO3-U formed by agglomeration of small grains of cubic BaTiO3, which exhibits no ferroelectricity; thus, its dielectric constant was low with large dielectric loss. In contrast, the content of the tetragonal phase in BaTiO3-B was ca. 90%; thus, it exhibited a large dielectric constant and a small dielectric loss.
Table 1 lists some literature related to the preparation of BaTiO3 in recent years, and compares them with the results of this work, including preparation methods, raw materials, particle size of the product, dielectric constant, etc. Compared with the existing research, this study is that the ionic liquid was added as a template in the hydrothermal synthesis of BaTiO3, and the smaller size nanoparticles were prepared, with higher dielectric constant and lower dielectric loss. In addition, various morphologies of barium titanate were also prepared by adding ionic liquids or PVP, and its dielectric constant and other properties were investigated.
| Entry | Ti source | Ba source | Preparation method | Dpa (nm) | Dielectric constant | Ref. |
|---|---|---|---|---|---|---|
| a Particle size. | ||||||
| 1 | TiO2 | Ba(OH)2·8H2O | Hydrothermal | 129 | 8100 (1 kHz) | This work |
| 2 | TiO2 | Ba(OH)2·8H2O | Hydrothermal | 86–34 | 4000–40 (1 kHz) | This work |
| 3 | TiO2 | Ba(OH)2 | Cold sintering | 122 | 2332 (1 kHz) | 49 |
| 4 | TiCl4 | BaCl2·2H2O | Hydrothermal | 10–40 | 1106 (10 Hz) | 50 |
| 5 | Ti(OC4H9)4 | Ba(NO3)2 | Oxalate co-precipitation assisted with microwave | 30–50 | 7823.5 (1 kHz) | 51 |
| 6 | Ti(i-OPr)4 | BaCl2 | Hydrothermal | 10–28 | <50 (50 Hz–5 MHz) | 52 |
| 7 | TiO2 | BaCO3 | Two-step calcination | 156 | ∼12![[thin space (1/6-em)]](https://www.rsc.org/images/entities/char_2009.gif) 800 (1 kHz) 800 (1 kHz) |
53 |
| 8 | Ti[OCH(CH3)2]4 | BaCl2 | Sol–gel | 120–280 | >120 | 54 |
| 9 | TiO2 | Ba(COOH)2 | Sol–gel | 287 | 117 (10 kHz, 25 °C) | 55 |
| 10 | TiO2 | BaCO3 | High energy ball milling | Submicron | 2180 (20 Hz, Tc) | 56 |
4. Conclusions
BaTiO3 nanoparticles were prepared by the hydrothermal method with Ba(OH)2·8H2O and anatase TiO2 as raw materials, and the ionic liquid of 1-(propyl-3-methoxysilyl)-3-methylimidazole chloride ([Tmospmim]Cl) as an additive. BaTiO3-N nanoparticles prepared without an ionic liquid were spherical, with an average particle size of 129 nm, and the tetragonal content was ca. 95%. After adding the ionic liquid, the size of the BaTiO3-IL decreased and the content of the tetragonal phase gradually decreased until all of the particles changed into the cubic phase. The dielectric property test results indicate that the dielectric constant of BaTiO3-N ceramics was the highest, decreased with decreasing BaTiO3 particle size, and the tetragonal-phase content decreased. Cubic-phase BaTiO3 particles with a sea urchin morphology were prepared by changing the reaction conditions and the dielectric constant was low. In addition, bowl-shaped BaTiO3-B particles with an average size of 92 nm and a tetragonal-phase content of 90% were prepared with PVP instead of an ionic liquid. The dielectric constant of the prepared ceramics was 3000 at room temperature and 6700 at the Curie temperature.Author contributions
Xinxiao Wu: data curation, formal analysis, writing-original draft. Weining Han: data curation, formal analysis. Hepan Zhao: writing review & editing. Zhimiao Wang: writing review, editing. Fang Li: conceptualization, methodology, visualization. Jing Li: supervision, funding acquisition. Wei Xue: supervision, conceptualization, methodology, writing-review & editing.Conflicts of interest
The authors declare that they have no known competing financial interests or personal relationships that could have appeared to influence the work reported in this paper.Acknowledgements
This work was supported by the National Natural Science Foundation of China (No. U21A20306, U20A20152), and Natural Science Foundation of Hebei Province (B2022202077). We thank Michael Scott Long, PhD, from Liwen Bianji (Edanz) (http://www.liwenbianji.cn) for editing the English text of a draft of this manuscript.Notes and references
- H. Qi, L. Fang, W. Xie, H. Zhou, Y. Wang and C. Peng, J. Mater. Sci.: Mater. Electron., 2015, 26, 8555–8562 CrossRef CAS.
- S. Y. Jun, S. H. Park, N. W. Baek, T. Y. Lee, S. Yoo, D. Jung and J. Y. Kim, RSC Adv., 2022, 12, 16412–16418 RSC.
- H. Meng, Z. Chen, Z. Lu, X. Wang and X. Fu, Process. Appl. Ceram., 2021, 15, 179–183 CrossRef CAS.
- F. He, W. Ren, G. Liang, P. Shi, X. Wu and X. Chen, Ceram. Int., 2013, 39, S481–S485 CrossRef CAS.
- P. R. Bhunia, S. Gupta, A. Garg and R. K. Gupta, J. Polym. Sci., 2022, 60, 961–967 CrossRef.
- G. L. Brennecka, J. F. Ihlefeld, J. P. Maria, B. A. Tuttle and P. G. Clem, Int. J. Appl. Ceram. Technol., 2010, 93, 3935–3954 CAS.
- K. G. Baiju, A. Nagarajan, A. Sadasivam, D. Rajan and D. Kumaresan, Asia-Pac. J. Chem. Eng., 2020, 15, e2550 CAS.
- D. H. Yoon and B. I. Lee, J. Eur. Ceram. Soc., 2004, 24, 739–752 CrossRef CAS.
- N. Sareecha, W. A. Shah, M. Anis-Ur-Rehman, M. L. Mirza and M. S. Awan, Solid State Ionics, 2017, 303, 16–23 CrossRef CAS.
- C. Baek, J. E. Wang, S. Moon, C. H. Choi and D. K. Kim, J. Am. Ceram. Soc., 2016, 99, 3802–3808 CrossRef CAS.
- B. B. Jiang, J. Iocozzia, L. Zhao, H. F. Zhang, Y. W. Harn, Y. H. Chen and Z. Q. Lin, Chem. Soc. Rev., 2019, 48, 1194–1228 RSC.
- L. R. Prado, N. S. D. Resende, R. S. Silva, S. M. S. Egues and G. R. Salazar-Banda, Chem. Eng. Process., 2016, 103, 12–20 CrossRef CAS.
- F. He, Appl. Chem. Ind., 2010, 39, 1754–1757 CAS.
- M. Vijatović, J. Bobić and B. Stojanoić, History and challenges of barium titanate: Part I, Sci. Sintering, 2008, 40, 155–165 CrossRef.
- M. Vijatović, J. Bobić and B. Stojanoić, Sci. Sintering, 2008, 40, 235–244 CrossRef.
- N. J. Joshi, G. S. Grewal, V. Shrinet, A. Pratap and N. J. Buch, Integr. Ferroelectr., 2010, 115, 142–148 CrossRef CAS.
- H. Chen and Y. Chen, Ind. Eng. Chem. Res., 2003, 42, 473–483 CrossRef CAS.
- C. Liu, Y. Liu, C. An, H. Wang and X. Zhou, Wujiyan Gongye, 2012, 44, 16–18 CAS.
- Q. Ma, K. Mimura and K. Kato, J. Alloys Compd., 2016, 655, 71–78 CrossRef CAS.
- M. Inada, N. Enomoto, K. Hayashi, J. Hojo and S. Komarneni, Ceram. Int., 2015, 41, 5581–5587 CrossRef CAS.
- J. Li, S. Hietala and X. Tian, ACS Nano, 2015, 9, 496–502 CrossRef CAS PubMed.
- Y. Zhu, L. Zhang, T. Natsuki, Y. Fu and Q. Ni, ACS Appl. Mater. Interfaces, 2012, 4, 2101–2106 CrossRef CAS.
- R. A. Surmenev, R. V. Chernozem, A. G. Skirtach, A. S. Bekareva, L. A. Leonova, S. Mathur, Y. F. Ivanov and M. A. Surmeneva, Ceram. Int., 2021, 47, 8904–8914 CrossRef CAS.
- Y. Marfavi, R. Aliakbari, E. Kowsari, B. Sadeghi and S. Ramakrishna, in Ionic Liquid-Based Technologies for Environmental Sustainability, Elsevier, Amsterdam, The Netherlands, 2022, pp. 155–166 Search PubMed.
- J. Xia, Y. Ge, J. Di, L. Xu, S. Yin, Z. Chen, P. Liu and H. Li, J. Colloid Interface Sci., 2016, 473, 112–119 CrossRef CAS PubMed.
- C. Cruz and A. Ciach, Molecules, 2021, 26, 3668 CrossRef CAS PubMed.
- Z. Chen, H. Ma, J. Xia, J. Zeng, J. Di, S. Yin, L. Xu and H. Li, Ceram. Int., 2016, 42, 8997–9003 CrossRef CAS.
- K. A. Prokop, M. Guzik, Y. Guyot, G. Boulon, M. Wilk-Kozubek, M. Sobczyk, A. V. Mudring and J. Cybińska, Mater. Sci. Eng., B, 2022, 275, 115503 CrossRef CAS.
- J. Łuczak, M. Paszkiewicz, A. Krukowska, A. Malankowska and A. Zaleska-Medynska, Adv. Colloid Interface Sci., 2016, 227, 1–52 CrossRef PubMed.
- X. Liu, J. Ma and W. Zheng, Rev. Adv. Mater. Sci., 2011, 27, 43–51 CAS.
- Y. Zhou and M. Antonietti, J. Am. Ceram. Soc., 2003, 125, 14960–14961 CrossRef CAS PubMed.
- Y. Cao, S. Guo, C. Yu, J. Zhang and G. Li, J. Mater. Chem. A, 2020, 8, 15767–15773 RSC.
- M. Paszkiewicz, J. Luczak, W. Lisowski, P. Patyk and A. Zaleska-Medynska, Appl. Catal., B, 2016, 184, 223–237 CrossRef CAS.
- T. Kim, W. Kim, S. Hong, J. Kim and K. Suh, Angew. Chem. Int. Ed., 2009, 48, 3806–3809 CrossRef CAS PubMed.
- Z. Z. Lazarević, N. Romčević, M. Vijatović, N. Paunović, M. Romčević, B. Stojanović and Z. Dohcević-Mitrović, Acta Phys. Pol. A, 2009, 115, 808–810 CrossRef.
- Y. Xie, Y. Shu, T. Hashimoto, Y. Tokano, A. Sasaki and T. Sato, J. Eur. Ceram. Soc., 2010, 30, 699–704 CrossRef CAS.
- T. K. Mandal, Mater. Lett., 2007, 61, 850–854 CrossRef CAS.
- S. R. K. Patel, P. Kumar, C. Prakash and D. K. Agrawal, Ceram. Int., 2012, 38, 1585–1589 CrossRef.
- X. Duan, J. Ma, J. Lian and W. Zheng, CrystEngComm, 2014, 16, 2550–2559 RSC.
- Y. Ding, Y. Cao, Y. Guo, T. Sun, Y. Sun, Q. Ye, J. Li and C. Peng, J. Chem. Eng. Data, 2022, 67, 1350–1357 CrossRef CAS.
- S. P. Ruan, W. Dong, F. Q. Wu, Y. W. Wang, Y. Tu and Z. H. Peng, J. Phys. Chem., 2003, 42, 17–20 Search PubMed.
- X. Li and W. H. Shih, J. Am. Ceram. Soc., 1997, 80, 2844–2852 CrossRef CAS.
- K. Uchino, E. Sadanaga and T. Hirose, J. Am. Ceram. Soc., 1989, 72, 1555–1558 CrossRef CAS.
- S. Adireddy, C. Lin, B. Cao, W. Zhou and G. Caruntu, Chem. Mater., 2010, 22, 1946–1948 CrossRef CAS.
- J. S. Cho, J. S. Park and Y. C. Kang, Nano Res., 2017, 10, 897–907 CrossRef CAS.
- Y. Liu, Q. Li, S. Gao and J. K. Shang, J. Am. Ceram. Soc., 2013, 96, 1421–1427 CrossRef CAS.
- P. Yu, W. Liu, P. Gao, T. Shao, S. Zhao, Z. Han, X. Gu, J. Zhang and Y. Wang, J. Mater. Sci.: Mater. Electron., 2022, 33, 10828–10840 CrossRef CAS.
- E. Song, H. K. Dong, E. J. Jeong, M. Choi, Y. Kim, H. J. Jung and M. Y. Choi, Environ. Res., 2021, 202, 111668 CrossRef CAS PubMed.
- J. P. Ma, X. M. Chen, W. Q. Ouyang, J. Wang, H. li and J. L. Fang, Ceram. Int., 2018, 44, 4436–4441 CrossRef CAS.
- K. G. Baiju, A. Nagarajan, A. M. G. Sadasivam, D. D. S. Rajan and D. Kumaresan, Asia-Pac. J. Chem. Eng., 2020, 15, e2550 CAS.
- Q. Zhang, J. Chen and M. C. Che, Ferroelectrics, 2020, 566, 30–41 CrossRef CAS.
- R. Ashokkumar, S. Gnanam, K. Senthil Kannan, M. Shanmugaprakash and S. Karthikeyan, AIP Conference Proceedings, AIP Publishing LLC, 2022, vol. 2446, p. 130006 Search PubMed.
- L. Zhang, J. Wen, Z. Zhang, J. Yang, H. Huang, Q. Hu, H. Zhuang and H. Yu, Physica. B., 2019, 560, 155–161 CrossRef CAS.
- W. Han, J. Kim and H. H. Park, J. Korean Ceram. Soc., 2020, 57, 213–219 CrossRef CAS.
- S. Islam, N. Khatun, M. S. Habib, S. F. U. Farhad, N. I. Tanvir, M. Aftab Ali Shaikh, S. Tabassum, D. Isiam, M. Sajjad Hossain and A. Siddika, Heliyon, 2022, 8, e10529 CrossRef CAS PubMed.
- N. K. Verma, S. K. S. Patel, D. Kumar, C. B. Singh and A. K. Singh, AIP Conference Proceedings, AIP Publishing LLC, 2018, vol. 1953, p. 050075 Search PubMed.
| This journal is © The Royal Society of Chemistry 2023 |

