DOI:
10.1039/D2RA08323J
(Paper)
RSC Adv., 2023,
13, 6108-6123
Adsorption of crystal violet on activated bamboo fiber powder from water: preparation, characterization, kinetics and isotherms
Received
30th December 2022
, Accepted 7th February 2023
First published on 20th February 2023
Abstract
Biomass-activated carbon has made a great contribution as an adsorbent in the field of dye wastewater treatment. In this study, the response surface method (RSM) based on the Box–Behnken design was used to optimize the preparation process. Bamboo fiber activated carbon (BAC) with a specific surface area of 2892 m2 g−1 and a pore volume of 1.80 cm3 g−1 was prepared. Various characterization methods (SEM, XPS, XRD, and Raman spectroscopy) were used to analyze the micro-structure of BAC. In the microscopic state, the BAC is fibrous and maintains the originally connected pores of the bamboo fiber. After high-temperature activation, the microcrystallinity of BAC decreases, and the degree of graphitization is low, indicating the presence of amorphous carbon. The adsorption capacity of BAC to crystal violet in simulated wastewater was evaluated via an adsorption experiment. Under the following conditions: the dosage of BAC was 0.04 g, the concentration was 600 mg L−1, the adsorption temperature and time were 25 °C and 30 min, respectively, and the as-prepared BAC had a 99.96% removal rate. The adsorption process conformed to the pseudo-second-order kinetic model and Langmuir adsorption isotherm model, indicating that the adsorption process of CV on BAC belonged to monomolecular layer adsorption. The adsorption process occurs spontaneously and is accompanied by heat release, and the maximum adsorption capacity of BAC within a given concentration range could reach 1353.09 mg g−1. SEM-EDS characterization before and after adsorption showed that ion exchange and the presence of oxygen-containing functional groups played an important role in promoting the adsorption process. The results show that BAC considerably affects CV removal, which has great application prospects.
1 Introduction
The dye industry is a traditional pillar industry in China, and its processed products are widely used in the textile industry, leather, coating food and cosmetics.1,2 However, in today's world, with the rapid development of the printing and dyeing textile industry, numerous refractory dyes were discharged into the water body. It was estimated that nearly 800![[thin space (1/6-em)]](https://www.rsc.org/images/entities/char_2009.gif) 000 tons of artificial dyes were produced every year, causing serious water pollution.3,4 Synthetic dyes from water can be eliminated using the membrane separation method, filtration, advanced oxidation method,5 coagulation and flocculation, and photocatalytic degradation.6 Laftani et al.7 used the sun-Fenton oxidation process to degrade Lichun red dye in water. The experimental results show that under the degradation conditions of Fe2+ concentration of 0.06 mM, H2O2 of 1 mM, and initial solution pH of 3, the sun-Fenton oxidation process takes only 10 minutes to degrade dye. The degradation rate was greater than 94.3%. This method is efficient, but it consumes a lot of energy, is expensive, easily causes secondary pollution, and is unsuitable for treating high-concentration dye wastewater. Wang et al.8 prepared a gallic acid-grafted chitosan/polysulfone composite nanofiltration membrane and used it for Congo red dye removal. The results showed that the nanofiltration membrane had a 97.2% rejection rate of Congo red dye, and the flux of the membrane reached 14.0 L h−1 m−2 bar−1. Membrane separation is efficient, but its life span is short. Aoudjit et al.9 prepared TiO2-chitosan microspheres (CTCS) for the degradation of tartar dye. The results showed that the degradation rate of tartar dye reached 99.37% in 180 min by synergistic action with CTCS under sunlight. Photocatalytic degradation is a new method, but in the process of degrading dyes, attention must be paid to the problem of transmittance if printing and dyeing wastewater color is deep or too much suspended matter in the water is not conducive to light transmission and affects the photocatalytic effect.10
000 tons of artificial dyes were produced every year, causing serious water pollution.3,4 Synthetic dyes from water can be eliminated using the membrane separation method, filtration, advanced oxidation method,5 coagulation and flocculation, and photocatalytic degradation.6 Laftani et al.7 used the sun-Fenton oxidation process to degrade Lichun red dye in water. The experimental results show that under the degradation conditions of Fe2+ concentration of 0.06 mM, H2O2 of 1 mM, and initial solution pH of 3, the sun-Fenton oxidation process takes only 10 minutes to degrade dye. The degradation rate was greater than 94.3%. This method is efficient, but it consumes a lot of energy, is expensive, easily causes secondary pollution, and is unsuitable for treating high-concentration dye wastewater. Wang et al.8 prepared a gallic acid-grafted chitosan/polysulfone composite nanofiltration membrane and used it for Congo red dye removal. The results showed that the nanofiltration membrane had a 97.2% rejection rate of Congo red dye, and the flux of the membrane reached 14.0 L h−1 m−2 bar−1. Membrane separation is efficient, but its life span is short. Aoudjit et al.9 prepared TiO2-chitosan microspheres (CTCS) for the degradation of tartar dye. The results showed that the degradation rate of tartar dye reached 99.37% in 180 min by synergistic action with CTCS under sunlight. Photocatalytic degradation is a new method, but in the process of degrading dyes, attention must be paid to the problem of transmittance if printing and dyeing wastewater color is deep or too much suspended matter in the water is not conducive to light transmission and affects the photocatalytic effect.10
The adsorption method has the advantages of low cost, small investment, easy operation and economic benefit, which are widely used in the removal of organic pollutants that are difficult to degrade. The adsorbent used to adsorb pollutants in water usually refers to its large surface area; porous adsorbent or material, activated carbon, bentonite, natural zeolite, silica gel and resin can be used as typical adsorbents to treat dyes in water.11,12 Maliheh et al.13 used the response surface optimization method to optimize the adsorption conditions of natural zeolite, and under the optimal adsorption conditions, the adsorption capacity of natural zeolite on crystal violet dye reached 177.75 mg g−1. Yu et al.14 prepared biochar by KOH activation and anaerobic pyrolysis with corn cob xylost residue as raw material, showing excellent adsorption performance for Congo red and methyl orange dye, and good recyclability when treating methylene blue solution, with 68.7% adsorption capacity still maintained after 6 cycles. Nowadays, the use of biomass-activated carbon to treat dye wastewater has become a promising and active research field.
In industrial production, crystal violet (CV) is a typical cationic triphenylmethane dye. Synthetic crystal violet has low biodegradability; if it comes in contact with the skin, it causes serious irritation to the skin and eyes, resulting in skin allergy and even cancer.15,16 Simultaneously, wastewater containing CV dye has a certain toxicity; not controlling its discharge will reduce the light transmittance of water, affect the normal growth of aquatic plants, and cause great damage to the water environment.17 Nowadays, domestic and foreign researchers with a variety of biomass as raw materials have developed a wide variety of biomass-activated carbon. To better resolve the water pollution crisis and protect the human home, research workers in the process of preparing biomass-activated carbon are in the direction of “high adsorption, high strength, and multi-functional” to prepare materials with a specific-controlled pore structure and function to support the achievement of green energy and zero pollution emission goals. In recent years, much attention has been paid to the search for high-quality biomass to prepare for the high adsorption properties of activated carbon. Bamboo fiber is made from the natural growth of bamboo and has a rich ultra-fine pore structure that exhibits strong adsorption potential. It adheres to the wear resistance and toughness of bamboo and has excellent mechanical properties, a loose porous structure, a hard texture, and a short growth period. The recycling of discarded bamboo fiber is not only conducive to the development of a circular economy and the protection of national energy security but also can achieve the sustainable development of social and environmental protection. Studies have shown that the specific surface area of ordinary bamboo charcoal is 2–3 times that of ordinary charcoal, and one of its most prominent applications is to prepare activated carbon that can be used as a multifunctional adsorbent.18
Therefore, bamboo fiber was selected as the precursor of activated carbon preparation in this study; bamboo fiber-activated carbon was prepared, the activated carbon activation process was optimized, and its adsorption performance on the CV was investigated to make the adsorption material achieve an excellent adsorption effect.
2 Experimental
2.1 Raw materials and reagents
The bamboo fibers used in this study are made of bamboo waste from a paper-making industry in Anhui province. Bamboo fibers fermented with CaO were soaked in water for several days, placed in an air-blast dryer, and then crushed with a grinder, followed by sieving using a 200-mesh sieve. Crystal violet (C25H30N3Cl; molecular weight 407.98) and potassium hydroxide (KOH, ≥85%) were procured from the Shenyang Chemical Reagent Factory (Shengyang, China). Absolute ethyl alcohol (CH3CH2OH) was purchased from Quanrui Reagent Co., LTD, Jinzhou, China.
2.2 Preparation of bamboo fiber-activated carbon
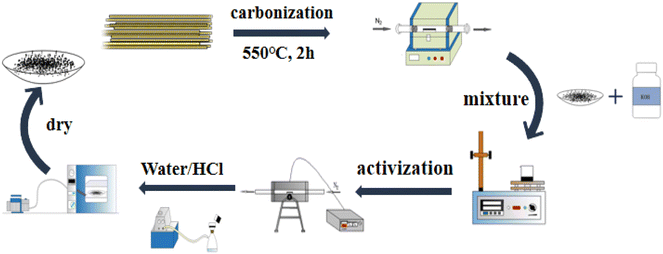
Bamboo fiber-activated carbon was prepared by employing the KOH activation method. First, bamboo fibers were placed in a tubular furnace and carbonized at 550 °C under N2 protection for two hours, and the carbonized product was named RC. Then, RC was activated, and the response surface optimization method was used to optimize the activation conditions to obtain bamboo fiber-activated carbon (BAC) with excellent adsorption performance. The synthetic process of bamboo fiber-activated carbon is shown in Fig. 1.
 |
| | Fig. 1 Flow chart of activated carbon preparation. | |
2.3 Design of the experiment
Experimental optimization studies were designed using the Box–Behnken method. Using the iodine adsorption value of bamboo fiber-activated carbon as the response value, process conditions, such as activation temperature, activation time, and alkali/carbon ratio, were investigated at three levels with a range of values shown in Table 1. Design-Expert 10.0.1 software was used to summarize and analyze the adsorption data, and the 3D response surface diagram and contour diagram were used to discuss the interaction between the three factors. Finally, the optimal preparation process parameters for bamboo fiber-activated carbon were obtained.
Table 1 Response surface factor level design
| Notation |
A: activation temperature/°C |
B: activation time/min |
C: alkali/carbon ratio |
| −1 |
800 |
30 |
4 |
| 0 |
850 |
45 |
5 |
| 1 |
900 |
60 |
6 |
The main effects and interactions of the variables were obtained by fitting eqn (1). ANOVA is performed on the second-order polynomial equation to judge the significance of the model. The model is deemed capable of predicting the process if the probability P value is less than 0.05:19,20
| |
 | (1) |
where
y refers to the predicted response value;
β0 is the offset term;
βi,
βij, and
βii refer to the linear effect, interaction effect, and squared effect, respectively;
21 and
xi and
xj are the levels of the independent variables.
According to the response surface experimental results, the bamboo fiber-activated carbon with the highest adsorption performance can be obtained, which is named BAC.
2.4 Characterizations of RC and BAC
The elemental analysis of bamboo fiber was tested using an elemental analyzer (Vario ELIII, Elmentar, Germany). The oxygen content was obtained by difference. For industrial analysis, the Industrial Analysis of Solid Biomass Fuel (GB/T 28731-2012) method was adopted. N2 adsorption/desorption isotherms at 77 K for BAC and RC were obtained using an automatic physical adsorption instrument. The specific surface area and microporous volume were based on the BET method and the t-plot model. The surface micro-structure was analyzed using scanning electron microscopy (PIGMA-HD, Germany). The crystal structure was tested using X-ray diffraction and Raman spectroscopy (LabRAM HR Evolution, JOBIN YVON, France). X-ray Photoelectron Spectroscopy (XPS, NY, USA) was applied to further analyze the element types and contents.
2.5 CV adsorption experiments
2.5.1 CV standard working curve drawing. Transfer 1 mL, 2 mL, 3 mL, 5 mL, 6 mL, 8 mL, 9 mL, 10 mL, 12 mL, 15 mL, 20 mL and 25 mL CV standard liquid into 12 50 mL stopper colorimetric tubes with a pipette, fill to 50 mL with deionized water and shake well. The CV standard solution under test was obtained with mass concentrations of 0.2 mg L−1, 0.4 mg L−1, 0.6 mg L−1, 1 mg L−1, 1.2 mg L−1, 1.6 mg L−1, 1.8 mg L−1, 2 mg L−1, 2.4 mg L−1, 3 mg L−1, 4 mg L−1 and 5 mg L−1, respectively. The wavelength of the UV-visible spectrophotometer preheated in advance was adjusted to 580 nm, and the absorbance of a series of standard CV solutions was measured with ultra-pure water as the reference. The average value of each concentration was measured three times, and the standard curve of the crystal violet concentration and absorbance was drawn.
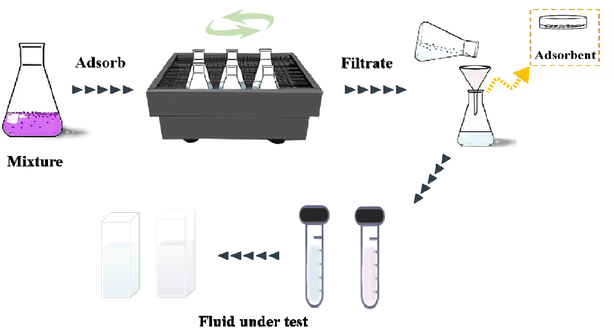
2.5.2 Batch adsorption experiments for CV. The absorption method is shown in Fig. 2. The effects of three factors that might influence the adsorption process were investigated, including the BAC dosage (0.01 g to 0.06 g), initial dye concentration (400 to 900 mg L−1), and contact time (2 to 40 min). The following formulas were used to calculate the BAC removal rate ω (%) and adsorption capacity qt (mg g−1) to evaluate the adsorption effect of BAC on CV:| |
 | (2) |
| |
 | (3) |
| |
 | (4) |
where ω (%) is the CV removal efficiency; qt and qe are the CV adsorption capacity (mg g−1) at any time t (min) and equilibrium, respectively; C0, Ct, and Ce are the initial CV concentration, the remaining CV concentration at any time t, and equilibrium CV concentration (mg L−1), respectively; V is the volume of aqueous solution (L); and m is the weight of the BAC used (g).
 |
| | Fig. 2 BAC adsorption crystal violet flow chart. | |
2.5.3 Adsorption kinetics. Adsorption kinetics were used to understand the mechanism of the adsorption process. The adsorption data were fitted by the pseudo-first order kinetic model (eqn (5)) and pseudo-second order kinetic model (eqn (6)).22 They can be expressed by the following equations:| |
 | (6) |
where t (min) refers to the time during the adsorption process and k1 and k2 refer to the adsorption rate constant of the two kinetic models.
2.5.4 Adsorption isotherm. The Langmuir and Freundlich adsorption isotherm models were used to deal with the adsorption data. The Langmuir model is suitable for monolayer adsorption theory, indicating that the adsorption sites on the surface of the adsorbent are uniform, and there is no mutual effect between the adsorbed particles.23,24 The nonlinear form of the Langmuir isotherm model (eqn (7)) can be defined as follows:| |
 | (7) |
where qm represents the saturated adsorption capacity per unit mass and b represents the Langmuir constant related to the adsorption energy.In the Langmuir equation, the dimensionless separation factor RL can be used to judge whether the adsorption reaction course is advantageous or not, which can be defined as follows:
| |
 | (8) |
If 0 < RL < 1, the adsorption course is advantageous adsorption; if RL = 1, it is linear adsorption; if RL = 0, it is nonreversible adsorption; if RL > 1, it is unfavorable adsorption.25,26
The Freundlich model is an empirical model, which indicates that the adsorption process is multi-molecular layer adsorption. The nonlinear form of the Freundlich isotherm model (eqn (9)) can be expressed as follows:
where
k is the Freundlich constant and
n is the Freundlich constant indicating adsorption intensity.
27
2.5.5 Evaluation of adsorption thermodynamics. The Gibbs equation and Van't Hoff isotherm were used to calculate the thermodynamic function of the reaction, and the Gibbs free energy change ΔG, enthalpy change ΔH and entropy change ΔS of BAC adsorption CV were obtained. The relevant calculation formula is as follows:| |
 | (10) |
| |
ΔG = −RT![[thin space (1/6-em)]](https://www.rsc.org/images/entities/char_2009.gif) ln ln![[thin space (1/6-em)]](https://www.rsc.org/images/entities/char_2009.gif) KC, KC,
| (11) |
| |
 | (13) |
where KC represents the thermodynamic equilibrium constant, Madsorbate represents the molar mass of the adsorbed material, Cadsorbate is the standard concentration of an adsorbed substance, γ represents the dimensionless activity coefficient, R is the gas constant, and the value is 8.314 J (mol−1 K−1).
3 Results and discussion
3.1 Proximate analysis and elemental analysis of bamboo fiber
As shown in Table 2, bamboo fiber is a good clean raw material with a carbon content of 49.24%, high C/H and O/H, N content of less than 1%, and no S detected. The industrial analysis results showed that the volatile content of bamboo fiber was as high as 84.93% and the ash content as low as 2.21%, indicating that bamboo fiber was suitable for pyrolysis transformation.
Table 2 Proximate analysis and elemental analysis of bamboo fiber
| Proximate analysis (wt%) |
Elemental analysis (wt%) |
| Vad |
FCad |
Aad |
Mad |
C |
H |
N |
O |
S |
| 84.93 |
11.69 |
2.21 |
1.17 |
49.24 |
6.66 |
0.42 |
43.69 |
— |
3.2 The basic properties of bamboo fiber
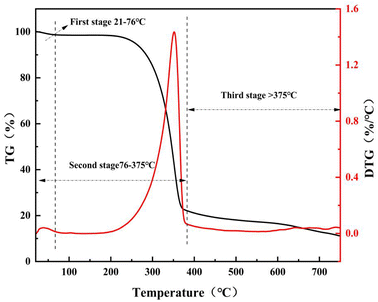
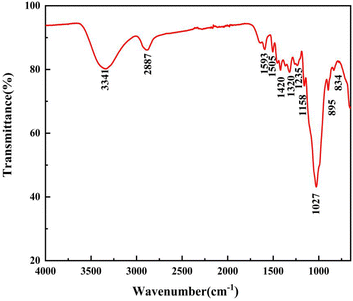
TGA and FTIR are usually used as general methods to characterize the basic properties (pyrolysis behavior and basic functional groups) of raw biomass materials. The pyrolysis behavior and functional groups of bamboo fiber are shown in Fig. 1 and 2, respectively.
As shown in Fig. 3, the pyrolysis process of bamboo fiber (RC) can be divided into three stages. The first stage ranged from 21 °C to 76 °C attributed to the desorption of the water molecules on the surface of RC. The second pyrolysis stage was from 76 °C to 375 °C, which was attributed to the pyrolytic nature of cellulose. A pyrolytic temperature higher than 375 °C was the third stage, which was caused by the carbonization of involved lignin and cellulose. When the pyrolytic temperature was higher than 550 °C, the weight loss of RC was complete. In other words, the calculated temperature of 550 °C is a suitable temperature to obtain bamboo fiber carbon (the raw materials to prepare bamboo fiber-based activated carbon).
 |
| | Fig. 3 Thermal weight loss curve of bamboo fiber powder. | |
As presented in Fig. 4, there were obvious absorption peaks in the range of 750 cm−1 to 3700 cm−1. The broad absorption peak at 3341 cm−1 was related to the hydroxyl (–OH) stretching vibration of alcohol and phenol molecules in bamboo fiber. The absorption peak at 2887 cm−1 was caused by the symmetric stretching vibration of methyl and methylene (–CH3 and –CH2). The characteristic absorption peak at 1593 cm−1 was attributed to the stretching vibration peak of lignin aromatic ring C![[double bond, length as m-dash]](https://www.rsc.org/images/entities/char_e001.gif) O. The absorption peaks at 1420 cm−1 and 1320 cm−1 correspond to the deformation vibration and bending vibration of aliphatic C–H on bamboo fiber polymers, respectively.
O. The absorption peaks at 1420 cm−1 and 1320 cm−1 correspond to the deformation vibration and bending vibration of aliphatic C–H on bamboo fiber polymers, respectively.
 |
| | Fig. 4 FTIR spectra of bamboo fiber powder. | |
3.3 Optimization studies
3.3.1 Experimental results and analysis of variance. The response surface experimental factor levels and results are shown in Table 3.
Table 3 The 3-factor design matrix and experimental results
| Serial number |
Temperature A |
Activation time B |
Alkali/carbon ratio C |
Iodine adsorption value/R (mg g−1) |
| 1 |
0 |
0 |
0 |
3754.32 |
| 2 |
1 |
0 |
−1 |
3571.94 |
| 3 |
−1 |
0 |
1 |
3405.51 |
| 4 |
0 |
0 |
0 |
3731.35 |
| 5 |
0 |
−1 |
1 |
3441.45 |
| 6 |
0 |
0 |
0 |
3679.46 |
| 7 |
0 |
0 |
0 |
3757.44 |
| 8 |
−1 |
1 |
0 |
3543.59 |
| 9 |
1 |
0 |
1 |
3303.38 |
| 10 |
0 |
1 |
−1 |
3531.31 |
| 11 |
0 |
0 |
0 |
3741.32 |
| 12 |
1 |
−1 |
0 |
3653.37 |
| 13 |
0 |
1 |
1 |
3458.59 |
| 14 |
0 |
−1 |
−1 |
3497.46 |
| 15 |
1 |
1 |
0 |
3607.36 |
| 16 |
−1 |
0 |
−1 |
3275.05 |
| 17 |
−1 |
−1 |
0 |
3376.87 |
The obtained data were statistically analyzed using Design-Expert 10.0.1 software. According to the experimental data, the final models are represented by the codes as follows:
| Y = 3732.78 + 66.8785A + 21.4625B − 33.3537C − 53.1837AB − 99.7535AC − 4.18015BC − 140.358A2 − 47.1241B2 − 203.451C2. |
The results of the ANOVA are given in Table 4. The F value can reflect the significance of the influence of the three variables on the iodine adsorption value.28 The larger the F value, the higher the significance of the corresponding variable. The high values of R2 (=0.9817) and Radj2 (=0.9581) indicate that the experimental model fits well with real data, which can provide theoretical and practical guidance for experimental optimization. A smaller lack of fit P (0.4490) value means that the specific model item contributes more to the response.29,30
Table 4 Response surface fitting regression equation variance analysis results
| Source |
SSa |
DFb |
Mean square |
F |
P value |
Significance |
| Annotation: sum of squares. Degree of freedom. |
| Model |
3.888 × 10⁵ |
9 |
43196.33 |
41.67 |
<0.0001 |
** |
| A – temperature |
35781.87 |
1 |
35781.87 |
34.52 |
0.0006 |
** |
| B – activation time |
3685.11 |
1 |
3685.11 |
3.56 |
0.1013 |
|
| C – alkali/carbon ratio |
8899.75 |
1 |
8899.75 |
8.59 |
0.0220 |
* |
| AB |
11314.03 |
1 |
11314.03 |
10.91 |
0.0131 |
* |
| AC |
39803.06 |
1 |
39803.06 |
38.40 |
0.0004 |
** |
| BC |
69.89 |
1 |
69.89 |
0.067 |
0.8026 |
|
| A2 |
82949.33 |
1 |
82949.33 |
80.02 |
<0.0001 |
** |
| B2 |
9350.24 |
1 |
9350.24 |
9.02 |
0.0198 |
* |
| C2 |
1.743 × 10⁵ |
1 |
1.743 × 10⁵ |
168.13 |
<0.0001 |
** |
| Residual |
7256.11 |
7 |
1036.59 |
|
|
|
| Lack of fit |
3265.89 |
3 |
1088.63 |
1.09 |
0.4490 |
|
| Pure error |
3990.23 |
4 |
997.56 |
|
|
|
| Total |
3.960 × 10⁵ |
16 |
|
|
|
|
3.3.2 3-D response surface analysis. Fig. 5 is the 3-dimensional surface plot and the contour diagram of the combined effects of the varied elements on BAC iodine adsorption value. We can see from Fig. 5(a) that the interaction of temperature A and time B has a parabolic distribution on the iodine adsorption value. When the temperature is constant, the iodine adsorption value increases and then decreases slightly as time increases. When time is constant, the iodine adsorption value increases and then decreases as the temperature increases. In contrast, temperature significantly affects iodine adsorption value than time. Setting the sensitive factor temperature A at 850–900 °C can significantly improve the iodine adsorption level.
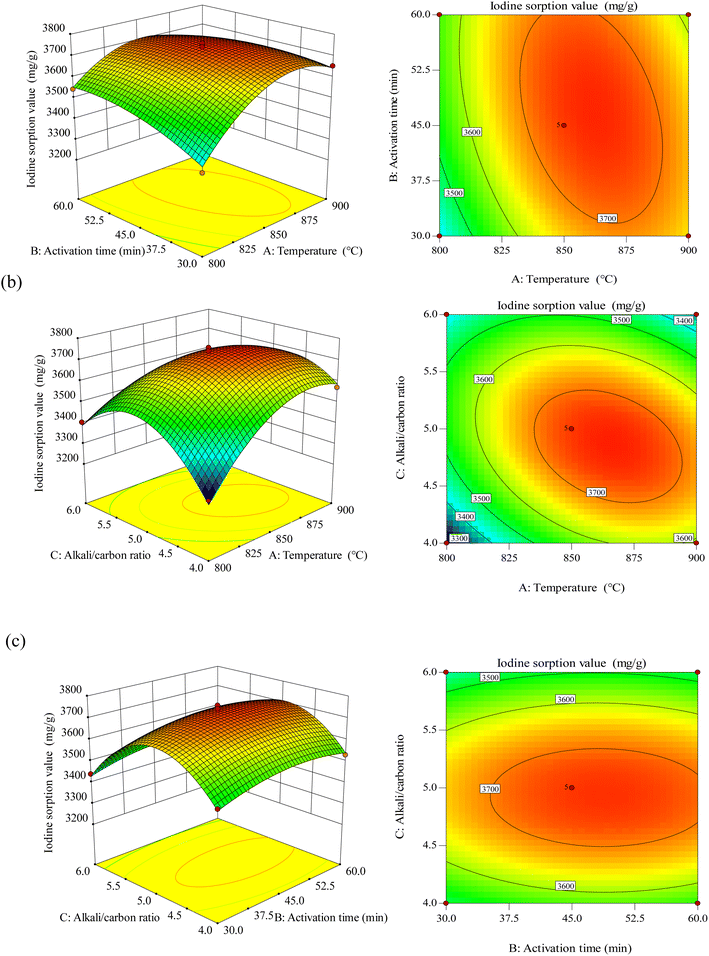 |
| | Fig. 5 Response surface plots for the influence of activation temperature and activation time (a), activation temperature and alkali/carbon ratio (b), activation time and alkali/carbon ratio (c). | |
Fig. 5(b) shows the interaction of temperature A and alkali–carbon ratio C with the iodine adsorption value. It can be observed from the plot that the temperature significantly affects the iodine adsorption value than the alkali–carbon ratio; take a moderate level: when temperature A is 850–875 °C and alkali/carbon ratio C is 4.5–5.0, the iodine adsorption value is the highest. Fig. 5(c) shows that the interaction between time B and alkali-carbon ratio C presents a typical arched surface distribution, and the alkali–carbon ratio is a sensitive factor affecting the iodine adsorption value. According to the software prediction results and experimental verification, the optimum adsorption factors obtained were temperature A of 864 °C, time B of 46 min, and alkali–carbon ratio C of 4.85![[thin space (1/6-em)]](https://www.rsc.org/images/entities/char_2009.gif) :
:![[thin space (1/6-em)]](https://www.rsc.org/images/entities/char_2009.gif) 1. The activated carbon prepared under these optimal conditions was named BAC.
1. The activated carbon prepared under these optimal conditions was named BAC.
3.4 Characterization analysis of RC and BAC
3.4.1 Specific surface area and pore size distribution. Fig. 6(a) shows the N2 adsorption and desorption isotherms of BAC and RC. According to the IUPAC classification rule, it is known that the N2 adsorption and desorption isotherm of BAC belongs to the mixed type I and type VI.31 At the initial stage of the adsorption process, N2 adsorption capacity shows a trend of rapid increase, indicating that there are abundant micropores in BAC; with the increase of P/P0, the adsorption curve gradually flattens; when P/P0 was in the range of 0.4–0.9, there was a lagging loop, which is connected with capillary condensation that occurs in the mesoporous.32
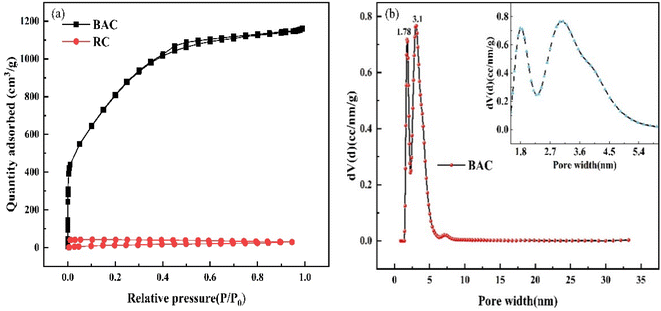 |
| | Fig. 6 N2 adsorption and desorption isotherms (a) and pore size distributions of BAC (b). | |
As can be seen from the aperture distribution of BAC in Fig. 6(b), there are two peaks at 1.78 nm and 3.1 nm, indicating that micropores and mesopores occupy a large proportion, which is in line with the results obtained by the adsorption isotherm of BAC.
The specific surface area of activated carbon directly affects its adsorption rate. The general activated carbon specific surface area is between 500 m2 g−1 and 1700 m2 g−1; the larger the specific surface area, the more favorable the adsorption process. Table 5 shows the BET-specific surface areas and pore-size distributions of the BAC and RC, respectively. It is clearly shown that BAC has a well-developed porous structure with a specific surface area of 2892 m2 g−1, which is much larger than that of RC (23.97 m2 g−1). The total pore volume of BAC is 1.796 cm3 g−1, and the proportion of the micropore volume is 26.45%. Therefore, BAC is mainly mesoporous. The results revealed that KOH activation played a momentous role in increasing the specific surface area of the BAC. As mentioned above, micropores offer an adsorption locus, and mesoporous pores determine the adsorption speed. Abundant mesoporous pores effectively enhance the adsorption capacity of BAC.
Table 5 Specific surface area and pore structure of BAC
| Samples |
SBET (m2 g−1) |
Vmic (cm3 g−1) |
Vmes (cm3 g−1) |
Vtotal (cm3 g−1) |
Vmic/Vtotal (%) |
DP (nm) |
| RC |
23.97 |
0 |
0.04 |
0.04 |
0 |
7.08 |
| BAC |
2892 |
0.48 |
1.32 |
1.80 |
26.45 |
2.48 |
3.4.2 Morphology of RC and BAC. The surface morphology characteristics of RC and BAC are shown in Fig. 7. It can be seen from Fig. 7(a) and (b) that RC and BAC are fibrous in microscopic morphology, respectively. After activation, the structure of BAC was observed to be distorted and deformed, and the material presented a finer stick and block structure, indicating that the surface structure of the carbon material was destroyed under the etching action of KOH at high temperatures.33,34 The undulating fold structure on the surface of activated carbon can effectively increase the contact area between it and the target pollutant. In the process of bamboo fiber pyrolysis, a large amount of organic matter volatilizes, and its asymmetric space shrinks, resulting in the formation of a carbon skeleton. As illustrated in Fig. 7(e) and (f), the basic pore structure of the bamboo fiber is maintained during carbonization and activation. Combined with the BET characterization results, activated carbon has many micropores and mesoporous structures that provide rich adsorption sites for bamboo fiber-activated carbon.
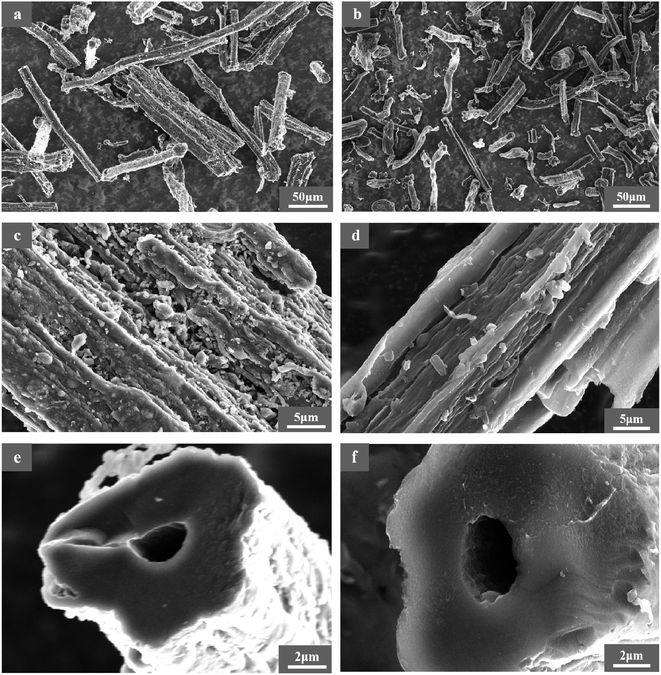 |
| | Fig. 7 Surface morphology of RC (a, c, and e) and BAC (b, d, and f). | |
3.4.3 Carbon microcrystalline structure of RC and BAC. The XRD spectra of RC and BAC are shown in Fig. 8(a). The wide diffraction peak of RC at 22.5° corresponds to the (002) crystal plane of the graphite structure, which is a typical crystalline structure of cellulose. Some minerals, such as CaCO3, were also detected in the RC. After KOH modification, the microcrystallinity and the graphitization degree of bamboo fiber-activated carbon decreased.35
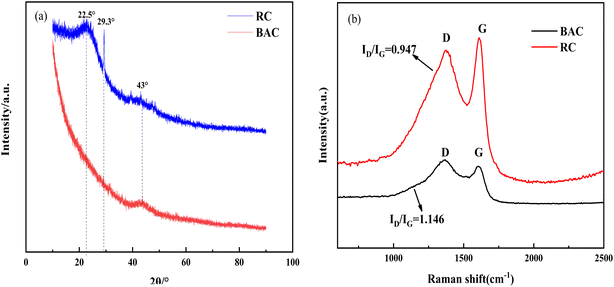 |
| | Fig. 8 XRD (a) and Raman (b) spectra of RC and BAC. | |
The Raman spectra of RC and BAC are presented in Fig. 8(b). Peaks D and G were observed in the spectrograms of the two materials. Peak D indicates that the samples have amorphous C atoms with structural defects, which represents the characteristic peak of disordered carbon; peak G indicates that the C atom SP2 of the sample is hybridized and represents the characteristic peak of ordered graphite structure.36,37 The increase in the BAC peak intensity ratio (ID/IG) indicated that the aromatic structure with high stability increased; the activation process of KOH increased the structural defects of the activated carbon and deformed its carbon layer, which can effectively transport ions and improve the adsorption performance of the activated carbon.38
3.4.4 Elemental composition analyses of RC and BAC. The elemental composition of RC and BAC and the bonding forms of C, N and O were analyzed by X-ray photoelectron spectroscopy. It can be seen from Fig. 9(a) and (e) that RC consists mainly of C and O elements, with a small amount of N, Ga and Si elements. BAC consists mainly of C and O elements, with a small amount of N and Si elements. The high-resolution C 1s spectra of the two materials can be best fitted by five atomic states. In Fig. 9(b), there are four types of carbon atoms connected with N, O and Si in the C 1s spectrum of RC. The peak centered at 281.9 eV represents the C–Si, the peak centered at 283.5 eV corresponds to the C–C or C![[double bond, length as m-dash]](https://www.rsc.org/images/entities/char_e001.gif) C, the strong peak indicates that the bonding mode of C in RC is dominated by C
C, the strong peak indicates that the bonding mode of C in RC is dominated by C![[double bond, length as m-dash]](https://www.rsc.org/images/entities/char_e001.gif) C, and the C element with SP3 hybridization is the main body. The peak centered at 285.6 eV is C–O/C–N. The single peak at 287.9 eV indicates that C and O mainly exist in the form of double bonds; O 1s showed three obvious peaks at 529 eV, 530.7 eV and 532.2 eV in the energy spectrum, belonging to C
C, and the C element with SP3 hybridization is the main body. The peak centered at 285.6 eV is C–O/C–N. The single peak at 287.9 eV indicates that C and O mainly exist in the form of double bonds; O 1s showed three obvious peaks at 529 eV, 530.7 eV and 532.2 eV in the energy spectrum, belonging to C![[double bond, length as m-dash]](https://www.rsc.org/images/entities/char_e001.gif) O, C–O–C and O–C
O, C–O–C and O–C![[double bond, length as m-dash]](https://www.rsc.org/images/entities/char_e001.gif) O, respectively. The N 1s spectrum shows two components, pyridinic-N and pyrrolic-N, located around 397.6 eV and 399.5 eV, respectively.
O, respectively. The N 1s spectrum shows two components, pyridinic-N and pyrrolic-N, located around 397.6 eV and 399.5 eV, respectively.
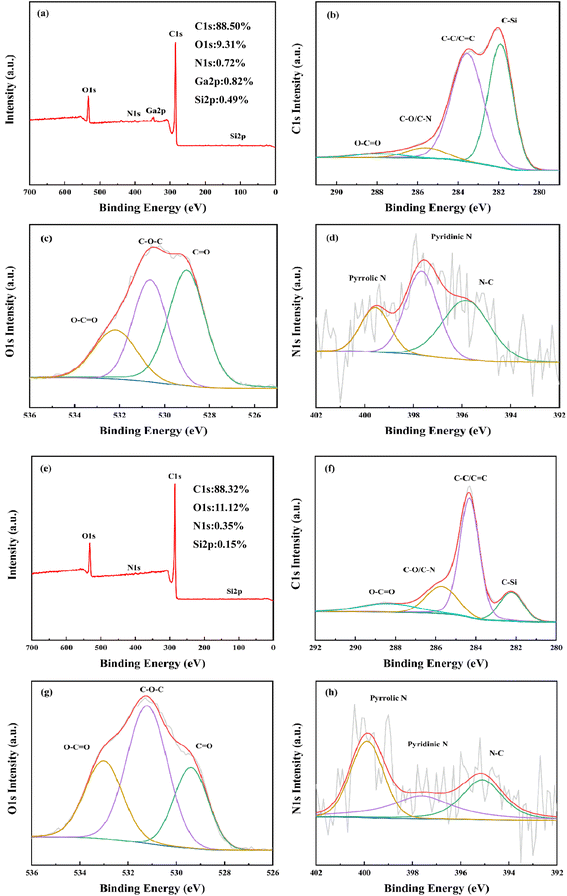 |
| | Fig. 9 X-ray photoelectron spectroscopy of RC (a–d) and BAC (e–h). | |
After activation, C content decreased from 88.50% to 88.32%, O content increased from 9.31% to 11.12%, and N content decreased to 0.35%. As depicted in the C 1s spectrum of BAC in Fig. 9(f), there are four peaks fitting at 282.2 eV, 284.3 eV, 285.7 eV and 288.4 eV, corresponding to C–Si, C–C/C![[double bond, length as m-dash]](https://www.rsc.org/images/entities/char_e001.gif) C, C–O/C
C, C–O/C![[double bond, length as m-dash]](https://www.rsc.org/images/entities/char_e001.gif) N and O–C
N and O–C![[double bond, length as m-dash]](https://www.rsc.org/images/entities/char_e001.gif) O, respectively. The three peaks at 529.4 eV, 531.3 eV and 533 eV in the O 1s spectrum represent C
O, respectively. The three peaks at 529.4 eV, 531.3 eV and 533 eV in the O 1s spectrum represent C![[double bond, length as m-dash]](https://www.rsc.org/images/entities/char_e001.gif) O, C–O–C and O–C
O, C–O–C and O–C![[double bond, length as m-dash]](https://www.rsc.org/images/entities/char_e001.gif) O, respectively. Compared with O 1s in RC, carbon-based oxygen atoms in BAC produce higher binding energy at 533 eV.39 The energy spectrum of N 1s shows that N in BAC mainly exists in the form of pyridinic-N and pyrrolic-N, which are located near 397.6 eV and 399.9 eV, respectively, followed by N–C located near 395.2 eV. The total amount of N and O elements is 11.47%, which is conducive to the hydrophilicity of BAC; BAC has a higher O 1s/C 1s atomic ratio. The results showed that KOH activation enriched the quantity of oxygen-containing functional groups on the surface of the activated carbon, which enhanced the polarity and acidity of the activated carbon surface. This property plays a positive role in promoting the adsorption of cationic dyes.
O, respectively. Compared with O 1s in RC, carbon-based oxygen atoms in BAC produce higher binding energy at 533 eV.39 The energy spectrum of N 1s shows that N in BAC mainly exists in the form of pyridinic-N and pyrrolic-N, which are located near 397.6 eV and 399.9 eV, respectively, followed by N–C located near 395.2 eV. The total amount of N and O elements is 11.47%, which is conducive to the hydrophilicity of BAC; BAC has a higher O 1s/C 1s atomic ratio. The results showed that KOH activation enriched the quantity of oxygen-containing functional groups on the surface of the activated carbon, which enhanced the polarity and acidity of the activated carbon surface. This property plays a positive role in promoting the adsorption of cationic dyes.
3.5 Adsorption experiment results
3.5.1 Effect of adsorbent dosage. Experiments were performed under the following conditions: temperature (298 K), rotational speed (120 rpm) and initial CV concentration (400 mg L−1). As depicted in Fig. 10, when the dosage was increased from 0.01 g to 0.04 g, the CV removal rate increased to 100%. With the increase in BAC dosage, the total BAC-specific surface area and active adsorption site for adsorbing CV increased. The adsorption of CV leveled off gradually when the amount of BAC is enough. Simultaneously, it can be noticed that the unit mass adsorption capacity of BAC decreases gradually from 1717.435 mg L−1 to 332.687 mg L−1. This may be because as the amount of BAC increases, carbon particles collide with each other, and the CV molecules surrounding BAC per unit mass are constantly reduced.40,41 Therefore, the optimal dosage of 0.04 g was selected for subsequent experiments.
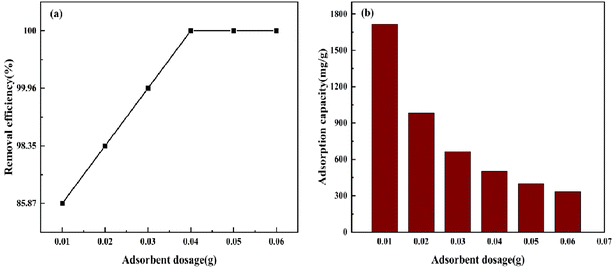 |
| | Fig. 10 Effect of adsorbent dosage on CV removal efficiency and adsorption capacity by BAC. | |
3.5.2 Effect of initial concentration. The impact of variation in the initial CV concentration from 400 mg L−1 to 900 mg L−1 was observed for adsorption (Fig. 11). The removal rate of CV by BAC decreased from 100% to 97.50%, and the adsorption capacity per unit mass increased from 499.863 mg g−1 to 1094.147 mg g−1. When the BAC dosage is constant, the number of pores on its surface is constant, and the number of surface functional groups and the active locus is also fixed. In the lower concentration range, the concentration difference between solid and liquid increases as the original concentration of CV increases, thereby increasing the driving force for the diffusion of CV molecules to the BAC surface in solution. Most CV molecules are adsorbed at the active locus on the BAC surface. However, owing to the limited active locus available for adsorption on the BAC surface, as the concentration continues to increase, the activated carbon reaches saturation adsorption capacity, and the concentration of residual crystal violet in the solution increases, leading to a reduction in removal rate.42 When the CV initial concentration is 600 mg L−1, BAC can remove 99.96% of CV and has a high adsorption capacity per unit mass.
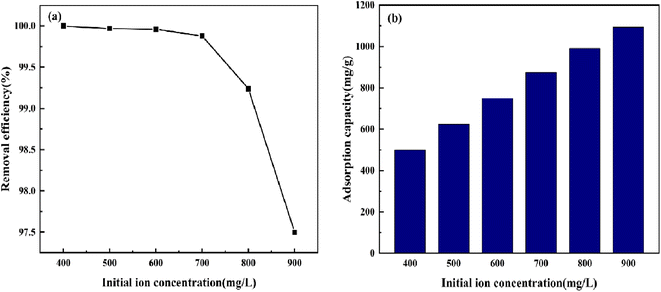 |
| | Fig. 11 The effect of initial concentration on CV removal efficiency and adsorption capacity. | |
3.5.3 Effect of adsorption time. As shown in Fig. 12, under the condition that the BAC dose was 0.04 g and the initial CV concentration was 600 mg L−1, CV in the solution could easily be removed by BAC. Within 10 min after the adsorption, the removal rate reached 99.92%; this stage is the rapid adsorption stage. The following is a slow adsorption process in which the remaining CV molecules in the solution can only be allocated to the remaining low-activity adsorption sites on the BAC surface.43 When the adsorption time is 40 min, the maximum adsorption capacity reaches 749.7 mg g−1, and the reaction has reached the end point.
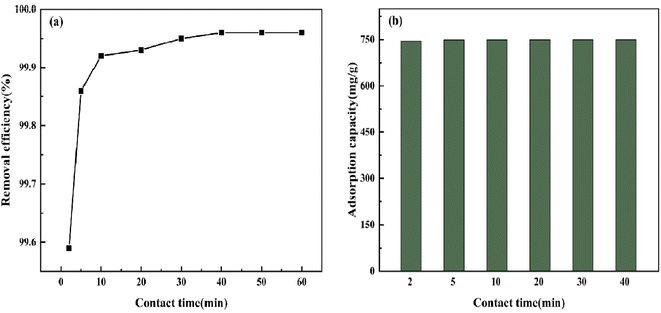 |
| | Fig. 12 The effect of contact time on CV removal efficiency and adsorption capacity. | |
3.5.4 Adsorption kinetics. Based on the adsorption kinetics, the adsorption mechanism of CV by BAC was predicted. The results of the kinetic model fitting are shown in Fig. 13 and Table 6. Through the calculation and comparison of regression coefficients (R2) (Table 6), it can be concluded that the fitting R2 values of the two models are close to 1. However, the R2 value of the pseudo-second-order kinetic model is slightly higher than that of the pseudo-first-order kinetic model, and the calculated equilibrium adsorption capacity of the pseudo-second-order kinetic model is closer to the measured value. Therefore, adsorption is a process dominated by chemical adsorption and coexisted with physical adsorption.44
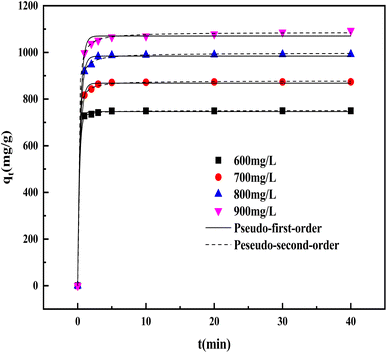 |
| | Fig. 13 Kinetics of CV adsorption onto BAC. (experimental conditions: temperature = 25 °C, dose = 0.04 g, agitation speed = 120 rpm, and volume = 50 mL). | |
Table 6 Kinetic parameters for adsorption of CV onto BAC
| CV concentration (mg L−1) |
Pseudo-first-order |
Pseudo-second-order |
| k1 |
qe (mg g−1) |
R2 |
k2 |
qe (mg g−1) |
R2 |
| 600 |
3.68 |
746.51 |
0.99958 |
0.04 |
750.90 |
0.9999 |
| 700 |
2.77 |
868.15 |
0.99896 |
0.02 |
878.27 |
0.9998 |
| 800 |
2.64 |
984.24 |
0.9984 |
0.01 |
997.32 |
0.9996 |
| 900 |
2.63 |
1070.35 |
0.99776 |
0.01 |
1086.45 |
0.9998 |
3.5.5 Adsorption isotherms. Fig. 14(a) and Table 7 demonstrate the adsorption isothermal model fitting curves and corresponding isotherm parameters, respectively. Comparing R2 of the two models, the Langmuir isothermal model presents a very good fit, indicating that the CV adsorbed onto the homogeneous surface of BAC occurs in a monolayer. The maximum monolayer adsorption capacity (qm) of BAC was estimated to be 1353.09 mg g−1. The separation factors RL are found between 0 and 1; it is proved that the adsorption process is favorable.45 Freundlich constant n values are all greater than 2, indicating that BAC has a strong adsorption capacity. According to the results of the Langmuir fitting, the adsorption amount decreased significantly as the temperature increased, indicating that the increase in temperature was not conducive to the adsorption of BAC. It can be observed from Table 8 that, compared with other adsorbents, BAC has an outstanding ability to adsorb CV.
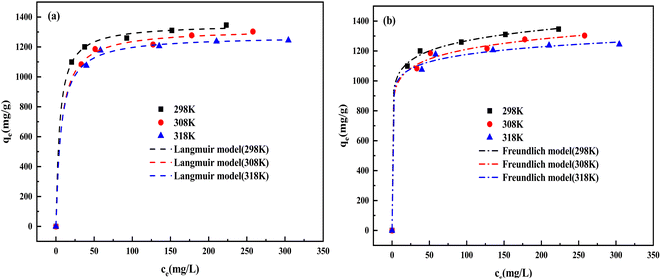 |
| | Fig. 14 (a) Langmuir isotherm model and (b) Freundlich isotherm model for CV adsorption on BAC. | |
Table 7 Isotherm parameters for CV adsorption
| T (K) |
qmax (mg g−1) |
Langmuir model |
Freundlich model |
| KL |
RL |
R2 |
KF |
n |
R2 |
| 298 |
1353.09 |
0.21 |
0.0053 |
0.9989 |
886.68 |
12.67 |
0.9899 |
| 308 |
1321.05 |
0.14 |
0.0079 |
0.9978 |
839.43 |
12.56 |
0.9975 |
| 318 |
1274.44 |
0.15 |
0.0074 |
0.9985 |
886.69 |
16.28 |
0.9967 |
Table 8 Comparison of CV removal ability of different adsorbents
| Material |
Initial concentration/mg L−1 |
Adsorption dose/mg |
Time/min |
pH |
Temperature/°C |
Adsorption capacity/mg g−1 |
References |
| Modified rice husk |
1000 |
25 |
60 |
10 |
25 |
90.02 |
46 |
| Chitin activated carbon |
500 |
50 |
80 |
10 |
45 |
420.068 |
47 |
| Coconut husk powder |
500 |
250 |
150 |
5 |
45 |
454.54 |
48 |
| Pomegranate peel charcoal |
40.1 |
79 |
5.7 |
9.9 |
25 |
211.8 |
49 |
| Cocoa leaves biochar |
100 |
400 |
160 |
9 |
27 |
253.3 |
50 |
| BAC |
900 |
40 |
90 |
7 |
25 |
1099.036 |
This work |
3.5.6 Thermodynamics studies. From Table 9, the thermodynamic arguments (ΔH, ΔS and ΔG) for CV adsorption on BAC were evaluated using the thermodynamic eqn (9)–(12). The negative value of enthalpy change ΔH (−13.45 kJ mol−1) indicates that the adsorption process is exothermic, which agrees with the changing trend of the maximum theoretical equilibrium adsorption capacity in the parameter table.51 The entropy change (ΔS) was positive, indicating that adsorption is a process of entropy increase that reflects the random increase in the reaction interface between CV and BAC during the adsorption process. ΔG was negative, indicating that the adsorption reaction is an autonomous process driven by entropy.
Table 9 Thermodynamic parameters for CV adsorption onto BAC
| T (K) |
ΔG (kJ mol−1) |
ΔH (kJ mol−1) |
ΔS (kJ mol−1 K−1) |
| 298 |
−28.14 |
−13.45 |
0.048 |
| 308 |
−28.05 |
| 318 |
−28.14 |
3.5.7 SEM-EDS analysis before and after BAC adsorption. As shown in Fig. 15, by comparing the scanning electron microscope images before and after BAC adsorption, it can be found that after the adsorption of CV, obvious white particles and bright areas appeared on the surface of the BAC. It is speculated that the adsorption process includes precipitation, which results in the enrichment of CV on the BAC surface.52 Fine particles can be seen around and inside the pores, indicating that the adsorption process also involves pore filling. As can be seen from the EDS spectrum of BAC in Fig. 15(a), its C content is the highest, in addition to some O and N. After the adsorption of CV, C content increased to 98.71%, N content increased from 0.59% to 0.96%, and O content decreased from 3.13% to 0.02%. The decrease in the O element indicated that the oxygen-containing functional groups on the BAC surface react with CV during the adsorption process. N bonded with oxygen-containing functional groups through bond energy, speeding up the adsorption reaction. It can be concluded that ionic action and oxygen-containing functional groups played an important role in promoting the adsorption process.
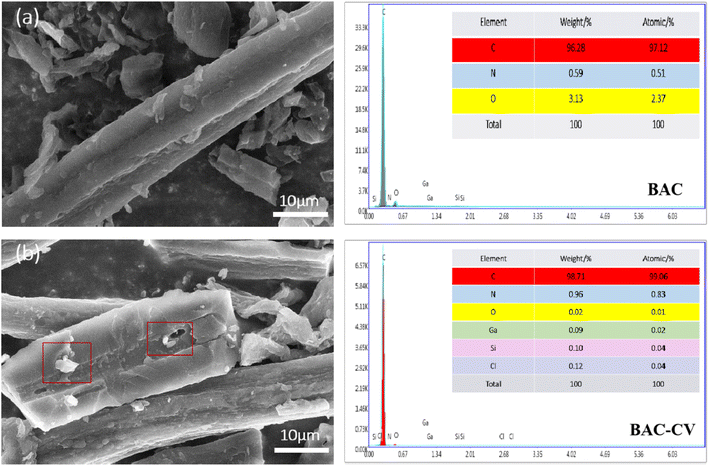 |
| | Fig. 15 SEM-EDS images before (a) and after (b) adsorption of the dye on BAC. | |
4 Conclusion
In this study, the adsorption of CV from aqueous solutions using the BAC adsorbent prepared from the bamboo fiber was investigated. Various analyses, such as BET, SEM, XRD, Raman and XPS, were performed and used to study the surface properties of the BAC. According to the experimental results, the adsorption efficiency and adsorption capacity of BAC were found to be influenced by several factors (adsorbent dosage, initial CV concentration and contact time). The adsorption process of CV on BAC is more consistent with the pseudo-second-order kinetic model and Langmuir isothermal model, indicating that CV adsorbed onto the homogeneous surface of BAC occurs in a monolayer. The thermodynamic investigations showed that the adsorption processes were feasible and spontaneous. The maximum adsorption capacity of BAC on CV reached up to 1353.09 mg g−1. By analyzing the changes in the types and contents of micro-elements on the BAC surface before and after adsorption, CV was successfully adsorbed; ion exchange and oxygen-containing functional groups provided an important driving force for the adsorption process. It is noteworthy that if the adsorbed saturated activated carbon is not regenerated, it causes secondary pollution to the environment. Therefore, the next step of this study will focus on the reuse of activated carbon.
Conflicts of interest
The authors declare that there is no conflict of interest regarding the publication of this paper.
Acknowledgements
This work was partially supported by the National Natural Science Foundation of China (22208138), the Nature Science Foundation of Liaoning Province (2021-MS-306), Liaoning Provincial Department of Education Project (2020LNQN03).
References
- L. J. J. Isotherm, Kinetic, Thermodynamic and Competitive for Adsorption of Brilliant Green and Quinoline Yellow Dyes by Activated Carbon, Korean Chem. Eng. Res., 2021, 59(4), 565–573 Search PubMed.
- A. M. Aldawsari, I. H. Alsohaimi and A. A. Kahtani, et al., Adsorptive performance of aminoterephthalic acid modified oxidized activated carbon for malachite green dye: mechanism, kinetic and thermodynamic studies, Sep. Sci. Technol., 2021, 56(5), 835–846 CrossRef CAS.
- Y. F. Zeng, J. Liu and J. X. Qiu, et al., Research Progress in Electrochemical Methods for Treatment of Heavy Metal Electroplating Wastewater, Recycling Research, 2018, 11(6), 42–44 Search PubMed.
- L. Mahardiani, R. Ilfama and S. Saputro, et al., Nanocellulose Obtained from Biomass as Advance Adsorbent for Methylene Blue and Crystal Violet, J. Phys.: Conf. Ser., 2021, 1912(1), 12015 CrossRef CAS.
- G. Sangavi, A. Bakshi and M. Ganapathy, et al., Adsorption of Reactive Dyes from Aqueous Solution Using Activated Carbon Prepared from Plantain Leaf Sheath Waste, Chem. Biochem. Eng. Q., 2020, 34(3), 169–180 CrossRef CAS.
- S. A. Nisreen, R. K. Khairi and N. A. Amer, et al., Albayati Performance of a solar photocatalysis reactor as pretreatment for wastewater via UV, UV/TiO2, and UV/H2O2 to control membrane fouling, Sci. Rep., 2022, 12, 16782 CrossRef PubMed.
- Y. Laftani, A. Boussaoud and B. Chatib, et al., Comparison of advanced oxidation processes for degrading Ponceau S dye. Application of photo-Fenton process, Maced. J. Chem. Chem. Eng., 2019, 38(2), 197–205 CrossRef CAS.
- J. Wang, X. Yang and D. Y. Zheng, et al., Fabrication of Bioinspired Gallic Acid-Grafted Chitosan/Polysulfone Composite Membranes for Dye Removal via Nanofiltration, ACS Omega, 2020, 5(22), 13077–13086 CrossRef CAS PubMed.
- L. Aoudjit, D. Zioui and F. Touahra, et al., Photocatalytic Degradation of Tartrazine Dyes Using TiO2–Chitosan Beads under Sun Light Irradiation, Russ. J. Phys. Chem. A, 2021, 95(5), 1069–1076 CrossRef CAS.
- S. Singh, A. K. Prajapati and J. P. Chakraborty, et al., Adsorption Potential of Biochar Obtained from Pyrolysis of Raw and Torrefied Acacia Nilotica Towards Removal of Methylene Blue Dye from Synthetic Wastewater, Biomass Convers. Biorefin., 2021, 1–22 Search PubMed.
- L. D. Li, S. Y. Tan and W. P. Su, et al., Research Progress of Crystal Violet Dyeing Wastewater Treatment Technology, Environ. Sci. Technol., 2017, 40(S2), 179–183 Search PubMed.
- Y. Laftani, A. Boussaoud and B. Chatib, et al., Comparison of Advanced Oxidation Processes for Degrading Ponceau S Dye. Application of Photo-Fenton Process, Maced. J. Chem. Chem. Eng., 2019, 38(2), 197–205 CrossRef CAS.
- Y. Chen, N. Cheng and Y. B. Yang, et al., Adsorption of Crystal Violet Dye by Physical Ultrasonic Modified Bentonite, Ind. Water Treat., 2021, 41(09), 98–103 Search PubMed.
- D. N. C. Brice, N. H. Manga and B. S. Arnold, et al., Adsorption of Tartrazine onto Activated Carbon Based Cola Nuts Shells: Equilibrium, Kinetics, and Thermodynamics Studies, Open J. Inorg. Chem., 2021, 11(01), 1–19 CrossRef CAS.
- W. Dai, H. Yu and N. Ma, et al., Adsorption Equilibrium and Kinetic Studies of Crystal Violet and Naphthol Green on Torreya-Grandis-Skin-Based Activated Carbon, Korean J. Chem. Eng., 2015, 32(2), 335–341 CrossRef CAS.
- H. Zhang, Y. Sun and S. Li, et al., Preparation, Characterization, and Efficient Chromium (Vi) Adsorption of Phosphoric Acid Activated Carbon from Furfural Residue: An Industrial Waste, Water Sci. Technol., 2020, 82(12), 2864–2876 CrossRef CAS PubMed.
- A. Ghazali, M. Shirani and A. Semnani, et al., Optimization of Crystal Violet Adsorption onto Date Palm Leaves as a Potent Biosorbent From Aqueous Solutions Using Response Surface Methodology and Ant Colony, J. Environ. Chem. Eng., 2018, 6(4), 3942–3950 CrossRef CAS.
- B. G. Salas-Enríquez, A. M. Torres-Huerta and E. Conde-Barajas, et al., Activated carbon production from the Guadua amplexifolia using a combination of physical and chemical activation, J. Therm. Anal. Calorim., 2016, 124(3), 1383–1398 CrossRef.
- X. L. Hou, Q. Guo and X. P. Jian, et al., Optimization of Design of Lignin-Based Activated Carbon Based on Response Surface
Methodology, Chem. Ind. For. Prod., 2020, 40(03), 115–122 CAS.
- C. Tian and D. Wu, Mechanical Properties of ZSM-5 Extruded Catalysts: Calcination Process Optimization Using Response Surface Methodology, Chem. Eng. Commun., 2021, 208(11), 1594–1606 CrossRef CAS.
- O. Oribayo, A. P. Olalekan and R. U. Owolabi, et al., Adsorption of Cr(Vi) Ions From Aqueous Solution Using Rice Husk-Based Activated Carbon: Optimization, Kinetic, and Thermodynamic Studies, Environmental Quality Management, 2020, 30(1), 61–77 CrossRef.
- W. Wang, Y. Liu and X. Liu, et al., Equilibrium Adsorption Study of the Adsorptive Removal of Cd2+ and Cr6+ Using Activated Carbon, Environ. Sci. Pollut. Res., 2018, 25(25), 25538–25550 CrossRef CAS PubMed.
- S. M. Kharrazi, M. Soleimani and M. Jokar, et al., Pretreatment of Lignocellulosic Waste as a Precursor for Synthesis of High Porous Activated Carbon and its Application for Pb (Ii) and Cr(Vi) Adsorption from Aqueous Solutions, Int. J. Biol. Macromol., 2021, 180, 299–310 CrossRef CAS PubMed.
- G. K. Latinwo, A. O. Alade and S. E. Agarry, et al., Process Optimization and Modeling the Adsorption of Polycyclic Aromatic-Congo Red Dye onto Pod-Derived Activated Carbon, Polycyclic Aromat. Compd., 2021, 41(2), 400–418 CrossRef CAS.
- T. V. Nagalakshmi, K. A. Emmanuel and P. Bhavani, Adsorption of Disperse Blue 14 onto Activated Carbon Prepared from Jackfruit-Ppi-I Waste, Mater. Today: Proc., 2019, 18(6), 2036–2051 Search PubMed.
- A. Kumar and H. M. Jena, Adsorption of Cr(Vi) From Aqueous Solution by Prepared High Surface Area Activated Carbon From Fox Nutshell by Chemical Activation with H3Po4, J. Environ. Chem. Eng., 2017, 5(2), 2032–2041 CrossRef CAS.
- A. Lim, J. J. Chew and L. H. Ngu, et al., Synthesis, Characterization, Adsorption Isotherm, and Kinetic Study of Oil Palm Trunk-Derived Activated Carbon for Tannin Removal from Aqueous Solution, ACS Omega, 2020, 5(44), 28673–28683 CrossRef CAS PubMed.
- L. Brahmi, F. Kaouah and S. Boumaza, et al., Response Surface Methodology for the Optimization of Acid Dye Adsorption onto Activated Carbon Prepared from Wild Date Stones, Appl. Water Sci., 2019, 9(8), 1–13 CAS.
- A. Dzigbor and A. Chimphango, Production and Optimization of NaCl-Activated Carbon from Mango Seed Using Response Surface Methodology, Biomass Convers. Biorefin., 2019, 9(2), 421–431 CrossRef CAS.
- O. Baytar, Ö. Şahin and S. Horoz, et al., High-Performance Gas-Phase Adsorption of Benzene and Toluene on Activated Carbon: Response Surface Optimization, Reusability, Equilibrium, Kinetic, and Competitive Adsorption Studies, Environ. Sci. Pollut. Res., 2020, 27(21), 26191–26210 CrossRef CAS PubMed.
- M. Şirazi and S. Aslan, Comprehensive Characterization of High Surface Area Activated Carbon Prepared from Olive Pomace by Koh Activation, Chem. Eng. Commun., 2021, 208(10), 1479–1493 CrossRef.
- C. Tian and D. Wu, Mechanical Properties of ZSM-5 Extruded Catalysts: Calcination Process Optimization Using Response Surface Methodology, Chem. Eng. Commun., 2021, 208(11), 1594–1606 CrossRef CAS.
- A. H. Jawad, A. S. Abdulhameed and N. N. Bahrudin, et al., Microporous activated carbon developed from KOH activated biomass waste: surface mechanistic study of methylene blue dye adsorption, Water Sci. Technol., 2021, 84(8), 1858–1872 CrossRef CAS PubMed.
- A. Jawad, S. Ahmed and D. Lee, et al., High surface area and mesoporous activated carbon from KOH-activated dragon fruit peels for methylene blue dye adsorption: Optimization and mechanism study, Chin. J. Chem. Eng., 2021, 32(04), 281–290 CrossRef CAS.
- G. Kavitha, P. Subhapriya and V. Dhanapal, et al., Dye Removal Kinetics and Adsorption Studies of Activated Carbon Derived from the Stems of Phyllanthus Reticulatus, Mater. Today: Proc., 2021, 45(9), 7934–7938 CAS.
- D. Bal Altuntaş, V. Nevruzoğlu and M. Dokumacı, et al., Synthesis and Characterization of Activated Carbon Produced from Waste Human Hair Mass Using Chemical Activation, Carbon Lett., 2020, 30(3), 307–313 CrossRef.
- V. Dodevski, B. Janković and I. Radović, et al., Characterization Analysis of Activated Carbon Derived from the Carbonization Process of Plane Tree (Platanus Orientalis) Seeds, Energy Environ., 2020, 31(4), 583–612 CrossRef CAS.
- M. Gale, T. Nguyen and M. Moreno, et al., Physiochemical Properties of Biochar and Activated Carbon from Biomass Residue: Influence of Process Conditions to Adsorbent Properties, ACS Omega, 2021, 6(15), 10224–10233 CrossRef CAS PubMed.
- L. Liu, Y. Li and S. Fan, Preparation of Koh and H3Po4 Modified Biochar and its Application in Methylene Blue Removal from Aqueous Solution, Processes, 2019, 7(12), 891 CrossRef CAS.
- R. Foroutan, S. J. Peighambardoust and S. H. Peighambardoust, et al., Adsorption of Crystal Violet Dye Using Activated Carbon of Lemon Wood and Activated Carbon/Fe3O4 Magnetic Nanocomposite from Aqueous Solutions: A Kinetic, Equilibrium and Thermodynamic Study, Molecules, 2021, 26(8), 2241 CrossRef CAS PubMed.
- B. Nba, B. Mf and B. So, et al., Comparative Study on Removal of Two Basic Dyes in Aqueous Medium by Adsorption Using Activated Carbon from Ziziphus Lotus Stones - Sciencedirect, Microchem. J., 2019, 146, 1010–1018 CrossRef.
- R. Nazir, M. Khan and R. Ur Rehman, et al., Adsorption of Selected Azo Dyes from an Aqueous Solution by Activated Carbon Derived from Monotheca Buxifolia Waste Seeds, Soil Water Res., 2020, 15(3), 166–172 CrossRef CAS.
- F. P. Sari, D. H. Y. Yanto and G. Pari, Activated Carbon Derived from OPEFB by One Step Steam Activation and its Application for Dye Adsorption: Kinetics and Isothermal Studies, Reaktor, 2019, 19(2), 68–76 CrossRef.
- Y. Hou, G. Huang and J. Li, et al., Hydrothermal Conversion of Bamboo Shoot Shell to Biochar: Preliminary Studies of Adsorption Equilibrium and Kinetics for Rhodamine B Removal, J. Anal. Appl. Pyrolysis, 2019, 143, 104694 CrossRef CAS.
- G. K. Latinwo, A. O. Alade and S. E. Agarry, et al., Process Optimization and Modeling the Adsorption of Polycyclic Aromatic-Congo Red Dye Onto; Pod-Derived Activated Carbon, Polycyclic Aromat. Compd., 2021, 41(2), 400–418 CrossRef CAS.
- H. P. Lal, P. Rachana and P. Sujan, et al., Adsorption and removal of crystal violet dye from aqueous solution by modified rice husk, Heliyon, 2022, 8(4), 9261 Search PubMed.
- Q. S. Ji and H. C. Li, High surface area activated carbon derived from chitin for efficient adsorption of Crystal Violet, Diamond Relat. Mater., 2021, 118, 108516 CrossRef CAS.
- S. Sharmin, I. Khairul and M. Hasan, et al., Adsorption of crystal violet dye by coconut husk powder: Isotherm, kinetics and thermodynamics perspectives, Environ. Nanotechnol., Monit. Manage., 2022, 17, 100651 Search PubMed.
- S. Aiman, A. A. Saud and A. H. Jawad, et al., Production of large surface area activated carbon from a mixture of carrot juice pulp and pomegranate peel using microwave radiation-assisted ZnCl2 activation: An optimized removal process and tailored adsorption mechanism of crystal violet dye, Diamond Relat. Mater., 2022, 130, 109456 CrossRef.
- J. J. Mosebolatan, A. M. Ayorinde and O. I. Adekunle, et al., Synthesis of high surface area mesoporous ZnCl2–activated cocoa (Theobroma cacao L) leaves biochar derived via pyrolysis for crystal violet dye removal, Heliyon, 2022, 8(10), 10873 CrossRef PubMed.
- J. J. Lee and J. K. Jeon, Isotherm, Kinetic and Thermodynamic Studies on Adsorption of Bromocresol Purple, Acid Red 66 and Acid Blue 40 Using Activated Carbon, J. Nanosci. Nanotechnol., 2021, 21(7), 4104–4109 CrossRef CAS PubMed.
- J. A. Barbosa, G. Labuto and E. N. V. M. Carrilho, Magnetic Nanomodified Activated Carbon: Characterization and Use for Organic Acids Sorption in Aqueous Medium, Chem. Eng. Commun., 2021, 208(10), 1450–1463 CrossRef CAS.
|
| This journal is © The Royal Society of Chemistry 2023 |
Click here to see how this site uses Cookies. View our privacy policy here.  Open Access Article
 *a,
Zishuo Gua,
Hongyu Chua,
Chaoshuai Hua,
Lijuan Gaoa and
Xuefei Zhao*a
![[thin space (1/6-em)]](https://www.rsc.org/images/entities/char_2009.gif) 000 tons of artificial dyes were produced every year, causing serious water pollution.3,4 Synthetic dyes from water can be eliminated using the membrane separation method, filtration, advanced oxidation method,5 coagulation and flocculation, and photocatalytic degradation.6 Laftani et al.7 used the sun-Fenton oxidation process to degrade Lichun red dye in water. The experimental results show that under the degradation conditions of Fe2+ concentration of 0.06 mM, H2O2 of 1 mM, and initial solution pH of 3, the sun-Fenton oxidation process takes only 10 minutes to degrade dye. The degradation rate was greater than 94.3%. This method is efficient, but it consumes a lot of energy, is expensive, easily causes secondary pollution, and is unsuitable for treating high-concentration dye wastewater. Wang et al.8 prepared a gallic acid-grafted chitosan/polysulfone composite nanofiltration membrane and used it for Congo red dye removal. The results showed that the nanofiltration membrane had a 97.2% rejection rate of Congo red dye, and the flux of the membrane reached 14.0 L h−1 m−2 bar−1. Membrane separation is efficient, but its life span is short. Aoudjit et al.9 prepared TiO2-chitosan microspheres (CTCS) for the degradation of tartar dye. The results showed that the degradation rate of tartar dye reached 99.37% in 180 min by synergistic action with CTCS under sunlight. Photocatalytic degradation is a new method, but in the process of degrading dyes, attention must be paid to the problem of transmittance if printing and dyeing wastewater color is deep or too much suspended matter in the water is not conducive to light transmission and affects the photocatalytic effect.10
000 tons of artificial dyes were produced every year, causing serious water pollution.3,4 Synthetic dyes from water can be eliminated using the membrane separation method, filtration, advanced oxidation method,5 coagulation and flocculation, and photocatalytic degradation.6 Laftani et al.7 used the sun-Fenton oxidation process to degrade Lichun red dye in water. The experimental results show that under the degradation conditions of Fe2+ concentration of 0.06 mM, H2O2 of 1 mM, and initial solution pH of 3, the sun-Fenton oxidation process takes only 10 minutes to degrade dye. The degradation rate was greater than 94.3%. This method is efficient, but it consumes a lot of energy, is expensive, easily causes secondary pollution, and is unsuitable for treating high-concentration dye wastewater. Wang et al.8 prepared a gallic acid-grafted chitosan/polysulfone composite nanofiltration membrane and used it for Congo red dye removal. The results showed that the nanofiltration membrane had a 97.2% rejection rate of Congo red dye, and the flux of the membrane reached 14.0 L h−1 m−2 bar−1. Membrane separation is efficient, but its life span is short. Aoudjit et al.9 prepared TiO2-chitosan microspheres (CTCS) for the degradation of tartar dye. The results showed that the degradation rate of tartar dye reached 99.37% in 180 min by synergistic action with CTCS under sunlight. Photocatalytic degradation is a new method, but in the process of degrading dyes, attention must be paid to the problem of transmittance if printing and dyeing wastewater color is deep or too much suspended matter in the water is not conducive to light transmission and affects the photocatalytic effect.10


![[thin space (1/6-em)]](https://www.rsc.org/images/entities/char_2009.gif) ln
ln![[thin space (1/6-em)]](https://www.rsc.org/images/entities/char_2009.gif) KC,
KC,

![[double bond, length as m-dash]](https://www.rsc.org/images/entities/char_e001.gif) O. The absorption peaks at 1420 cm−1 and 1320 cm−1 correspond to the deformation vibration and bending vibration of aliphatic C–H on bamboo fiber polymers, respectively.
O. The absorption peaks at 1420 cm−1 and 1320 cm−1 correspond to the deformation vibration and bending vibration of aliphatic C–H on bamboo fiber polymers, respectively.
![[thin space (1/6-em)]](https://www.rsc.org/images/entities/char_2009.gif) :
:![[thin space (1/6-em)]](https://www.rsc.org/images/entities/char_2009.gif) 1. The activated carbon prepared under these optimal conditions was named BAC.
1. The activated carbon prepared under these optimal conditions was named BAC.![[double bond, length as m-dash]](https://www.rsc.org/images/entities/char_e001.gif) C, the strong peak indicates that the bonding mode of C in RC is dominated by C
C, the strong peak indicates that the bonding mode of C in RC is dominated by C![[double bond, length as m-dash]](https://www.rsc.org/images/entities/char_e001.gif) C, and the C element with SP3 hybridization is the main body. The peak centered at 285.6 eV is C–O/C–N. The single peak at 287.9 eV indicates that C and O mainly exist in the form of double bonds; O 1s showed three obvious peaks at 529 eV, 530.7 eV and 532.2 eV in the energy spectrum, belonging to C
C, and the C element with SP3 hybridization is the main body. The peak centered at 285.6 eV is C–O/C–N. The single peak at 287.9 eV indicates that C and O mainly exist in the form of double bonds; O 1s showed three obvious peaks at 529 eV, 530.7 eV and 532.2 eV in the energy spectrum, belonging to C![[double bond, length as m-dash]](https://www.rsc.org/images/entities/char_e001.gif) O, C–O–C and O–C
O, C–O–C and O–C![[double bond, length as m-dash]](https://www.rsc.org/images/entities/char_e001.gif) O, respectively. The N 1s spectrum shows two components, pyridinic-N and pyrrolic-N, located around 397.6 eV and 399.5 eV, respectively.
O, respectively. The N 1s spectrum shows two components, pyridinic-N and pyrrolic-N, located around 397.6 eV and 399.5 eV, respectively.
![[double bond, length as m-dash]](https://www.rsc.org/images/entities/char_e001.gif) C, C–O/C
C, C–O/C![[double bond, length as m-dash]](https://www.rsc.org/images/entities/char_e001.gif) N and O–C
N and O–C![[double bond, length as m-dash]](https://www.rsc.org/images/entities/char_e001.gif) O, respectively. The three peaks at 529.4 eV, 531.3 eV and 533 eV in the O 1s spectrum represent C
O, respectively. The three peaks at 529.4 eV, 531.3 eV and 533 eV in the O 1s spectrum represent C![[double bond, length as m-dash]](https://www.rsc.org/images/entities/char_e001.gif) O, C–O–C and O–C
O, C–O–C and O–C![[double bond, length as m-dash]](https://www.rsc.org/images/entities/char_e001.gif) O, respectively. Compared with O 1s in RC, carbon-based oxygen atoms in BAC produce higher binding energy at 533 eV.39 The energy spectrum of N 1s shows that N in BAC mainly exists in the form of pyridinic-N and pyrrolic-N, which are located near 397.6 eV and 399.9 eV, respectively, followed by N–C located near 395.2 eV. The total amount of N and O elements is 11.47%, which is conducive to the hydrophilicity of BAC; BAC has a higher O 1s/C 1s atomic ratio. The results showed that KOH activation enriched the quantity of oxygen-containing functional groups on the surface of the activated carbon, which enhanced the polarity and acidity of the activated carbon surface. This property plays a positive role in promoting the adsorption of cationic dyes.
O, respectively. Compared with O 1s in RC, carbon-based oxygen atoms in BAC produce higher binding energy at 533 eV.39 The energy spectrum of N 1s shows that N in BAC mainly exists in the form of pyridinic-N and pyrrolic-N, which are located near 397.6 eV and 399.9 eV, respectively, followed by N–C located near 395.2 eV. The total amount of N and O elements is 11.47%, which is conducive to the hydrophilicity of BAC; BAC has a higher O 1s/C 1s atomic ratio. The results showed that KOH activation enriched the quantity of oxygen-containing functional groups on the surface of the activated carbon, which enhanced the polarity and acidity of the activated carbon surface. This property plays a positive role in promoting the adsorption of cationic dyes.


