DOI:
10.1039/D2RA08023K
(Paper)
RSC Adv., 2023,
13, 11130-11141
Synthesis, molecular docking, and biological evaluation of [3,2-b]indole fused 18β-glycyrrhetinic acid derivatives against skin melanoma†
Received
16th December 2022
, Accepted 19th March 2023
First published on 11th April 2023
Abstract
Melanoma, the most serious yet uncommon type of cancer, originates in melanocytes. Risk factors include UV radiation, genetic factors, tanning lamps and beds. Here, we described the synthesis and selective anti melanoma activity of [3,2-b]indole fused 18β-glycyrrhetinic acid, a derivative of 18β-glycyrrhetinic acid in murine B16F10 and A375 human melanoma cell lines. Among the 14 molecules, GPD-12 showed significant selective cytotoxic activity against A375 and B16F10 cell lines with IC50 of 13.38 μM and 15.20 μM respectively. GPD 12 induced the formation of reactive oxygen species in A375 cells that could trigger oxidative stress mediated cell death as is evident from the increased expression of apoptosis related proteins such as caspase-9 and caspase-3 and the increased ratio of Bax to Bcl2. The results showed that GPD 12 can be used as an effective therapeutic agent against melanoma.
Introduction
Melanoma originates from the abnormal proliferation of normal melanocytes present in the skin epidermis. The occurrence of melanoma has expanded at an alarming rate in the last few decades particularly in the individuals with less melanin content in their skin.1,2 Although melanoma accounts for 5% of all skin cancers, it is one of the most aggressive and lethal forms of cancer.3 As per the reports of WHO (2017), nearly 2 to 3 million non-melanoma skin cancers and 132![[thin space (1/6-em)]](https://www.rsc.org/images/entities/char_2009.gif) 000 melanoma skin cancers are reported annually worldwide. Although the incidence of melanoma is less than other skin cancer, it is more inclined to invade and metastasize to other parts of the body. The current therapeutic options for the treatment of melanoma cancers include surgery excision (for early detected melanomas), radiation therapy and chemotherapy or a combination of these. However, these treatments most often have serious side effects. Therefore, there is a need to identify the novel selective anti-melanoma molecules with minimal side effects that can be used to treat melanoma skin cancers.4
000 melanoma skin cancers are reported annually worldwide. Although the incidence of melanoma is less than other skin cancer, it is more inclined to invade and metastasize to other parts of the body. The current therapeutic options for the treatment of melanoma cancers include surgery excision (for early detected melanomas), radiation therapy and chemotherapy or a combination of these. However, these treatments most often have serious side effects. Therefore, there is a need to identify the novel selective anti-melanoma molecules with minimal side effects that can be used to treat melanoma skin cancers.4
Treatment of different types of cancer with different terpenoid class of natural products including oleanolic acid, betulinic acid, ursolic acid and glycyrrhetinic acid has become a major focus due to their potent chemotherapeutic activities5 (Fig. 1). Various approaches have been employed to identify components with better anti-cancer potency with fewer side effects. The root and rhizome of Glycyrrhiza glabra (common name, licorice) (Leguminosae) contains glycyrrhizin which has been used as a flavouring agent and traditional medicine for treatment of gastric ulcer, bronchial asthma, and possess antitumor, anti allergic, anti oxidant, anti-inflammatory, antiviral, antimicrobial, antiulcerative, antiproliferative, enzyme inhibitor, hepatoprotective, cardio protective and neuroprotective activities.6 18β-Glycyrrhetinic acid (GA-P) is the aglycone of glycyrrhizin that is naturally present in Glycyrrhiza glabra or can be synthesized by the hydrolysis of glycyrrhizin. Some glycyrrhetinic acid derivatives have been reported for the protection of the skin damage from UV-B by inhibiting ROS generation, endoplasmic reticulum stress through MMP-1 pathway.7 Recently, 18β-glycyrrhetinic acid mediated apoptosis has been reported in A549 lung cancer cells.8 Based on these studies, the authors thought it worthwhile to investigate the anti-melanoma activity of indole fused 18β-glycyrrhetinic acid derivatives. Previously, L. De-la-Cruz-Martínez et al. group in 2021 reported only six indole based derivatives of 18β-glycyrrhetinic acid as PPTB1 inhibitors based on in vitro and in silico approaches.9 A semi-synthetic derivative of 18β-glycyrrhetinic acid (GA-P) 3-O-prenyl glycyrrhetinic acid (NPC-402), was reported by L. A. Nazir, et al. to have selective anti-melanoma property. NPC-402 induced oxidative stress and apoptosis in B16F10 murine melanoma cell line.10 In the present study, we investigated the antimelanoma activity of indole fused 18β-glycyrrhetinic acid derivatives from which GPD-12 was found to have significant effect on cell death of human A375 cell line and B16F10 murine melanoma cell line.
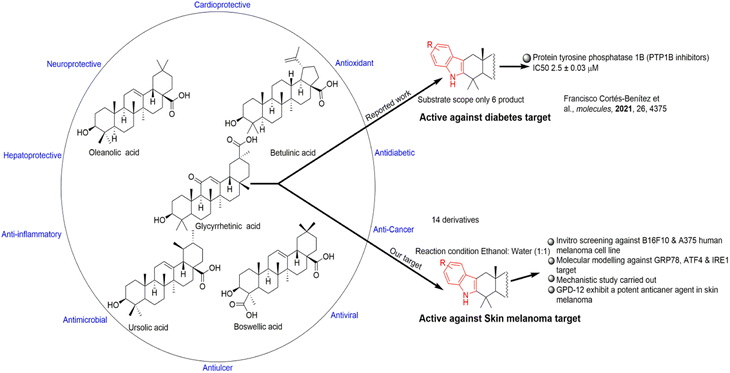 |
| | Fig. 1 Representation of some pentacyclic triterpenoids with their different targets and our study approach. | |
Results and discussion
Chemistry (design and synthesis of [3,2-b]indole fused 18β-glycyrrhetinic acid (GA) derivatives)
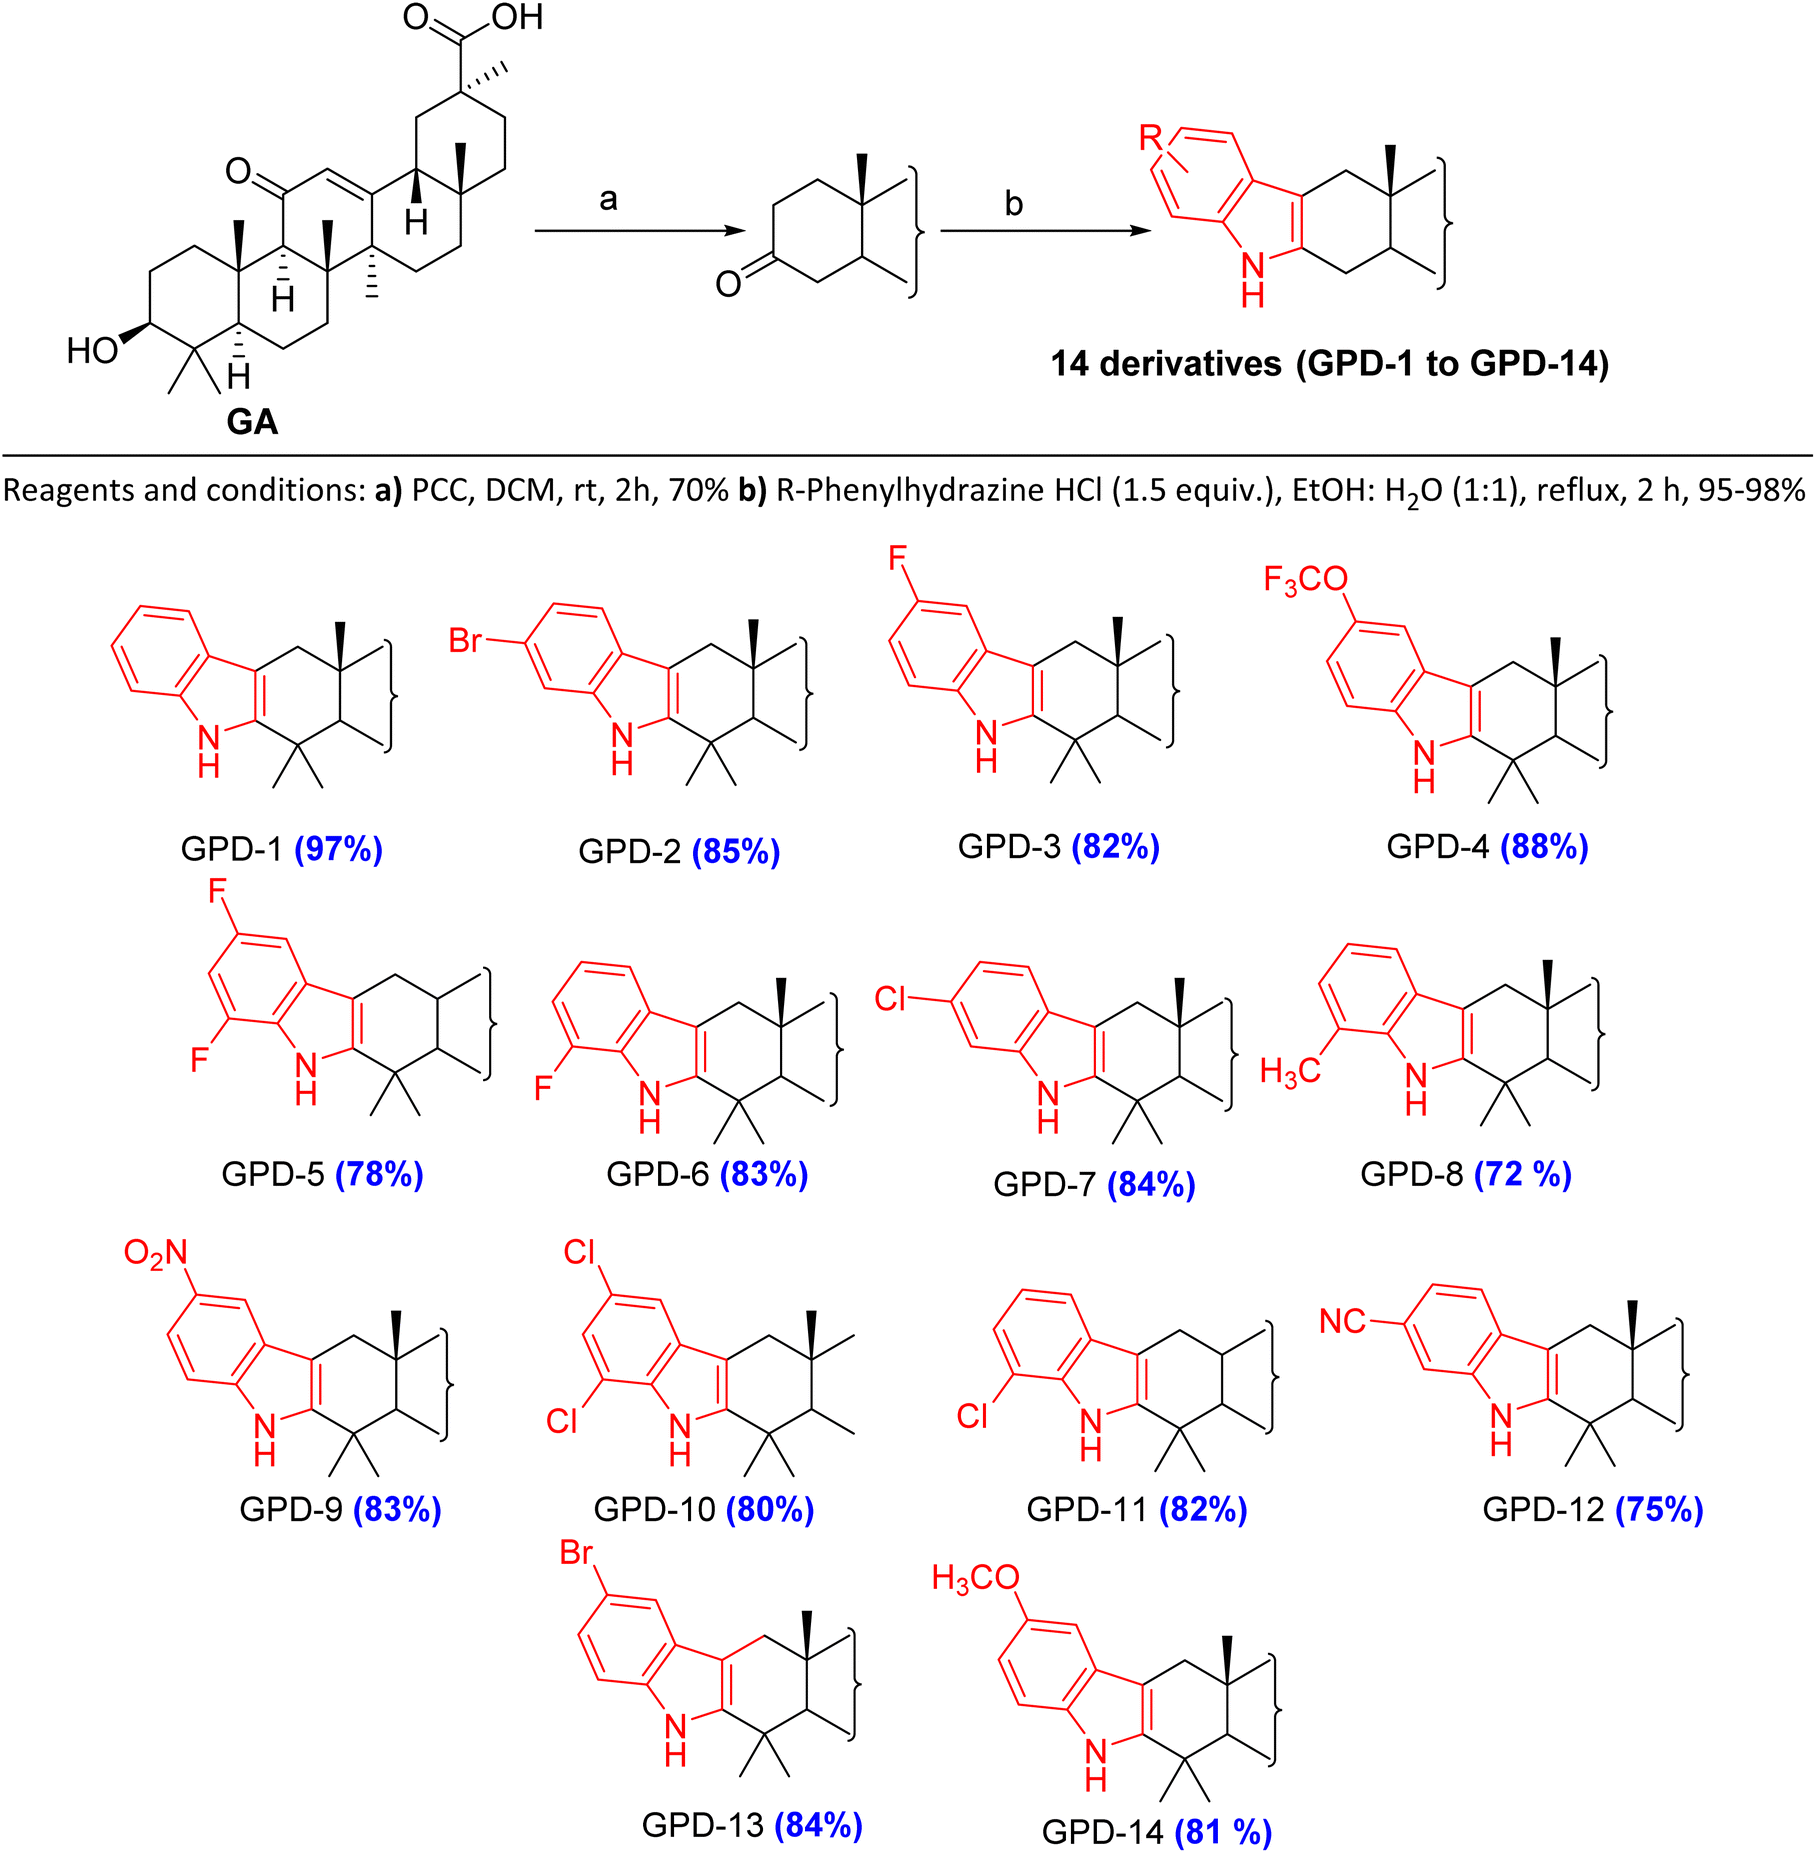
In the present study, GA was isolated from methanolic extract of stem bark of Glycyrrhiza glabra and was taken for further structural modification studies.6 The derivatives (GPD-1 to GPD-14) were synthesized through structural modification at C-2/C-3 position via known reaction Fischer indole synthesis.
The goal behind this synthesis was to study the effect of indole fused 18β-GA against the skin melanoma (A375 cell line). The procedure for the synthesis of indole fused 18β-GA derivatives GPD-1 to GPD-14 involved two steps (Scheme 1). In the first step, GA was oxidized with pyridinium chlorochromate (PCC) in dichloromethane (DCM) to provide GA–O. In second step, GA–O was reacted with different substituted phenylhydrazines hydrochloride to achieve the desired product. Initially, GA–O was reacted with phenylhydrazine and was taken as a model reaction to optimize reaction conditions. For this, we used different solvent such as ethanol, ethanol:water (1:1), and glacial acetic acid (AcOH). The best results were observed in case of ethanol:water. These optimized set of conditions were used for the condensation of various phenylhydrazines hydrochloride with GA–O to provide a series of indole fused 18β-GA GPD-1 to GPD-14. All the reactions were carried out under the presence of N2 at 100–120 °C, reflux for 1–2 h and got excellent yield (70–98%). The characterization of all the newly synthesized derivatives was confirmed by spectroscopic analysis (1H NMR, 13C NMR and HRMS). In 13C NMR, signal at δ 140.04, 128.30, 121.01, 118.93, 118.59, 110.16 & 107.26 and in 1H NMR, a singlet at δ 7.70–7.04 confirmed the product formation of GPD-1 to GPD-14 (see detail ESI†) (Table 1).
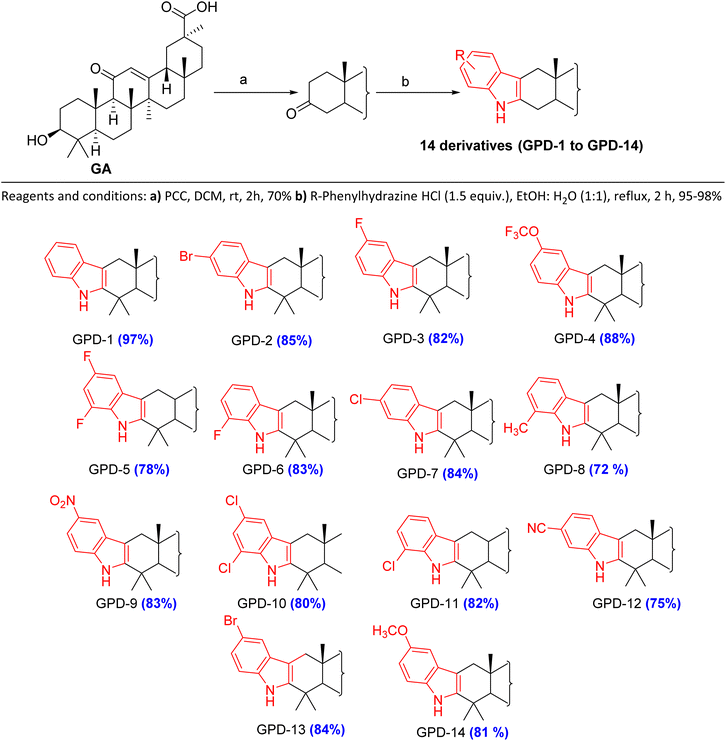 |
| | Scheme 1 Synthesis and substrate scope of 18β-glycyrrhetinic acid derivatives. Reagents and conditions: (a) PCC, DCM, rt, 2 h, 70% (b) R-phenylhydrazine HCL (1.5 equiv.), EtOH:H2O (1:1), reflux, 2 h, 95–98%. | |
Table 1 Optimizations of reaction conditions
| Entry |
Solvents |
Reagent (equiv.) |
Temp. (0 °C) |
Time (h) |
Yield (%) |
| 1 |
AcOH |
PhNHNH2·HCl (1.5) |
80 |
6 |
90–95 |
| 2 |
Ethanol |
PhNHNH2·HCl (1.5) |
80 |
5 |
95 |
| 3 |
Ethanol:water |
PhNHNH2·HCl (1.5) |
80 |
2–3 |
95–98 |
| 4 |
Water |
PhNHNH2·HCl (1.5) |
80 |
6–8 |
50 |
| 5 |
AcOH:water |
PhNHNH2·HCl (1.5) |
80 |
7 h |
80 |
Molecular modelling
To systematically investigate [3,2-b]indole moieties at the C-2 and C-3 position of GA, a docking model was developed for the antimelanoma activity by targeting the GRP78, and IRE1 proteins. Here we used the co-crystal structure of the protein PDB entry: 7A4U and 6G93. All the molecules were docked and screened against the antimelanoma target.
From the in silico drug analysis we found that the most of the compounds showed prominent interactions with GRP78 and IRE1 with good docking score. These molecules also showed better results in in vitro analysis.11,12 For the docking purpose we have used Autodock Vina software and for the interaction analysis we used discovery studio. Docking of the series (GPD-1 to GPD-14) against the different protein has been done through the proper procedure.
From the results we concluded that among all the derivatives GPD-12 has highest interaction with both targeted proteins GRP78 and IRE1 (PDB ID: 7A4U and 6G93) viz. dock score −13.45 kcal mol−1 and −7.56 kcal mol−1 respectively. With GRP78 target (7A4U) GPD-12 interacts with Asp257 & Phe114 via forming pi–cation & pi–pi stacked respectively. With IRE1 target (6G93) GPD-12 interacts with Ile173 via pi–sigma bond interaction (Fig. 2a and b).
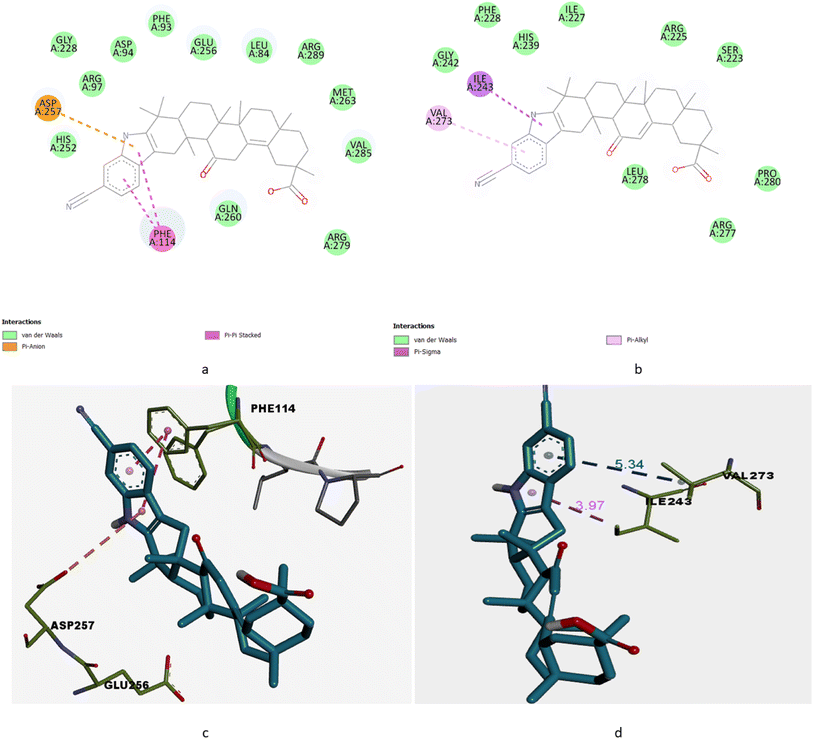 |
| | Fig. 2 (a) 2D interaction of GPD-12 with GRP78 target with PDB id: 7A4U. (b) 2D interaction of GPD-12 with IRE1 target with PDB id: 6G93. (c) 3D interaction of GPD-12 with GRP78 target with PDB id: 7A4U. (d) 3D interaction of GPD-12 with IRE1 target with PDB id: 6G93. | |
On the other hand, some other molecules like GPD-4 (−11.6 kcal mol−1, −7.9 kcal mol−1), GPD-7 (−13.3 kcal mol−1, −7.7 kcal mol−1) & GPD-8 (−12.1 kcal mol−1, −7.5 kcal mol−1) also showed good interactions in in silico approach with GRP78 and IRE1 target compared with GA (parent molecule) (Table 2).
Table 2 Docking score, interactions and residue involved with GRP78 and IRE1
| Compound |
Dock score |
Interactions |
Residue |
| GRP78 |
IRE1 |
GRP78 |
IRE1 |
GRP78 |
IRE1 |
| GA (parent) |
−9.6 |
−6.8 |
van der Waals |
H-bonding |
Phe242, Val241 |
Thr295 |
| GPD-1 |
−11.2 |
−7.8 |
Pi–pi stacked, pi–anion |
Pi–sigma |
Phe114, ASP 257 |
His239 |
| GPD-2 |
−12.4 |
−7.4 |
Pi–pi stacked, pi–anion |
H-bonding |
Phe114, Asp257 |
Ile173 |
| GPD-3 |
−12.4 |
−7.5 |
Pi–pi stacked, pi–anion |
H-bonding, pi–sigma |
Phe114, Asp257 |
His239, Leu278 |
| GPD-4 |
−11.6 |
−7.9 |
Pi–pi stacked, pi–anion |
C–H bonding, alkyl, halogen |
Phe114, Asp257 |
Lys292, Thr295, Lys300 |
| GPD-5 |
−11.8 |
−7.3 |
Pi–pi stacked, pi–anion |
Pi–sigma, alkyl |
Phe114, Asp257 |
Ile173 |
| GPD-6 |
−12.0 |
−7.7 |
Pi–pi stacked |
Pi–sigma, alkyl |
Phe114 |
Ile173 |
| GPD-7 |
−13.3 |
−7.7 |
Pi–pi stacked |
Pi–alkyl |
Phe114 |
Pro274 |
| GPD-8 |
−12.1 |
−7.5 |
Pi–pi stacked |
Pi–anion |
Phe114 |
ASP288 |
| GPD-9 |
−12.0 |
−7.4 |
Pi–pi stacked |
Pi–alkyl |
Ile243 |
Phe114, Asp257 |
| GPD-10 |
−11.4 |
−7.6 |
Pi–pi stacked, pi–alkyl |
Pi–alkyl, pi–sigma |
Ile243, Val273 |
Phe114, His252 |
| GPD-11 |
−11.8 |
−7.4 |
van der Waals |
Pi–pi stacked |
Phe114 |
Tyr113 |
| GPD-12 |
−13.45 |
−7.5 |
Pi–cation, pi–pi stacked |
Pi–sigma |
Phe114, Asp257 |
Ile173, Val243 |
| GPD-13 |
−12.45 |
−7.5 |
Halogen, alkyl |
Pi–sigma |
Phe114 |
Val273 |
| GPD-14 |
−11.43 |
−7.4 |
Pi–pi stacked |
van der Waals |
Phe114 |
Tyr113 |
Biology
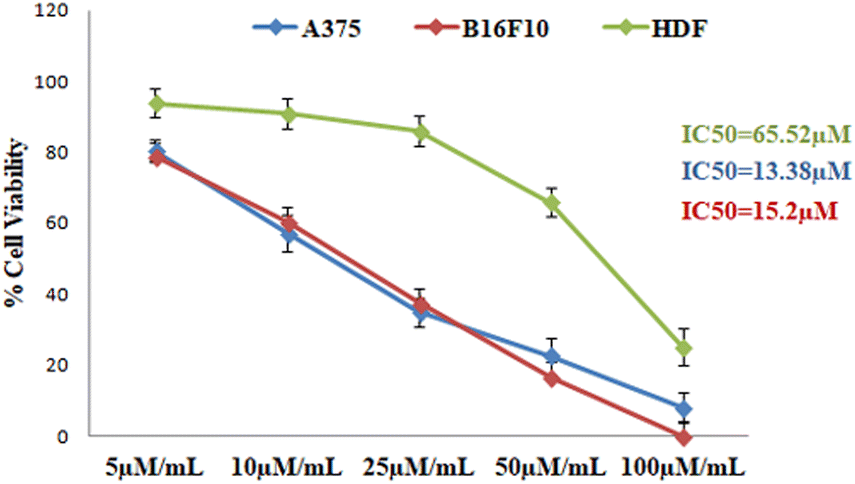
Indole fused 18β-glycyrrhetinic acid induced cytotoxicity in melanoma cell lines. The cytotoxicity potential of series of derivatives of indole fused 18β-glycyrrhetinic acid were analysed by MTT assay in murine melanoma B16F10 and human melanoma A375 cell lines and normal human dermal fibroblasts (HDF). Among all these derivatives GPD-12 showed remarkable selective reduction in the cell viability of both human (Table 3) and mouse melanoma cell lines (Table 4) (with an IC50 of 13.38 μM and 15.2 μM respectively) while being less toxic to normal skin cells (Table 5) (IC50 of 65.52 μM) (Fig. 3).
Table 3 Cell viability analysis of human melanoma A375 cell line treated with different derivatives of indole fused 18β-glycyrrhetinic acid for 24 hours by MTT assay
| S. no. |
Sample code |
Concentrations μM mL−1 |
% cytotoxicity |
| 1 |
GA-P |
5 |
0 |
| 10 |
0 |
| 25 |
0 |
| 50 |
0 |
| 100 |
9.51 ± 1.2 |
| 2 |
GPD-1 |
5 |
0 |
| 10 |
0 |
| 25 |
0 |
| 50 |
0 |
| 100 |
5.37 ± 0.65 |
| 3 |
GPD-2 |
5 |
0 |
| 10 |
7.70 ± 0.42 |
| 25 |
39.62 ± 3.1 |
| 50 |
56.69 ± 3.7 |
| 100 |
73.16 ± 3.02 |
| 4 |
GPD-3 |
5 |
11.73 ± 0.42 |
| 10 |
11.81 ± 0.2 |
| 25 |
20.10 ± 1.31 |
| 50 |
55.71 ± 3.7 |
| 100 |
72.45 ± 4.2 |
| 5 |
GPD-4 |
5 |
13.45 ± 3.75 |
| 10 |
19.73 ± 2.45 |
| 25 |
51.01 ± 3.2 |
| 50 |
66.74 ± 2.9 |
| 100 |
79.53 ± 4.1 |
| 6 |
GPD-5 |
5 |
0 |
| 10 |
0 |
| 25 |
5.94 ± 0.75 |
| 50 |
37.39 ± 2.21 |
| 100 |
59.23 ± 3.2 |
| 7 |
GPD-6 |
5 |
0 |
| 10 |
0 |
| 25 |
14.38 ± 1.45 |
| 50 |
48.26 ± 3.12 |
| 100 |
73.71 ± 3.69 |
| 8 |
GPD-7 |
5 |
0 |
| 10 |
0 |
| 25 |
25.24 ± 0.89 |
| 50 |
64.98 ± 3.65 |
| 100 |
70.49 ± 3.98 |
| 9 |
GPD-8 |
5 |
0 |
| 10 |
0 |
| 25 |
14.70 ± 1.32 |
| 50 |
45.76 ± 2.54 |
| 100 |
75.53 ± 4.2 |
| 10 |
GPD-9 |
5 |
1.57 ± 0.65 |
| 10 |
6.01 ± 0.45 |
| 25 |
2.96 ± 0.48 |
| 50 |
24.83 ± 2.21 |
| 100 |
66.76 ± 3.24 |
| 11 |
GPD-10 |
5 |
0 |
| 10 |
0 |
| 25 |
6.83 ± 1.1 |
| 50 |
35.84 ± 3.2 |
| 100 |
65.12 ± 2.54 |
| 12 |
GPD-11 |
5 |
15.85 ± 1.12 |
| 10 |
21.25 ± 2.41 |
| 25 |
26.18 ± 1.89 |
| 50 |
64.96 ± 3.21 |
| 100 |
75.88 ± 2.54 |
| 13 |
GPD-12 |
5 |
19.98 ± 1.65 |
| 10 |
42.96 ± 3.21 |
| 25 |
65.23 ± 2.9 |
| 50 |
77.38 ± 3.34 |
| 100 |
91.68 ± 5.1 |
| 14 |
GPD-13 |
5 |
0 |
| 10 |
1.57 ± 0.47 |
| 25 |
49.28 ± 1.26 |
| 50 |
61.32 ± 3.62 |
| 100 |
71.97 ± 3.24 |
| 15 |
GPD-14 |
5 |
0 |
| 10 |
0 |
| 25 |
0 |
| 50 |
0 |
| 100 |
0 |
Table 4 Cell viability analysis of murine melanoma B16F10 cell line treated with different derivatives of indole fused 18β-glycyrrhetinic acid for 24 hours by MTT assay
| S. no. |
Sample code |
Concentrations μM mL−1 |
% cytotoxicity |
| 1 |
GA-P |
5 |
0 |
| 10 |
0 |
| 25 |
0 |
| 50 |
0 |
| 100 |
0 |
| 2 |
GPD-1 |
5 |
0 |
| 10 |
0 |
| 25 |
0 |
| 50 |
0 |
| 100 |
0 |
| 3 |
GPD-2 |
5 |
0 |
| 10 |
3.29 ± 0.88 |
| 25 |
14.52 ± 1.75 |
| 50 |
20.75 ± 1.65 |
| 100 |
61 ± 3.24 |
| 4 |
GPD-3 |
5 |
0.23 ± 0.16 |
| 10 |
4.77 ± 0.68 |
| 25 |
12.59 ± 0.56 |
| 50 |
31.52 ± 1.58 |
| 100 |
76.2 ± 3.54 |
| 5 |
GPD-4 |
5 |
7.15 ± 1.32 |
| 10 |
18.15 ± 1.75 |
| 25 |
33.11 ± 2.15 |
| 50 |
39.57 ± 3.2 |
| 100 |
32.02 ± 3.4 |
| 6 |
GPD-5 |
5 |
3.63 ± 0.48 |
| 10 |
4.77 ± 0.68 |
| 25 |
9.3 ± 0.97 |
| 50 |
25.18 ± 1.27 |
| 100 |
31.82 ± 1.68 |
| 7 |
GPD-6 |
5 |
0 |
| 10 |
1.48 ± 0.25 |
| 25 |
11.23 ± 0.36 |
| 50 |
25.18 ± 0.82 |
| 100 |
60.32 ± 3.4 |
| 8 |
GPD-7 |
5 |
0 |
| 10 |
0 |
| 25 |
6.47 ± 0.84 |
| 50 |
14.86 ± 0.95 |
| 100 |
74.72 ± 4.2 |
| 9 |
GPD-8 |
5 |
0 |
| 10 |
3.75 ± 0.46 |
| 25 |
17.81 ± 0.78 |
| 50 |
27.56 ± 1.25 |
| 100 |
82.88 ± 4.2 |
| 10 |
GPD-9 |
5 |
6.06 ± 0.76 |
| 10 |
3.97 ± 0.24 |
| 25 |
6.48 ± 0.75 |
| 50 |
33.9 ± 1.62 |
| 100 |
60.25 ± 3.5 |
| 11 |
GPD-10 |
5 |
9.41 ± 0.79 |
| 10 |
11.92 ± 1.1 |
| 25 |
20.75 ± 1.24 |
| 50 |
35.77 ± 2.9 |
| 100 |
66.94 ± 3.15 |
| 12 |
GPD-11 |
5 |
0 |
| 10 |
4.15 ± 0.54 |
| 25 |
31.79 ± 1.78 |
| 50 |
68.41 ± 3.5 |
| 100 |
81.17 ± 4.5 |
| 13 |
GPD-12 |
5 |
21.34 ± 0.76 |
| 10 |
39.54 ± 1.53 |
| 25 |
62.35 ± 3.2 |
| 50 |
83.35 ± 3.57 |
| 100 |
100 ± 4.2 |
| 14 |
GPD-13 |
5 |
8.16 ± 1.85 |
| 10 |
21.36 ± 1.65 |
| 25 |
37.48 ± 2.47 |
| 50 |
43.69 ± 2.46 |
| 100 |
74.76 ± 3.95 |
| 15 |
GPD-14 |
5 |
0.77 ± 0.12 |
| 10 |
4.85 ± 0.24 |
| 25 |
5.63 ± 0.65 |
| 50 |
8.73 ± 0.95 |
| 100 |
20.58 ± 1.68 |
Table 5 Cell viability analysis of primary human dermal fibroblasts cell line treated with GPD-12 for 24 hours by MTT assay
| Sample code |
Concentrations μM mL−1 |
% cytotoxicity |
| GPD-12 |
5 |
6.24 ± 0.78 |
| 10 |
9.15 ± 1.25 |
| 25 |
13.98 ± 2.4 |
| 50 |
34.11 ± 3.65 |
| 100 |
74.83 ± 3.42 |
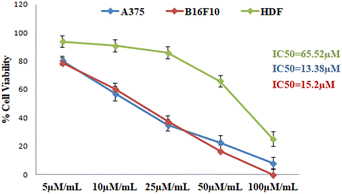 |
| | Fig. 3 Line graph depicting comparative cellular viability of A375, B16F10 and HDF cell line after 24 hours of treatment with GPD-12. IC50 values are enlisted alongside each cell line. | |
GPD-12 induced oxidative stress in A375 cell
Many studies have confirmed that apoptosis is regulated by reactive oxygen species; increase in the levels of ROS can induce apoptosis.13 From the H2DCF-DA florescent imaging, we found that GPD-12 induced the dose dependent increase in ROS in A375 melanoma cells post 6 hours of treatment compared to that of the control cells (Fig. 4a and b). Thus, signifying the induction of oxidative stress in A375 melanoma cells which could lead to cell death by apoptosis.
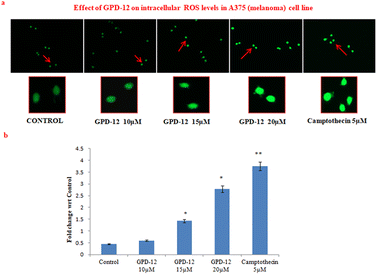 |
| | Fig. 4 (a) ROS formation in A375 cell line after 24 hours of treatment with GPD-12 using H2DCF-DA dye by fluorescence microscopy. (b) Bar graph depicting fold change in A375 cell line subjected to different concentrations of GPD-12 with respect to control. | |
GPD-12 treatment led to depletion in number of colonies in dose dependent manner
Melanoma cells tend to form colonies owing to their high proliferation rate. This experiment was designed to study the antiproliferative potential of GPD-12. A375 cells were seeded in 6- well plate at density of 1000 cells/well and treated with different concentrations of GPD-12 for 24 hours. Cells were further cultured for 7 days and then stained with crystal violet dye. Colonies with more than 50 cells were counted using Image J software. The results suggested that the A375 colonies decreased gradually with the increase in the concentration of GPD-12 compared to that of the control (Fig. 5a and b).
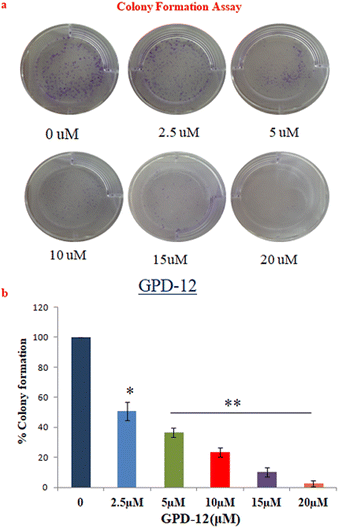 |
| | Fig. 5 (a) Colony formation assay of A375 cell line treated with different concentrations of GPD-12 using crystal violet dye for 24 hours after which they were cultured for 7 consecutive days. (b) Bar graph showing % colony formation in GPD-12 treated A375 cell line with different concentrations for 24 hours. *p < 0.05, **p < 0.01 control vs. GPD-12 treated groups. | |
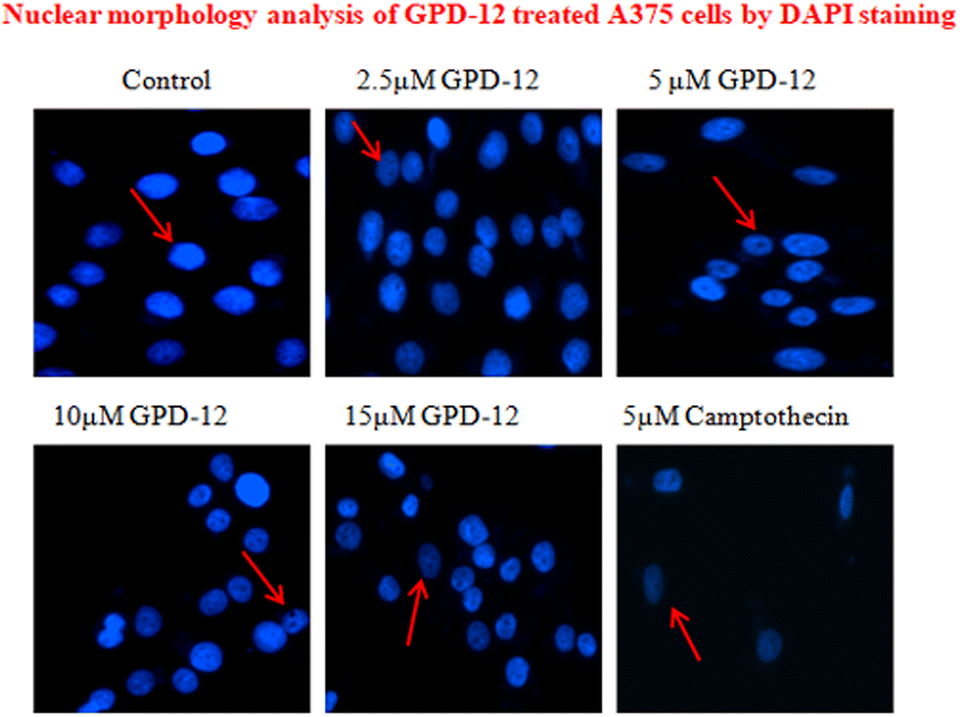
GPD-12 induced nuclear fragmentation in A375 cell line
ROS generation in cancer cells induces Endoplasmic Reticulum (ER stress) along with UPR which leads to oxidative damage that ultimately leads to apoptosis of cell thereby changing nuclear morphology.10 A375 cells were seeded in 6 well plates (104 cells per well). After 24 hours, cells were subjected to treatment with different concentrations of GPD-12. Treatment was terminated after 24 hours. Cells were fixed with 4% para formaldehyde, permeabilized with 0.1% Triton X and stained with DAPI for 15 minutes. The DAPI staining results revealed that GPD 12 induced nuclear fragmentation when compared to that of control cells (Fig. 6). Pits and grooves were seen in GPD-12 treated cells as compared to the control group (arrows pointed at the cells). These results indicate that GPD-12 targets the nucleus and damages the DNA of melanoma cells. The DAPI stained cells were visualized under fluorescent microscope.
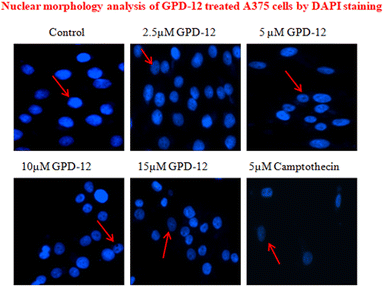 |
| | Fig. 6 Nuclear morphology analysis of A375 cell line treated with different concentrations of GPD-12 (as shown) for 24 hours by DAPI staining using fluorescence microscopy. Camptothecin, a topoisomerase inhibitor, is used as positive control. | |
GPD-12 induces caspase dependent apoptosis in A375 melanoma cells
Oxidative stress leads to depolarization of mitochondrial membrane potential and activation of caspases, finally driving cells towards apoptosis.13 It has been reported that 18β-Gly induce apoptosis by regulating the PI3K/Akt and NF-κB signaling pathways in prostate carcinoma cells.14 Another study demonstrated that 18β-Gly induced apoptosis via the Akt/FOXO3a/Bim signaling pathway in breast cancer MCF-7 cells.15
Here we studied the effect of GPD-12 on apoptosis related proteins by western blotting in A375 cells. The results suggested that GPD-12 dose dependently increased the expression of caspase 3 and caspase 9 post 24 hours of treatment (Fig. 7b). Furthermore, GPD-12 down regulated the expression levels of anti-apoptotic protein Bcl-2 and increased the expression of proapoptotic protein Bax in dose dependent manner (Fig. 7c). These results suggest that GPD 12 induces apoptosis in caspase dependent manner in A375 melanoma cells.
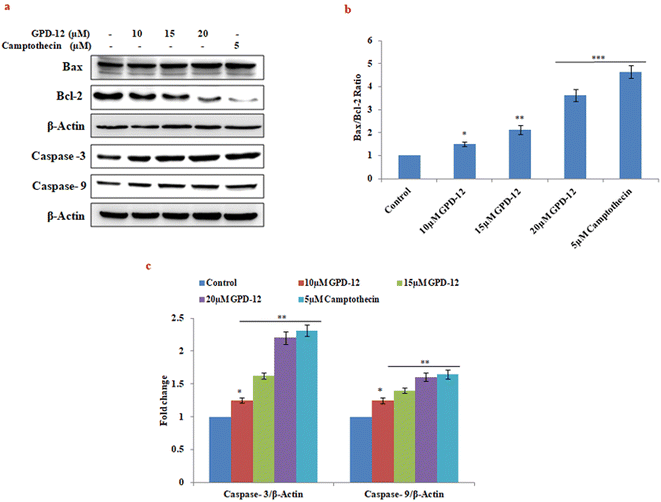 |
| | Fig. 7 (a) Western blot representing band intensities of proteins Bax, Bcl-2, caspase-3 and caspase-9 in A375 cell line subjected to 24 hours of treatment with different concentrations of GPD-12. (b) Bar graph depicting band densitometry of fold change of proapoptotic protein Bax and antiapoptotic protein Bcl-2 in GPD-12 treated A375 cell line for 24 hours using Image Lab™ Software Version 3.0 (Bio-Rad). *p < 0.05, **p < 0.01, ***p < 0.001. (c) Bar graph depicting band densitometry of fold change of proteins caspase-3 and caspase-9 in GPD-12 treated A375 cell line for 24 hours using Image Lab™ Software Version 3.0 (Bio-Rad). *p < 0.05, **p < 0.01. | |
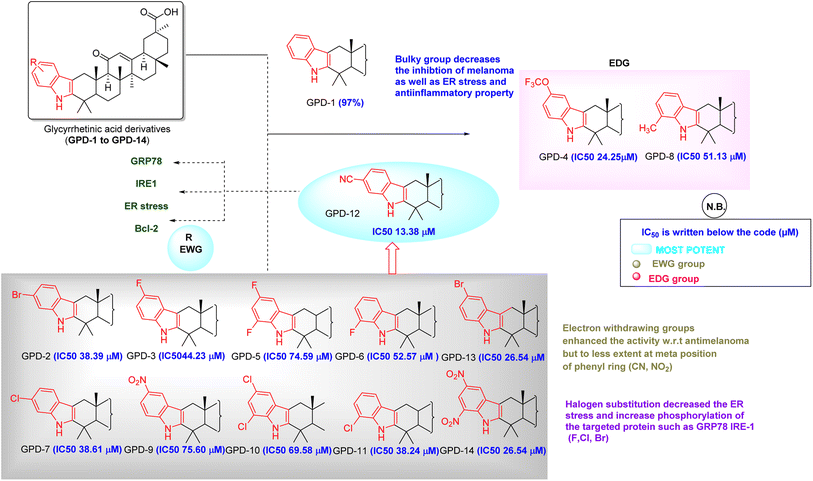
Structural activity relationship
We have synthesized 14 derivatives of GA which were isolated from the medicinal and nutritional plant Glycyrrhiza glabra with substituted phenylhydrazines by employing the Fischer indole synthesis. All the synthesized molecules were screened against B16F10 and A375 melanoma cells and IC50 values were calculated. Then percentage cytotoxicity and cell viability were calculated for each compound. Along with this we have also seen the in silico approach for the drug receptor interactions. From the analysis report (Table 2) GPD-12 was found to be most potent relevant to suppress the skin melanoma, normal epithelial cell toxicity and followed the phosphorylation of the protein such as GRP78 and IRE1. Our aim was to screen our library to find a best one which can be used against skin melanoma. Based on these values (Tables 3 and 4) we have attempted a structure–activity relationship study by a keen analysis of all the synthesized substituted AG (GPD-1 to GPD-14). Our most potent molecule according to the study was GPD-12 (IC50 value 13.38 μM in A375 human melanoma cell line) which also showed the highest binding affinity to the target proteins GRP78, IRE-1. In GPD-12, the substitution was carried with 4-CN phenylhydrazines to cyclize and form the desired product (Fig. 8).
 |
| | Fig. 8 SARs study of GPD series against the skin melanoma target. | |
GPD-12 bears the highly EWG (CN) which forms the higher binding to the receptor via forming the pi–pi anionic, pi–pi stacked and H-bonding interactions. But for the compound GPD-4 (IC50 24.25 μM) and GPD-8 (IC50 51.13 μM) bearing the EDG did not show the prominent results. As an affirmation, we have taken EWG containing halogen atoms like F, Cl, Br and the results were good in terms of EDG (OCF3, CH3 etc.). Compounds (GPD-2, GPD-3, GPD-5, GPD-6, GPD-7, GPD-10, GPD-11, GPD-12 & GPD-13) when compared with the EDG bearing compounds (GPD-4 & GPD-8), the % age of cell death was not remarkable in case of EDG bearing compound. Hence when we compared these above-mentioned derivatives on B16F10 and A375 human melanoma cell lines, we concluded that GPD-12 have EWG group which enhances the antimelanoma property. The least potent derivative found, based on the cell death analysis was GPD-4 which may be due to EDG substitution. Normal cell toxicity is a major concern for predicting the potency. Least cytotoxic molecule towards normal cells observed was GPD-12 (IC50 value > 50 μM). From the structure–activity relationship, it was concluded that GPD-12 which was least toxic to normal cell, destruct the cancerous cells at IC50 value of 13.38 μM in human melanoma cell line and is most potent compound in our research.
Experimental section
Chemistry
All the required chemicals, reagents and solvents for modification were purchased from Sigma-Aldrich. Reactions were monitored through TLC on silica gel 60 F254 plates (E. Merck) by using ceric ammonium sulphate solution as spraying reagent for detection of spots. Purification of all synthesized derivatives was done through column chromatography using silica gel 60–120 mesh as stationary phase.
Isolation of 18β-glycyrrhetinic acid (A01)
GA was isolated in bulk quantity from MeOH extract of stem bark of Glycyrrhiza glabra and characterized by spectroscopic techniques as reported previously.6,7
GA–O. To a solution of compound GA (5 g, 11 mmol) in DCM was added PCC (3.54 g, 16 mmol) dissolved in DCM dropwise till dark colour appears and kept it at RT for 2 h. After completion, reaction mixture was passed through Celite and filtrate was concentrated at rota vapour. Purification was done through column chromatography with EtOAc:hexane (1:13) as the eluent to afford product 7 colourless solid (3.5 g, 70% yield).
GPD-1. 1H NMR (400 MHz, CDCl3) δ 7.70 (s, 1H), 7.51 (d, J = 7.5 Hz, 1H), 7.29 (d, J = 7.8 Hz, 1H), 7.10 (dd, J = 11.0, 4.0 Hz, 1H),7.06 (t, J = 6.9 Hz, 1H), 5.82 (s, 1H), 3.96 (d, J = 15.6 Hz, 1H), 2.68 (s, 1H),2.26 (d, J = 15.4 Hz, 2H), 2.13–2.05 (m, 2H), 2.03 (d, J = 14.3 Hz, 2H), 1.95 (d, J = 16.4 Hz, 1H), 1.87 (dd, J = 21.4, 11.6 Hz, 1H), 1.78 (d, J = 9.2 Hz, 1H), 1.69 (d, J = 13.5 Hz, 2H), 1.62 (d, J = 15.0 Hz, 1H), 1.53 (d, J = 12.4 Hz, 2H),1.46 (d, J = 12.4 Hz, 2H), 1.43 (s, 3H), 1.32 (s, 3H), 1.25 (s, 6H), 1.23 (s, 3H), 1.19 (s, 3H), 1.07 (d, J = 13.5 Hz, 2H), 0.89 (s, 3H). 13C NMR (101 MHz, CDCl3) δ 199.35, 181.31, 169.12, 140.04, 136.22, 128.86, 128.30, 121.01, 118.93, 118.59, 110.16, 107.26, 60.55, 53.04, 48.21, 45.44, 43.82, 43.37, 41.02, 38.06, 37.77, 37.59, 34.05, 32.13, 31.97, 31.07, 30.97, 28.62, 28.45, 26.60, 26.52, 23.50, 23.34, 18.56, 18.37, 16.04. HRMS (ESI+): C36H48NO3 m/z calcd for (M + H) +542.3634, found (M + H) +542.3634.
GPD-2. 1H NMR (400 MHz, CDCl3) δ 7.42 (s, 1H), 7.35–7.28 (m, 1H), 7.23–7.16 (m, 1H), 7.16–7.11 (m, 1H), 6.90 (d, J = 7.9 Hz, 1H), 5.78 (s, 1H), 3.89 (d, J = 15.6 Hz, 1H), 2.67 (d, J = 7.4 Hz, 1H), 2.23 (d, J = 15.8 Hz, 2H), 2.03 (d, J = 14.2 Hz, 2H), 1.95 (d, J = 18.1 Hz, 2H), 1.76 (d, J = 12.6 Hz, 2H), 1.68–1.59 (m, 4H), 1.53 (d, J = 14.3 Hz, 1H), 1.42 (s, 3H), 1.39–1.36 (m, 2H), 1.31 (s, 3H), 1.26 (s, 3H), 1.24 (s, 3H), 1.21 (s, 3H), 1.16 (s, 3H), 1.07 (d, J = 9.3 Hz, 2H), 0.86 (s, 3H). 13C NMR (101 MHz, CDCl3) δ 200.37, 179.68, 170.19, 136.99, 128.54, 127.06, 122.93, 121.80, 119.52, 114.12, 113.16, 106.97, 60.47, 52.89, 49.75, 49.54, 49.32, 48.29, 45.42, 43.72, 43.38, 41.16, 37.99, 37.73, 37.40, 34.07, 31.89, 31.01, 30.81, 28.58, 28.43, 26.57, 23.25, 18.30, 15.95, 14.09. HRMS (ESI+): C36H46BrNO3 m/z calcd for (M − H) 618.2587, found (M − H) 618.2583.
GPD-3. 1H NMR (400 MHz, CDCl3) δ 7.72 (s, 1H), 7.16 (ddd, J = 12.2, 9.2, 3.4 Hz, 2H), 6.84 (td, J = 9.2, 2.5 Hz, 1H), 5.82 (s, 1H), 3.88 (d, J = 15.5 Hz, 1H), 2.23 (d, J = 15.6 Hz, 2H), 2.04 (dd, J = 18.1, 9.2 Hz, 3H), 1.97–1.89 (m, 2H), 1.84–1.75 (m, 2H), 1.68 (d, J = 13.5 Hz, 2H), 1.63 (s, 1H), 1.53 (d, J = 9.8 Hz, 2H), 1.42 (s, 3H), 1.39–1.35 (m, 2H), 1.32 (s, 3H), 1.25 (d, J = 2.0 Hz, 6H), 1.22 (s, 3H), 1.18 (s, 3H), 1.08–1.02 (m, 2H), 0.88 (s, 3H). 13C NMR (101 MHz, CDCl3) δ 199.95, 181.83, 181.41, 169.39, 142.16, 132.63, 128.80, 110.60, 110.51, 109.05, 108.78, 107.60, 60.45, 52.92, 48.19, 45.42, 43.83, 43.36, 40.98, 38.01, 37.75, 37.50, 34.16, 32.05, 31.93, 31.05, 30.96, 28.62, 28.47, 26.58, 26.48, 23.53, 23.33, 18.53, 18.35, 16.02. HRMS (ESI+): C36H47FNO3 m/z calcd for (M + H) +560.3540, found (M + H) +560.3547.
GPD-4. 1H NMR (400 MHz, CDCl3) δ 7.28 (d, J = 4.4 Hz, 2H), 7.21 (d, J = 8.7 Hz, 1H), 6.91 (d, J = 8.6 Hz, 1H), 5.73 (s, 1H), 3.84 (d, J = 15.5 Hz, 1H), 2.64 (s, 1H), 2.21 (d, J = 15.3 Hz, 2H), 2.03 (td, J = 13.4, 3.9 Hz, 1H), 1.98–1.84 (m, 3H), 1.75 (t, J = 12.8 Hz, 2H), 1.62 (d, J = 13.6 Hz, 3H), 1.54–1.44 (m, 2H), 1.39 (s, 3H), 1.37–1.32 (m, 1H), 1.29 (s, 3H), 1.25 (s, 1H), 1.22 (s, 3H), 1.18 (s, 3H), 1.16 (s, 3H), 1.14 (s, 3H), 1.05 (dd, J = 23.8, 11.6 Hz, 2H), 0.82 (s, 3H). 13C NMR (101 MHz, CDCl3) δ 200.66, 179.34, 170.69, 142.62, 142.30, 134.55, 128.34, 128.16, 122.09, 114.38, 110.66, 110.58, 107.02, 60.45, 52.92, 48.32, 45.42, 43.68, 43.38, 41.19, 37.95, 37.69, 37.40, 34.14, 31.97, 31.84, 30.98, 30.71, 28.52, 28.37, 26.53, 26.38, 23.17, 18.42, 18.24, 15.91. HRMS (ESI+): C37H46F3NO4 m/z calcd for (M + H) +626.3464, found (M + H) +626.3457.
GPD-5. 1H NMR (400 MHz, CDCl3) δ 6.83 (dd, J = 20.7, 8.4 Hz, 1H), 6.57 (t, J = 10.3 Hz, 1H), 5.70 (d, J = 28.3 Hz, 1H), 3.79 (d, J = 15.5 Hz, 1H), 2.58 (s, 1H), 2.21 (t, J = 52.7 Hz, 4H), 1.93 (dd, J = 29.3, 11.7 Hz, 4H), 1.56 (dd, J = 25.5, 12.7 Hz, 5H), 1.35 (s, 3H), 1.31 (s, 3H), 1.26 (s, 4H), 1.18 (s, 9H), 1.14 (s, 3H), 1.09 (s, 3H), 0.78 (d, J = 9.5 Hz, 3H). 13C NMR (101 MHz, CDCl3) δ 200.00, 176.27, 150.68, 128.34, 122.37, 114.10, 104.46, 103.27, 77.36, 77.05, 76.73, 60.38, 55.37, 52.87, 48.26, 48.21, 47.45, 45.29, 43.37, 41.08, 39.74, 36.69, 34.23, 31.94, 30.98, 29.72, 28.53, 26.39, 23.50, 23.32, 21.43, 18.52, 18.32, 16.00, 14.16, 13.65. HRMS (ESI+): C36H45F2NO3 m/z calcd for (M + H) +578.346, found (M + H) +578.3447.
GPD-6. 1H NMR (400 MHz, CDCl3) δ 7.37 (d, J = 12.4 Hz, 1H), 7.23 (d, J = 7.5 Hz, 1H), 6.94 (dd, J = 7.6, 4.7 Hz, 1H), 6.81 (d, J = 7.8 Hz, 1H), 5.76 (s, 1H), 3.90 (d, J = 15.3 Hz, 1H), 3.40 (d, J = 13.3 Hz, 1H), 2.69 (s, 1H), 2.26 (d, J = 14.9 Hz, 2H), 2.17–1.87 (m, 4H), 1.84–1.60 (m, 5H), 1.55 (d, J = 11.7 Hz, 2H), 1.44 (s, 6H), 1.36 (s, 3H), 1.28 (s, 3H), 1.23 (s, 3H), 1.20 (s, 3H), 1.18 (s, 2H), 1.13–1.02 (m, 2H), 0.87 (s, 3H). 13C NMR (101 MHz, CDCl3) δ 199.90, 180.86, 169.31, 148.07, 140.97, 128.82, 123.98, 119.15, 119.09, 114.36, 108.15, 106.20, 60.48, 52.98, 48.21, 45.42, 43.80, 43.37, 41.03, 38.05, 37.76, 37.68, 34.14, 32.07, 31.93, 31.04, 30.98, 29.26, 28.61, 28.43, 26.59, 26.49, 23.49, 23.33, 18.53, 18.35, 16.01. HRMS (ESI+): C36H46FNO3 m/z calcd for 559.3462 found (M − H) 558.3383.
GPD-7. 1H NMR (400 MHz, CDCl3) δ 7.38 (d, J = 8.4 Hz, 1H), 7.27 (d, J = 1.8 Hz, 1H), 7.04–6.94 (m, 1H), 5.78 (s, 1H), 3.90 (d, J = 15.6 Hz, 1H), 2.66 (s, 2H), 2.24 (dd, J = 14.5, 6.7 Hz, 4H), 2.08–1.99 (m, 2H), 1.99–1.91 (m, 2H), 1.87 (dd, J = 13.5, 4.2 Hz, 1H), 1.80–1.74 (m, 1H), 1.66 (d, J = 13.4 Hz, 2H), 1.63–1.53 (m, 3H), 1.49 (d, J = 17.1 Hz, 1H), 1.42 (s, 3H), 1.31 (s, 3H), 1.25 (s, 3H), 1.24 (s, 2H), 1.21 (d, J = 1.8 Hz, 6H), 1.16 (s, 3H), 0.86 (s, 3H). 13C NMR (101 MHz, CDCl3) δ 200.32, 179.66, 170.09, 141.00, 136.62, 128.58, 126.57, 119.34, 119.18, 110.21, 107.09, 107.04, 60.46, 52.87, 48.28, 45.42, 43.74, 43.38, 41.15, 37.99, 37.75, 37.41, 34.09, 32.03, 31.91, 31.02, 30.89, 29.71, 28.60, 28.46, 26.58, 26.45, 23.27, 18.48, 18.32, 16.00. HRMS (ESI+): C36H47F3ClNO3 m/z calcd for (M + H) +576.3244, found (M + H) +576.3246.
GPD-8. 1H NMR (400 MHz, CDCl3) δ 7.57 (s, 1H), 7.37 (d, J = 7.7 Hz, 1H), 7.04–6.90 (m, 3H), 5.81 (s, 1H), 3.94 (d, J = 15.6 Hz, 1H), 3.38 (s, 1H), 2.67 (s, 2H), 2.48 (s, 3H), 2.24 (d, J = 3.6 Hz, 2H), 2.18 (s, 1H), 2.10 (d, J = 6.8 Hz, 1H), 2.05 (s, 2H), 1.96 (s, 2H), 1.88 (d, J = 13.2 Hz, 3H), 1.77 (d, J = 11.7 Hz, 2H), 1.66 (s, 2H), 1.52 (d, J = 5.8 Hz, 2H), 1.43 (s, 7H), 1.34 (s, 4H), 1.27 (s, 4H), 1.24 (s, 4H), 1.22 (s, 5H), 1.19 (s, 5H), 0.88 (s, 3H). 13C NMR (101 MHz, CDCl3) δ 200.02, 181.04, 169.24, 149.01, 148.91, 146.42, 135.61, 128.85, 127.78, 119.26, 119.17, 116.36, 60.54, 53.07, 48.17, 45.43, 43.80, 43.36, 38.03, 37.72, 34.09, 32.11, 31.93, 31.11, 30.98, 28.62, 28.47, 26.58, 26.49, 23.55, 23.35, 23.23, 20.55, 18.56, 18.36, 16.78, 16.04. HRMS (ESI+): C36H47F3ClNO3 m/z calcd for (M + H) +556.3791, found (M + H) +556.3785.
GPD-9. 1H NMR (400 MHz, MeOD) δ 8.38 (s, 1H), 8.20 (d, J = 8.9 Hz, 1H), 7.98 (d, J = 8.9 Hz, 1H), 7.80 (d, J = 8.6 Hz, 1H), 7.34 (d, J = 9.0 Hz, 1H), 3.94 (d, J = 15.7 Hz, 1H), 3.34 (d, J = 1.5 Hz, 1H), 2.94–2.85 (m, 1H), 2.75 (s, 1H), 2.62 (dd, J = 15.9, 9.6 Hz, 1H), 2.55 (s, 1H), 2.42 (dd, J = 13.2, 8.4 Hz, 1H), 2.26 (s, 1H), 2.20 (s, 1H), 2.10 (t, J = 12.6 Hz, 1H), 1.91 (d, J = 13.2 Hz, 2H), 1.68 (d, J = 14.0 Hz, 1H), 1.61 (d, J = 13.0 Hz, 2H), 1.48 (s, 2H), 1.43 (s, 4H), 1.26 (s, 4H), 1.19 (s, 5H), 1.12 (s, 3H), 1.09 (s, 3H), 0.86 (s, 3H). 13C NMR (101 MHz, MeOD) δ 200.01, 178.81, 171.40, 144.15, 139.76, 139.65, 127.21, 126.87, 124.11, 60.44, 59.85, 54.43, 52.40, 44.88, 44.72, 43.10, 42.86, 40.58, 39.04, 37.34, 37.10, 36.03, 33.66, 33.44, 31.29, 31.18, 30.29, 27.75, 27.44, 25.85, 25.62, 22.42, 20.33, 18.11, 17.58, 14.92. HRMS (ESI+): C36H46N2O5 m/z calcd for (M + H) +587.3485, found (M + H) +587.3484.
GPD-10. 1H NMR (400 MHz, CDCl3:MEOD) δ 7.53 (s, 1H), 7.30 (s, 1H), 7.05 (s, 1H), 5.76 (s, 1H), 3.82 (d, J = 15.3 Hz, 1H), 3.35 (s, 2H), 2.70 (s, 1H), 2.25 (t, J = 15.3 Hz, 3H), 2.11 (t, J = 11.8 Hz, 3H), 2.03–1.91 (m, 3H), 1.77 (dd, J = 27.9, 15.3 Hz, 3H), 1.63 (dd, J = 25.5, 12.3 Hz, 2H), 1.46 (s, 3H), 1.42 (s, 3H), 1.39 (s, 1H), 1.31 (s, 3H), 1.27 (s, 3H), 1.23 (s, 3H), 1.21 (s, 3H), 1.16 (s, 3H), 1.08 (d, J = 14.2 Hz, 1H), 0.88 (s, 3H). 13C NMR (101 MHz, CDCl3:MEOD) δ 204.94, 183.26, 175.42, 147.57, 136.07, 135.04, 134.13, 132.08, 127.67, 123.76, 120.05, 111.17, 64.39, 57.10, 49.37, 47.61, 47.39, 45.17, 41.82, 41.63, 41.40, 38.27, 35.86, 35.74, 34.87, 34.06, 33.47, 32.34, 32.10, 30.43, 30.25, 27.01, 26.46, 22.32, 22.04, 19.62. HRMS (ESI+): C36H45Cl2NO3 m/z calcd for (M − H)+ 608.2698, found (M − H)+ −608.2701.
GPD-11. 1H NMR (400 MHz, CDCl3) δ 7.86 (s, 1H), 7.40 (d, J = 7.7 Hz, 1H), 7.11 (dd, J = 7.6, 0.8 Hz, 1H), 7.00 (t, J = 7.7 Hz, 1H), 5.82 (s, 1H), 3.94 (d, J = 15.6 Hz, 1H), 2.67 (s, 1H), 2.26 (d, J = 15.7 Hz, 2H), 2.14–1.98 (m, 2H), 1.98–1.85 (m, 2H), 1.84–1.72 (m, 2H), 1.69 (d, J = 13.5 Hz, 3H), 1.62 (d, J = 12.9 Hz, 2H), 1.54 (d, J = 12.6 Hz, 2H), 1.46 (d, J = 9.1 Hz, 2H), 1.43 (s, 3H), 1.42–1.37 (m, 1H), 1.35 (s, 3H), 1.29 (s, 3H), 1.25 (s, 3H), 1.23 (s, 3H), 1.18 (s, 3H), 1.07 (d, J = 13.4 Hz, 1H), 0.88 (s, 3H). 13C NMR (101 MHz, CDCl3) δ 200.03, 181.50, 169.50, 141.00, 133.29, 129.79, 128.78, 120.44, 119.76, 117.21, 115.74, 108.46, 60.46, 52.95, 48.20, 45.43, 43.84, 43.37, 40.98, 38.00, 37.76, 37.63, 34.15, 32.04, 31.93, 31.03, 30.94, 28.63, 28.49, 26.58, 26.46, 23.48, 23.35, 18.52, 18.34, 16.02. HRMS (ESI+): C36H46ClNO3m/z calcd for (M + H) +576.3244, found (M + H) +576.7248.
GPD-12. 1H NMR (400 MHz, MEOD:CDCl3) δ 7.81 (d, J = 2.8 Hz, 1H), 7.39 (ddd, J = 23.4, 15.3, 8.6 Hz, 3H), 5.79 (s, 1H), 3.91 (d, J = 15.7 Hz, 1H), 3.37 (s, 1H), 2.73 (s, 1H), 2.28 (d, J = 14.0 Hz, 2H), 2.22 (s, 3H), 2.21 (d, J = 0.6 Hz, 2H), 2.20 (s, 1H), 2.09 (d, J = 19.5 Hz, 1H), 1.97 (d, J = 14.0 Hz, 3H), 1.66 (dd, J = 27.9, 22.1 Hz, 4H), 1.46 (s, 3H), 1.43 (s, 1H), 1.36 (s, 3H), 1.29 (d, J = 7.6 Hz, 6H), 1.23 (s, 2H), 1.18 (s, 3H), 1.13 (d, J = 5.0 Hz, 1H), 1.10 (d, J = 5.2 Hz, 2H), 0.89 (d, J = 5.1 Hz, 3H). 13C NMR (101 MHz, MEOD:CDCl3) δ 204.79, 183.30, 147.44, 132.13, 131.79, 127.43, 127.36, 125.49, 123.42, 115.13, 110.93, 104.02, 64.34, 56.86, 49.38, 47.62, 47.37, 45.14, 41.85, 41.61, 41.14, 38.08, 35.86, 35.77, 34.86, 34.59, 34.27, 33.53, 32.41, 32.21, 30.26, 27.08, 26.69, 22.33, 22.11, 19.73, 17.83. C37H47N2O3 m/z calcd for (M + H) +567.3587, found (M + H) +567.3584.
GPD-13. 1H NMR (400 MHz, CDCl3) δ 7.58 (s, 1H), 7.33 (d, J = 3.4 Hz, 1H), 7.16 (d, J = 1.7 Hz, 2H), 5.76 (s, 1H), 3.85 (d, J = 15.5 Hz, 1H), 3.41–3.33 (m, 1H), 2.67 (s, 1H), 2.23 (t, J = 11.8 Hz, 2H), 2.12–1.82 (m, 5H), 1.80–1.49 (m, 6H), 1.43 (s, 3H), 1.40–1.36 (m, 1H), 1.32 (s, 3H), 1.29 (s, 1H), 1.25 (s, 3H), 1.21 (d, J = 5.2 Hz, 6H), 1.15 (s, 3H), 1.06 (d, J = 13.8 Hz, 1H), 0.86 (s, 3H). 13C NMR (101 MHz, CDCl3) δ 200.03, 181.50, 169.50, 141.00, 133.29, 129.79, 128.78, 120.44, 119.76, 117.21, 115.74, 108.46, 60.46, 52.95, 48.20, 45.43, 43.84, 43.37, 40.98, 38.00, 37.76, 37.63, 34.15, 32.04, 31.93, 31.03, 30.94, 28.63, 28.49, 26.58, 26.46, 23.48, 23.35, 18.52, 18.34, 16.02. C36H47BrNO3 m/z calcd for (M + H) +620.2739, found (M + H) +620.2733.
GPD-14. 1H NMR (400 MHz, CDCl3) δ 6.88–6.82 (m, 1H), 6.64 (d, J = 8.3 Hz, 1H), 6.56 (d, J = 7.9 Hz, 1H), 5.31 (s, 1H), 3.73 (d, J = 5.3 Hz, 3H), 3.69 (d, J = 8.7 Hz, 2H), 3.63 (s, 2H), 2.61 (d, J = 15.6 Hz, 2H), 2.34 (d, J = 7.7 Hz, 2H), 2.28–2.02 (m, 2H), 1.95 (t, J = 8.1 Hz, 2H), 1.84–1.61 (m, 2H), 1.53 (d, J = 10.9 Hz, 2H), 1.42 (d, J = 11.6 Hz, 3H), 1.32 (s, 3H), 1.27 (d, J = 7.3 Hz, 3H), 1.18 (d, J = 7.6 Hz, 6H), 1.13 (d, J = 8.3 Hz, 6H), 0.94 (d, J = 10.6 Hz, 2H), 0.77 (d, J = 15.0 Hz, 3H). 13C NMR (101 MHz, CDCl3) δ 199.27, 179.93, 152.00, 138.29, 125.14, 118.94, 115.84, 114.08, 113.73, 113.72, 113.50, 113.49, 59.44, 54.65, 51.98, 47.18, 44.40, 42.80, 42.33, 40.11, 37.01, 36.78, 33.11, 30.85, 29.95, 28.66, 27.57, 27.45, 25.42, 22.43, 22.28, 21.66, 20.02, 17.29, 15.03, 13.15. C37H49NO4 m/z calcd for (M + H) +572.3740, found (M + H) +572.3743.
Biology
Chemicals and reagents. Cell culture media DMEM (Dulbecco's Modified Eagle Medium), Dulbecco's phosphate buffer saline (DPBS), trypsin–EDTA (ethylenediaminetetraacetic acid), 3-(4,5dimetylthiazolyl)-diphenyl tetrazolium bromide (MTT), DMSO (dimethyl sulphoxide), penicillin G, streptomycin, sodium bicarbonate, sodium pyruvate, RIPA lysis buffer, 1% protease and phosphatase inhibitor cocktail, Bradford reagent and beta actin antibody used as loading control were purchased from Sigma-Aldrich. FBS (fetal bovine serum) was purchased from GIBCO USA. Dichlorofluorescein diacetate (H2DCF-DA) was procured from Thermo Fisher. DAPI (4′,6-diamidino-2-phenylindole hydrochloride) was supplied by Invitrogen, Thermo Fischer Scientific. Antibodies against Bcl-2 (sc-492), Bax (sc-493), caspase-3 (sc-1226) and caspase-9 (sc-8355) were purchased from Santa Cruz.
Cell culture. Human melanoma cell line, A375 and murine melanoma cell line, B16F10 were purchased from American Type Culture Collection (Rockville, MD, USA). Primary human dermal fibroblasts, HDF were purchased from HiMedia, India. Cell lines were cultured in DMEM media supplemented with 10% FBS, penicillin G (120 mg L−1), streptomycin (270 mg L−1), sodium bicarbonate (1.2 g L−1) and sodium pyruvate (220 mg L−1) and maintained in a humidified chamber (37 °C, 5% CO2).
Cell survival assay. MTT assay was performed for cell survival analysis.16 Briefly, A375 cells (5 × 10³), B16F10 cells (5 × 10³) and HDF cells (104) were seeded in 96 well plates and incubated for 24 hours. Cells were treated with different concentrations of GPD-12 and were incubated for 24 hours. Cells were again incubated with MTT solution (100 μL per well) at a concentration of 250 μg mL−1 in PBS for 3 hours. Formazan crystals formed were dissolved in DMSO (100 μL per well). The absorbance was measured at 570 nm using plate reader, Multiskan Spectrum; Thermo Electron Corporations, USA.
Colony formation assay. A375 cells were seeded at a density of 103 cells per well of 6 well plate and kept overnight. The media was replaced with fresh media containing different concentrations of GPD-12. After 24 hours the media containing GPD-12 was removed and cells were further cultured for 6 days in media without any effectors. On day 6, cells were washed with DPBS, fixed with methanol and stained with crystal violet dye. Cells were washed with distilled water and air dried for some time. Stained colonies were captured by EVOS-FL Cell Imaging System (Thermo Fisher).
DAPI staining. A375 cells were seeded in 6 well plate (104 cells per well). After 24 hours, cells were subjected to treatment with different concentrations of GPD-12. Treatment was terminated after 24 hours. Cells were fixed with 4% para formaldehyde, permeabilized with 0.1% Triton X-100 and stained with DAPI (5 μg mL−1). Imaging was done by EVOS-FL Cell Imaging System (Thermo Fisher).
Reactive oxygen species measurement using fluorescence microscopy. A375 cells were seeded in 35 mm dishes. After 24 hours, cells were subjected to treatment with different concentrations of GPD-12 and incubated for 6 hours. Cells were washed with DPBS and stained with dichlorodihydrofluorescein diacetate (H2DCF-DA) dye (5 μg mL−1) for 30 minutes. Cells were again washed with DPBS and imaging was done under a thin layer of DPBS (EVOS-FL Cell Imaging System, Thermo Fisher).
Cell lysate preparation and western blotting. After respective treatments, cells were harvested and lysis was performed using RIPA lysis buffer containing 1% protease and phosphatase inhibitor cocktail. Protein estimation was done by Bradford protein estimation method using bovine serum albumin as standard. Protein samples were denatured at 100 °C for 3 min in 5× Laemmli buffer and equal amounts of protein samples (40 μg) were separated by SDS-PAGE (10–12%) using Miniprotein Tetra System (Bio-Rad). Proteins were transferred onto PVDF membranes and membranes were blocked using 3% bovine serum albumin. Membranes were incubated overnight at 4 °C with primary antibodies. Membranes were washed with tris buffered saline containing Tween 20 and reincubated with secondary antibody for 2 hours at room temperature. Membranes were developed using Immobilon Western Chemiluminescent HRP substrate. Blots were quantified using Image Lab™ software (BioRad).
Statistical analysis
Data is expressed as mean ± standard deviation (SD) from three independent experiments. Results were considered significant at *p < 0.05, **p < 0.01. Data was analyzed by using Graphpad Prism software.
Conclusion
Fourteen molecules (GPD-1 to GPD-14) library of indole based 18-glycyrrhetinic acid derivatives were synthesized using known reaction Fischer indole synthesis against the skin melanoma target. These molecules were screened against A375 and B16F10 cell lines and molecular modelling was performed. Compound GPD-12 showed prominent results against both the cell lines and showed highest binding affinity to the target viz. GRP28, IRE1 and Bcl-2 in the in silico drug approach. GPD-12 induced nuclear fragmentation, oxidative stress, and caspase dependent apoptosis in A375 melanoma cells. GPD-12 strongly binds to the protein GRP78 by forming pi–cation & pi–pi stacked with Asp257 and Phe114 respectively. Hence based on our molecular modelling approach and in vitro analysis, we concluded that the GPD-12 could serve best active drug molecule in the treatment of skin melanoma.
Author contributions
AK and GR performed the major experiments. AK designed and synthesized the library of compounds and performed the molecular docking studies. GR and BMA performed the biological evaluation and data analysis. RH performed the data analysis. SRR and NHS performed the data revalidation and data curation. SK analysed the chemistry portion. SAT conceived and developed the hypothesis, supervised the research work, and arranged the research funding for the work. All authors contributed to the article and approved the submitted version.
Conflicts of interest
The authors declare that there is no conflict of interest.
Acknowledgements
This work was financially supported by the Department of Biotechnology-New Delhi vide project no. GAP-2166 and Council of Scientific and Industrial Research India vide project no. HCP007. Senior Research Fellowship to AK from Department of Biotechnology, New Delhi, Senior Research Fellowship to NHS and Junior Research Fellowship to GR from Council of Scientific and Industrial Research (CSIR), New Delhi and Senior Research Fellowship to BMA by University Grant Commission, New Delhi and Senior Research Fellowship to SRR by Department of Science & Technology, New Delhi are acknowledged.
Notes and references
- E. S. Gray, H. Rizos and A. L. Reid, et al., Circulating tumor DNA to monitor treatment response and detect acquired resistance in patients with metastatic melanoma, Oncotarget, 2015, 6(39), 42008 CrossRef PubMed.
- H. Mirzaei, G. Naseri and R. Rezaee, et al., Curcumin: a new candidate for melanoma therapy?, Int. J. Cancer, 2016, 139(8), 1683–1695 CrossRef CAS PubMed.
- R. A. Rafiq, A. Quadri, L. A. Nazir, K. Peerzada, B. A. Ganai and S. A. Tasduq, A potent inhibitor of phosphoinositide 3-kinase (PI3K) and mitogen activated protein (MAP) kinase signalling, quercetin (3, 3', 4', 5, 7-pentahydroxyflavone) promotes cell death in ultraviolet (UV)-B-irradiated B16F10 melanoma cells, PLoS One, 2015, 10(7), e0131253 CrossRef PubMed.
- S. A. Chambers, M. Newman, M. M. Frangie, A. V. Savenka, A. G. Basnakian and M. A. Alam, Antimelanoma activities of chimeric thiazole–androstenone derivatives, R. Soc. Open Sci., 2021, 8(8), 210395 CrossRef CAS PubMed.
- N. Gupta, S. K. Rath, J. Singh, A. Qayum, S. Singh and P. L. Sangwan, Synthesis of novel benzylidene analogues of betulinic acid as potent cytotoxic agents, Eur. J. Med. Chem., 2017, 135, 517–530 CrossRef CAS PubMed.
- H. Hussain, I. Ali and D. Wang, et al., Glycyrrhetinic acid: a promising scaffold for the discovery of anticancer agents, Expert Opin. Drug Discovery, 2021, 16(12), 1497–1516 CrossRef CAS PubMed.
- A. Kumar, A. Sajida and C. P. Singh, et al., Photoprotective Effect of 18β-Glycyrrhetinic Acid Derivatives Against Ultra Violet (UV)-B-Induced Skin Aging, Bioorg. Med. Chem. Lett., 2022, 128984 CrossRef CAS PubMed.
- Y.-H. Luo, C. Wang and W.-T. Xu, et al., 18β-Glycyrrhetinic acid has anti-cancer effects via inducing apoptosis and G2/M cell cycle arrest, and inhibiting migration of A549 lung cancer cells, OncoTargets Ther., 2021, 14, 5131 CrossRef CAS PubMed.
- L. De-la-Cruz-Martínez, C. Duran-Becerra and M. González-Andrade, et al., Indole-and Pyrazole-Glycyrrhetinic Acid Derivatives as PTP1B Inhibitors: Synthesis, In Vitro and In Silico Studies, Molecules, 2021, 26(14), 4375 CrossRef PubMed.
- L. A. Nazir, N. H. Shahid and K. Amit, et al., Synthesis and anti-melanoma effect of 3-O-prenyl glycyrrhetinic acid against B16F10 cells via induction of endoplasmic reticulum stress-mediated autophagy through ERK/AKT signaling pathway, Front. Oncol., 2022, 12, 890299 CrossRef PubMed.
- S. Preissler, C. Rato, Y. Yan, L. A. Perera, A. Czako and D. Ron, Calcium depletion challenges endoplasmic reticulum proteostasis by destabilising BiP-substrate complexes, Elife, 2020, 9, e62601 CrossRef CAS PubMed.
- T. D. Heightman, V. Berdini and H. Braithwaite, et al., Fragment-based discovery of a potent, orally bioavailable inhibitor that modulates the phosphorylation and catalytic activity of ERK1/2, J. Med. Chem., 2018, 61(11), 4978–4992 CrossRef CAS PubMed.
- M. Redza-Dutordoir and D. A. Averill-Bates, Activation of apoptosis signalling pathways by reactive oxygen species, Biochim. Biophys. Acta, Mol. Cell Res., 2016, 1863(12), 2977–2992 CrossRef CAS PubMed.
- A. V. Shetty, S. Thirugnanam and G. Dakshinamoorthy, et al., 18α-glycyrrhetinic acid targets prostate cancer cells by down-regulating inflammation-related genes, Int. J. Oncol., 2011, 39(3), 635–640 CAS.
- G. Sharma, S. Kar, S. Palit and P. K. Das, 18β-glycyrrhetinic acid induces apoptosis through modulation of Akt/FOXO3a/Bim pathway in human breast cancer MCF-7 cells, J. Cell. Physiol., 2012, 227(5), 1923–1931 CrossRef CAS PubMed.
- M. R. Farrukh, U. A. Nissar and Q. Afnan, et al., Oxidative stress mediated Ca2+ release manifests endoplasmic reticulum stress leading to unfolded protein response in UV-B irradiated human skin cells, J. Dermatol. Sci., 2014, 75(1), 24–35 CrossRef CAS PubMed.
Footnotes |
| † Electronic supplementary information (ESI) available. See DOI: https://doi.org/10.1039/d2ra08023k |
| ‡ Amit Kumar and Ragni Gupta are equal contributors to the study. |
|
| This journal is © The Royal Society of Chemistry 2023 |
Click here to see how this site uses Cookies. View our privacy policy here. 
 Open Access Article
 This Open Access Article is licensed under a Creative Commons Attribution-Non Commercial 3.0 Unported Licence
 cd,
Shahid Hussain Naikoocd,
Sarabjit Kaurb and
Sheikh Abdullah Tasduq
cd,
Shahid Hussain Naikoocd,
Sarabjit Kaurb and
Sheikh Abdullah Tasduq