 Open Access Article
Quantum modeling of dimethoxyl-indaceno dithiophene based acceptors for the development of semiconducting acceptors with outstanding photovoltaic potential
Ehsan Ullah Rashida,
N. M. A. Hadia *b,
Ahmed M. Shawky
 *c,
Nashra Ijaza,
Manel Essiddf,
Javed Iqbal*a,
Naifa S. Alatawie,
Muhammad Ans
 *a and
Rasheed Ahmad Khera
 *a
*a
aDepartment of Chemistry, University of Agriculture, Faisalabad 38000, Pakistan. E-mail: javedkhattak79@gmail.com; javed.iqbal@uaf.edu.pk; ansbhatti24@gmail.com; rasheedahmadkhera@yahoo.com; rasheed.ahmad.khera@uaf.edu.pk
bPhysics Department, College of Science, Jouf University, P.O. Box 2014, Sakaka, Al-Jouf, Saudi Arabia. E-mail: nmhadia@ju.edu.sa
cScience and Technology Unit (STU), Umm Al-Qura University, Makkah 21955, Saudi Arabia
dChemistry Department, College of Science, King Khalid University (KKU), P.O. Box 9004, Abha, Saudi Arabia
ePhysics Department, Faculty of Science, University of Tabuk, Tabuk 71421, Saudi Arabia. E-mail: nsalatawi@ut.edu.sa
fUniversité de Carthage, Faculté des Sciences de Bizerte, LR13ES08 Laboratoire de Chimie des Matériaux, Zarzouna Bizerte, 7021, Tunisia
First published on 6th February 2023
Abstract
In the current DFT study, seven dimethoxyl-indaceno dithiophene based semiconducting acceptor molecules (ID1–ID7) are designed computationally by modifying the parent molecule (IDR). Here, based on a DFT exploration at a carefully selected level of theory, we have compiled a list of the optoelectronic properties of ID1–ID7 and IDR. In light of these results, all newly designed molecules, except ID5 have shown a bathochromic shift in their highest absorbance (λmax). ID1–ID4, ID6 and ID7 molecules have smaller band gap (Egap) and excitation energy (Ex). IP of ID5 is the smallest and EA of ID1 is the largest among all others. Compared to the parent molecule, ID1–ID3 have increased electron mobility, with ID1 being the most improved in hole mobility. ID4 had the best light harvesting efficiency in this investigation, due to its strongest oscillator. The acceptor molecules' open-circuit voltages (VOC) were computed after being linked to the PTB7-Th donor molecule. Fill factor (FF) and normalized VOC of ID1–ID7 were calculated and compared to the parent molecule. Based on the outcomes of this study, the modified acceptors may be further scrutinised for empirical usage in the production of organic solar cells with enhanced photovoltaic capabilities.
1. Introduction
Solar energy is amongst the most prospective forms of green and sustainable energy and a photovoltaic cell is a device that transforms the unending sun's supply into electricity. Commercially available silicon (Si) solar cells have an extraordinary power conversion efficiency (PCE), but their manufacture is energy-intensive and pollutes the environment significantly due to the processing and purifying of silicon crystals.1–3 In contrast, organic solar cells (OSCs) of the third generation have the benefits of a simplified device fabrication, inexpensive solution preparation, and the potential to be produced as bendable and semitransparent systems.4–7 The PCE of OSCs has amplified rapidly because of the recent developments in the engineering and manufacturing of highly efficient optoelectronic semiconductors and improvement on the device fabrication.8–13 In particular, n-type organic semiconductor (n-OS) based small acceptor molecules14–17 with a low bandgap (Egap), when combined with a p-type donor polymer having a medium Egap, have shown remarkable optoelectronic performance.18–20 The PCE of polymer based solar cells having an n-OS as an accepting moiety has increased to a 14%, surpassing the limit for PSCs to be used in practical settings.21–23 The majority of highly efficient donor and acceptor optoelectronic materials, though, currently contain complex chemical geometries.24,25 Large amounts of energy are required, and a substantial expense is incurred, during their manufacture due to the many purifications and poor yields that are inevitable.Presently, ITIC26 and IDIC27 are the two most popular and commonly utilized examples of highly efficient n-OS acceptors. The maximum absorption (λmax) of ITIC is 664 nm in dichloromethane, while the compound shows considerable absorption from 500 to 750 nm. The ITIC film has an optical bandgap of 1.59 eV, while its electron mobility may reach to 3.0 × 10⁻⁴ cm2 V−1 s−1.26 Contrarily, λmax of IDIC is seen about 640 nm, with substantial absorption observed between 500 and 800 nm dichloromethane solution (10−6 M). The optical bandgap of IDIC is 1.60 eV, and its electron mobility is very high i.e., 1.1 × 10⁻³ cm2 V−1 s−1.27,28 Though when blended with PDCBT-Cl, its maximum output voltage (0.94 V) and fill factor (64.2%) values are slightly lower to the ITIC (1.01 V and 64.8%), but its PCE of 9.12% is quite higher to the 7.05% of ITIC, which could be due to its higher short circuit current value of 15.0 mA cm−2 compared to the 10.6 mA cm−2 of its counterpart.29 In contrast to ITIC, IDIC has alkyl side groups on its IDT centre, a small fused ring in its central entity, and so has the capability to be the least priced acceptor. Furthermore, the stated technique for the production of ITIC requires a difficult multiple steps procedure with tedious post-production,30 e.g. the Wolff–Kishner reduction reaction and Friedel–Crafts acylation reaction. As a consequence, the productivity is poor, and the costing is expensive. In contrast, the alkylation of ring-closure employed in IDIC synthesizing process may have a poor yield of the core fused-ring group because of the adverse reaction of alkyl chain dehydration. A more effective strategy for preparing the n-OS acceptors with alkyl side-groups was, hence, required.
Amberlyst15, a catalyst employed in the synthesis of IDIC's core fused ring, was described by Li et al. as a means of simplifying and optimizing the synthesis process, with potential cost savings for the final product.31 Following this, they generated a fused-ring entity MO-IDT and enhanced the production of the core fused-ring component by adding alkoxy (–OR) groups to it. Using MO-IDT as a building block, the inexpensive acceptor MO-IDIC was synthesized, and its photovoltaic characteristics were studied in depth. The observed absorption spectra revealed that MO-IDIC have a potential absorption of 600–700 nm along with a maximum absorption at 670 nm. There was a significant PCE increase (11.16%) in PTQ10-donor MO-IDIC-acceptor PSCs. According to the findings, MO-IDIC shows promise as a low-priced n-OS acceptor for potential PSC applications in the future.31
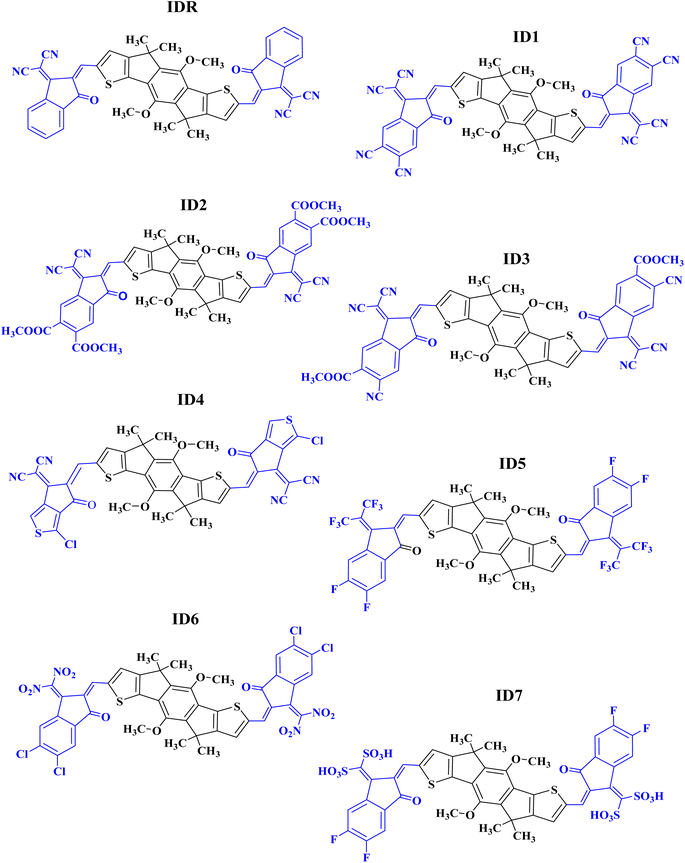
In the present research, we have used MO-IDIC as a reference molecule (IDR) and have replaced lengthy alkyl chains with methyl groups, for the sake of saving time and effort, because the existence of long alkyl chains do not impose any considerable impact on the optoelectronic features of the molecules.32,33 The electron donor core of IDR is dimethoxyl-indaceno dithiophene based and 2-(2-methylene-3-oxo-indan-1-ylidene)-malononitrile is the end-group (EG) existing on the both peripheral sites of the core. Seven new acceptors (ID1–ID7) have been developed computationally by replacing the exiting EGs of IDR with 1-dicyanomethylene-2-methylene-3-oxo-indan-5,6-dicarbonitrile in ID1, 1-dicyanomethylene-2-methylene-3-oxo-indan-5,6-dicarboxylic acid dimethyl ester in ID2, 6-cyano-1-dicyanomethylene-2-methylene-3-oxo-indan-5-carboxylic acid methyl ester in ID3, 2-(3-chloro-5-methylene-6-oxo-5,6-dihydro-cyclopenta[c]thiophen-4-ylidene)-malononitrile in ID4, 5,6-difluoro-2-methylene-3-(2,2,2-trifluoro-1-trifluoromethyl-ethylidene)-indan-1-one in ID5, 5,6-dichloro-3-dinitromethylene-2-methylene-indan-1-one in ID6, and (5,6-difluoro-2-methylene-3-oxo-indan-1-ylidene)-methanedisulfonic acid in ID7 correspondingly, as shown in Fig. 1.
2. Computational aspects
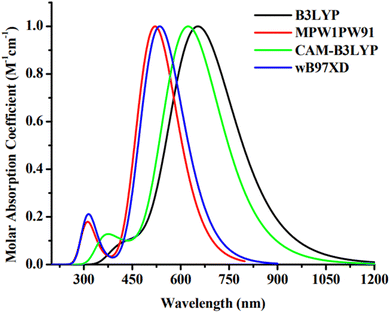
The Gaussian 09 software34 was used for all required computations. The molecules, including the reference, were devised using the GaussView 6.0.16.35 For the purpose of IDR optimization, density functional theory (DFT) computations are done run using 6-31G(d,p) basis set with B3LYP,36 CAM-B3LYP,37 MPW1PW91,38 and wB97XD39 functionals. After IDR's structure was optimized, we used time-dependent DFT simulations to predict its light-absorbing characteristics. We investigated the effect of the solvent (chloroform) on these characteristics using the IEFPCM approach.40 The theoretical technique was validated by contrasting the theoretically predicted maximum absorption (λmax) of IDR from the preceding four functionals to empirically observed λmax data from the research. A comparison is made between the empirical max of IDR (670 nm)31 and the four predicted λmax i.e. 656 nm, 624 nm, 519 nm, and 537 nm (Fig. 2). To get the best appropriate findings for the computationally created compounds, we found that simulations using the B3LYP functional were the most closest in accord with the empirical observations.Origin 6.0 was used to generate the profiles of the compounds' absorption.41 We studied the transition density matrix (TDM) and utilized Multiwfn42 to examine the paths and interactions of excitons. PyMOlyze 1.1 (ref. 43) was used in order to produce graphs illustrating the density of states (DOS).44 In order to compute the intramolecular and intermolecular mobility of charges, the Marcus theory has been used, and the reorganization energy (RE) was investigated.45,46 However, intramolecular charge transfer (ICT) is what we focused on for this investigation. RE refers to the interplay of two distinct but linked reorganization energies. Exterior RE is affected by intense environmental oscillations and polarity fluctuations that occur while the charge transfer, internal RE is mostly reliant on differences in molecule structure.47 For this investigation, we can only focus on internal RE since we cannot use external RE to verify our estimations. Using eqn (1) and (2),48 we calculated the RE for hole (λ+) and electron (λ−) mobility.
| λ+ = [E+0 − E0] + [E0+ − E+] | (1) |
| λ− = [E−0 − E0] + [E0− − E−] | (2) |
3. Results and discussion
3.1. Optimization of geometries
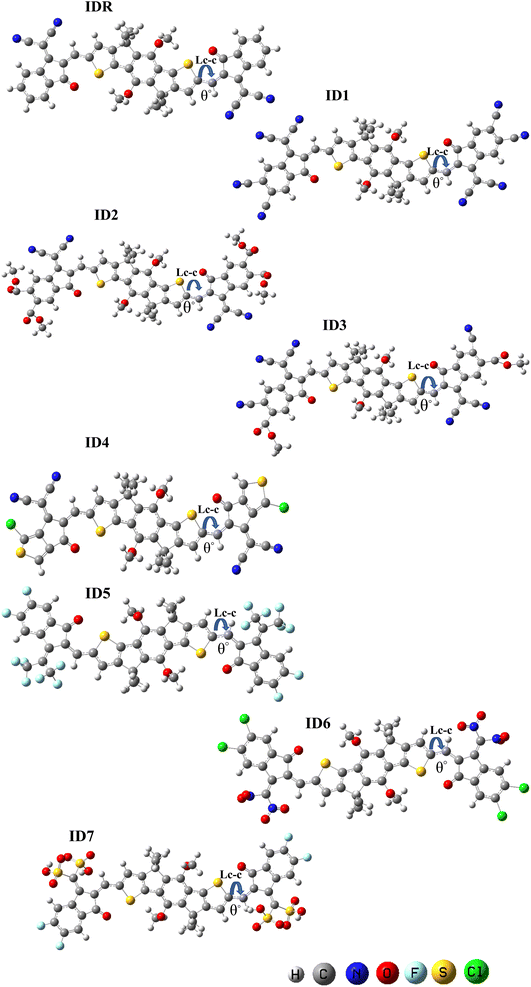
DFT-based optimization of the molecular geometry derives directly the electronic probability density, which can then be used to compute the system's energy.50 In this work, the studied molecules, have been optimized using a DFT-based functional i.e. B3LYP.36 The optoelectronic characteristics are very sensitive to the molecule geometry.51 Fig. 3 demonstrates that both the benchmark (IDR) and the newly produced compounds (ID1–ID7) were optimized using the selected DFT functional. The continuous transfer of π-electrons enables charge transmission in these materials exceedingly robust, and the molecules' broad conjugation, which covers the complete molecule from core to peripherals, allows for effective charge transfer. By measuring the dihedral angles (θ°)52 and bond lengths (LC–C)53 of IDR as well as ID1–ID7 molecules, we may infer their degree of planarity and conjugation (see Table 1). Double bonds (C![[double bond, length as m-dash]](https://www.rsc.org/images/entities/char_e001.gif) C) between carbon atoms have a distance of 1.34 Å, whereas single bonds (C–C) have a distance of 1.54 Å. Each of the suggested compounds (ID1–ID7) has enhanced charge transport qualities and allows for the conjugation enabling delocalization of electrons due to a LC–C between 1.41 and 1.42 Å, in contrast to IDR, which has an LC–C of 1.49 Å. The θ° values for all compounds ranged from 0.32° to 4.74°. By this logic, we know that the EGs of any given molecule lie flat against its core.
C) between carbon atoms have a distance of 1.34 Å, whereas single bonds (C–C) have a distance of 1.54 Å. Each of the suggested compounds (ID1–ID7) has enhanced charge transport qualities and allows for the conjugation enabling delocalization of electrons due to a LC–C between 1.41 and 1.42 Å, in contrast to IDR, which has an LC–C of 1.49 Å. The θ° values for all compounds ranged from 0.32° to 4.74°. By this logic, we know that the EGs of any given molecule lie flat against its core.
| Molecules | Bond length (Å) | Dihedral angle (θ°) |
|---|---|---|
| IDR | 1.49 | 0.32 |
| ID1 | 1.41 | 0.68 |
| ID2 | 1.42 | 0.65 |
| ID3 | 1.42 | 0.69 |
| ID4 | 1.42 | 2.52 |
| ID5 | 1.42 | 4.74 |
| ID6 | 1.41 | 1.83 |
| ID7 | 1.41 | 2.36 |
3.2. Frontier molecular orbitals (FMOs)
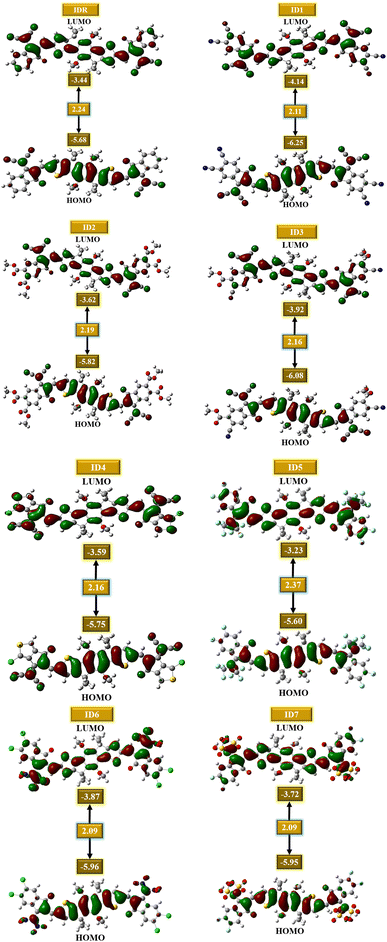
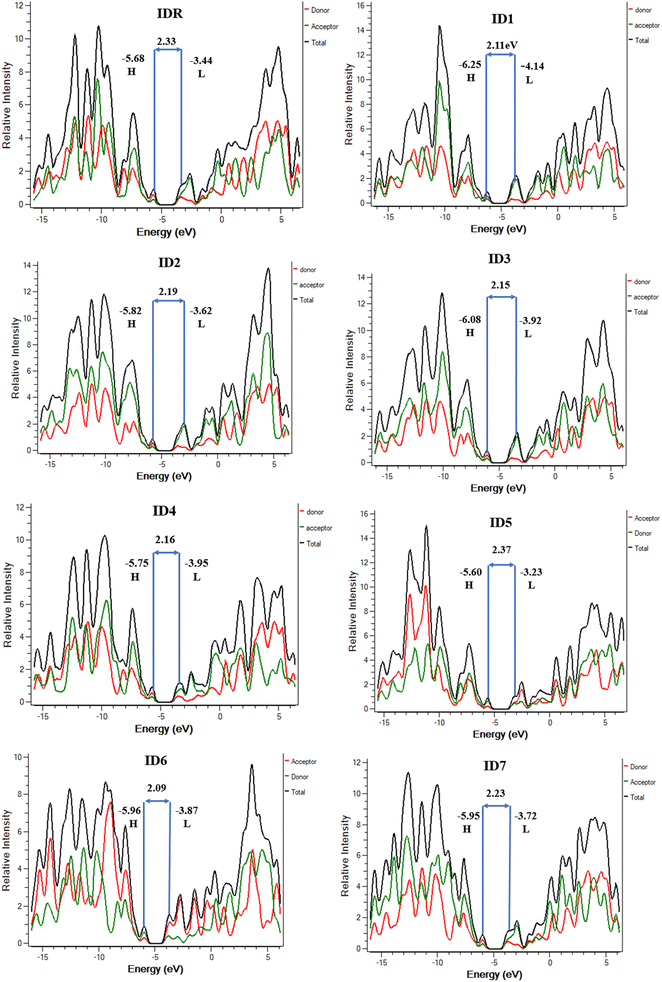
It is critical to examine the FMOs since doing so exposes how well the molecules facilitate charge transit and electric potential dispersion.54 It aids in understanding how charge is transferred and promoted around OSCs. Conduction mechanism, absorptivity, and other electrical characteristics of molecules are dramatically affected by their HOMO and LUMO energies. When discussing OSCs and other photovoltaic processes, it is important to note the presence of the energy gap (Egap), which reflects the proportion of energy needed for the excitation of electrons.55 It is seen that molecules with low band gap generally produce low values of open-circuit voltage, but absorb greater sunlight and thus produces increased amount of current, and vice versa. So, the band gap should be in an optimal range for the molecule to generate effective photovoltaic attributes of all the studied parameters.56 Extremely polarizable, fragile reaction kinetics, and highly reactive molecules have a low Egap.57 The calculated FMOs and Egap energies of the IDR and ID1–ID7 molecules are analyzed to estimate the effect of several electron accepting EGs on the photochemical aspects of the molecules under consideration (Table 2). Fig. 4 displays the HOMO and LUMO energies, as well as the Egap, for each molecule.| Molecules | HOMO | LUMO | Egap | IP | EA |
|---|---|---|---|---|---|
| IDR | −5.68 | −3.44 | 2.24 | 6.53 | 2.66 |
| ID1 | −6.25 | −4.14 | 2.11 | 7.74 | 3.37 |
| ID2 | −5.82 | −3.62 | 2.19 | 6.53 | 2.77 |
| ID3 | −6.08 | −3.92 | 2.16 | 6.80 | 3.18 |
| ID4 | −5.75 | −3.59 | 2.16 | 6.53 | 2.82 |
| ID5 | −5.60 | −3.23 | 2.37 | 6.25 | 2.31 |
| ID6 | −5.96 | −3.87 | 2.09 | 6.80 | 3.02 |
| ID7 | −5.95 | −3.72 | 2.23 | 6.80 | 2.85 |
Most of a molecule's charge in its ground state is found in its core region, which is called the donor region. The EG accepting subunits are the most peripheral parts of a molecule that receive charges when the molecule is in an excited state. The planarity of molecular structures allow for significant charge transport functions, and charge mobility features of compounds from donor to acceptor locations is proof of this effective conjugation. The IDR compound has a HOMO, LUMO, and Egap of −5.68, −3.44, and 2.24 eV. The ID1 molecule has the highly-stable HOMO of all the compounds tested, with a value of −6.25 eV for its HOMO. ID1's electrostatic potential dispersion, which has made the ground-state extremely stable, is most likely due to electron-withdrawing cyano groups in the molecule's EG units. ID3 possesses highly-stable HOMO after ID1, and its comparatively low HOMO of −6.08 eV is the reason for this. The electronegative ester and cyano groups in the EG of ID3 is the most probable reason behind its second stables HOMO. The declining patterns of examined compounds' HOMO and LUMO orbiting energy values are ID5 > IDR > ID4 > ID2 > ID7 > ID6 > ID3 > ID1 and ID5 > IDR > ID4 > ID2 > ID7 > ID6 > ID3 > ID1, respectively. The Egap of every recently proposed molecule has decreased as compared to IDR molecule, with the exception of ID5. As a result of the strong electronegative EGs, the Egap is shrunk, which improves the molecule's charge transfer capacities. ID5 > IDR > ID7 > ID2 > ID3 = ID4 > ID1 > ID6 is the declining trend of Egap for all studied compounds.
3.3. Electron affinity (EA) and ionization potential (IP)
The efficiency of transfer of charges might be influenced by various aspects, including IP and EA. EA is the released energy after addition of any electron to a molecule, while IP is the needed energy for an electron removal.58 When the both these factors of a molecule are high, it means that it has highly stable HOMO, which makes removing electrons from it more difficult and electrons can be efficiently released from molecules with low IPs and EAs. Strong IP and EA of compounds are the result of electron-withdrawing components that stabilize the HOMO state while compounds with low IP and EA are brought on by HOMO destabilizing electron-donor components.59 Eqn (3) and (4)60 are used to calculate both these parameters.| IP = [E0+ − E0] | (3) |
| EA = [E0 − E0−] | (4) |
Table 2 lists the calculated IP and EA of IDR and ID1–ID7 molecules. The largest IP (7.74 eV) and EA (3.37 eV) of any other investigated molecule are found in ID1, which has a highly stable HOMO (−6.25 eV). The most HOMO-destabilized molecule, ID5, has the lowest IP (6.25 eV) and EA (2.31 eV) of all the molecules.
3.4. Optical properties
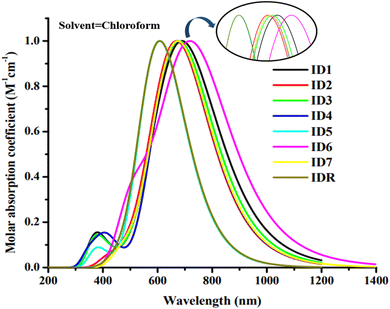
The light absorbance spectrum can be used to infer the electronic characteristics of the chromophore with great precision. Table 3 enlisted the approximated optical characteristics of IDR and ID1–ID7 in chloroform. The absorption of IDR and ID1–ID7 starts from 300 to 1200 nm in chloroform solvent (Fig. 5). Except ID5, all newly designed molecules have bathochromic shift in their λmax. IDR and ID5 have λmax peaks at 654 nm and 607 nm, respectively. λmax of ID1–ID4, ID6 and ID7 molecules are 702 nm, 673 nm, 685 nm, 673 nm, 725 nm and 675 nm, respectively. The λmax of ID1–ID4, ID6, and ID7 compounds shifted from the IDR by 19 nm to 71 nm in the UV-visible spectrum, demonstrating a bathochromic behaviour in CHCl3 solvent. Planar molecular structure facilitates stronger conjugation, which in turn increases optical absorption.61 All the compounds with the smallest Egap also had the longer wavelengths, since the relationship between the two is inverse. The examined compounds' rising λmax trends in the CHCl3 solvent are shown by ID5 < IDR < ID2 = ID4 < ID7 < ID3 < ID1 < ID6. In CHCl3 solvent, the findings demonstrate that ID6 has the highest max at 725 nm. This is ascribed to the pair of electronegative chloro and nitro groups in the EG acceptors of ID6 molecule.| Molecules | Experimental λmax (nm) | Computed λmax (nm) | Ex (eV) | f | LHE | Transition character (H → L) (%) |
|---|---|---|---|---|---|---|
| IDR | 670 | 654 | 1.89 | 2.54 | 0.9971 | 70 |
| ID1 | — | 702 | 1.76 | 2.36 | 0.9956 | 70 |
| ID2 | — | 673 | 1.84 | 2.57 | 0.9973 | 70 |
| ID3 | — | 685 | 1.81 | 2.53 | 0.9971 | 70 |
| ID4 | — | 673 | 1.84 | 2.63 | 0.9976 | 70 |
| ID5 | — | 607 | 2.03 | 2.52 | 0.9970 | 70 |
| ID6 | — | 725 | 1.70 | 2.05 | 0.9912 | 70 |
| ID7 | — | 675 | 1.83 | 2.51 | 0.9969 | 70 |
There is a non-dimensional variable called the oscillator strength (f) that has a profound effect on the optical characteristics of OSC systems and the strength of the radiation emitted by electric stimulation throughout the energy state.62 Potential changes need a certain amount of energy, known as excitation energy (Ex).63 Moreover, increasing f, reducing Ex, or broadening the absorbance range may all enhance ICT. Newly suggested molecules, with the exception of ID5, all have lower Ex values as opposed to IDR.
Each component of a solar cell, has to be capable to produce an electric current after exposure to light which often called light-harvesting efficiency.64 LHE has an impact on how well the system absorbs energy, and oscillator strength has an impact as well because of how much short-circuit current (JSC) it produces. Eqn (5) was used to estimate the LHE for each compound examined.
| LHE = 1 − 10−f | (5) |
Table 3 lists the LHE values determined for the IDR and ID1–ID7 molecules in CHCl3 solvent. Overall, the LHE values for ID2 and ID4 molecules were greater than IDR. Since ID4 has a stronger oscillation strength, it yields the most LHE. The LHE of ID3 is the same as the LHE of IDR, while ID5 is nearly equal to the LHE of IDR. The lower LHE of the remaining molecules might be because of the negative influence of their end groups on the transition probability, leading to reduced oscillator strength and LHE values. Specifically, the LHE values of all, except for ID1 and ID6, are higher or comparative to the reference molecule.
3.5. Dipole moment (D)
When determining the solubility and crystalline phase, the dipole moment (D) is crucial. Such characteristics are crucial in defining polarizing behaviours in the solvent desired for efficient organic photovoltaic systems.65 Charge may be transported regularly in compounds with a high D value because of their planar and ordered shape. As a consequence, the crystalline character of the compound is enhanced, and it becomes more soluble in polar-solvents due to the tight packing of its structural components. Higher D numbers indicate that molecules are more prone to crystallize, and that they disperse more easily in polar liquids, both of which enhance charge transmission.66 Molecules with negligible D value are often not soluble in polar aprotic solvents like CHCl3. This correlation is not, however, always true since the molecular structure of a given molecule determines its reactivity toward solvents and its ability to transmit charges.63 Table 4 exhibit numerical data indicating an escalating order of D for molecules i.e. IDR < ID6 < ID1 < ID5 < ID7 < ID2 < ID4 < ID3 and IDR < ID1 < ID6 < ID5 < ID7 < ID2 < ID4 < ID3 studied in both stages (gas and CHCl3 respectively). ID1–ID7 have much higher D values than IDR, which improves their solubility and crystallinity. The occurrence of cyano and ester moieties at the EGs are the reason why ID3 possesses the highest D value.| Molecules | D (gas phase) | D (solvent phase) |
|---|---|---|
| IDR | 0.00022 | 0.000283 |
| ID1 | 0.40909 | 0.005511 |
| ID2 | 3.06192 | 3.658809 |
| ID3 | 6.83557 | 7.914996 |
| ID4 | 4.49408 | 5.449057 |
| ID5 | 1.12053 | 1.289791 |
| ID6 | 0.00627 | 0.007537 |
| ID7 | 2.89507 | 3.557854 |
3.6. Density of states (DOS)
Studies of DOS are essential for learning how the various elements (donor, acceptor, etc.) of a compound work together. The corresponding DOS that can be both partial and total, determines the entire capability of molecules.67 When planning the placement of FMOs in respect to the Mulliken charge density, DOS estimation is a crucial first step. At the designated level of theory, the DOS was deliberated for all of the probed molecules and PyMOlyze 1.1 was used to generate charts and graphs from the data. In the generated plots, the x-axis represents energy, while y-axis signifies relative intensity. Peaks depicting HOMO energy may be seen out to the left of the graphs' central line (the Egap). However, the peaks that represent LUMO energy may be seen to the right of the centre line. Separating each molecule into its donor and acceptor pieces allowed us to analyse the effect of each individual unit on the FMOs.In the DOS schemes of IDR and ID1–ID4 and ID7 molecules, red and green lines show the donor and acceptor contribution in the FMOs and in ID5 and ID6 molecules, red and green lines are showing the contribution of acceptor–donor subunits in the FMOs (Fig. 6). Table 5 provides quantitative measure of inputs from each components. It is expected from the outcomes that the core donor component has a more significant role in the HOMO state, whereas acceptor component plays a greater role in the LUMO state in all of the tested compounds' FMOs. This offers irrefutable confirmation for the feasibility of charge transfer by successive conjugation between donor and acceptor components of a molecule, which has the capability to increase the ultimate efficacy of OSCs. From Fig. 4, it can be concluded that these observations agree with the FMOs of the investigated compounds. Because of their planar shape, molecules are able to effectively transport charge from electron-rich donor core area to the peripheral electron-accepting EGs in excited state, as shown by the results.
| Molecules | FMOs | Acceptor (%) | Donor (%) |
|---|---|---|---|
| IDR | HOMO | 34.8 | 65.2 |
| LUMO | 53.9 | 46.1 | |
| ID1 | HOMO | 37.0 | 63.0 |
| LUMO | 66.9 | 33.1 | |
| ID2 | HOMO | 35.7 | 64.3 |
| LUMO | 63.9 | 36.1 | |
| ID3 | HOMO | 36.4 | 63.6 |
| LUMO | 64.4 | 35.6 | |
| ID4 | HOMO | 36.4 | 63.6 |
| LUMO | 64.4 | 35.6 | |
| ID5 | HOMO | 26.6 | 73.4 |
| LUMO | 52.8 | 47.2 | |
| ID6 | HOMO | 34.9 | 65.1 |
| LUMO | 64.8 | 35.2 | |
| ID7 | HOMO | 36.0 | 64.0 |
| LUMO | 53.5 | 46.5 |
3.7. Reorganization energy (RE)
RE of ID1–ID7 and IDR molecules was measured to examine the charge transfer between charge accepting and donating subunits. The RE offers a quantified estimate of the charges moved from molecule's donor section to the acceptor, and is therefore connected to mobility of electrons and holes of the molecule, making it the most crucial factor in the design of components that are useful for OSCs.68 Actually, the RE is inversely correlated to the electrons and holes' mobility. For this reason, by decreasing the RE, charge transmission efficiency is improved.69 Anion and cation geometry formations are only one of many potential factors that might influence RE. Table 6 displays the results of calculating the RE of hole and electron for each molecule under study with eqn (1) and (2). The studies imply that the augmented molecular mix attributable to the plane geometries of some of the newly suggested molecules is responsible for the higher hole and electron mobility recorded for those molecules.| Molecule | λ− (eV) | λ+ (eV) |
|---|---|---|
| IDR | 0.1986 | 0.1741 |
| ID1 | 0.1469 | 0.1687 |
| ID2 | 0.1061 | 0.1904 |
| ID3 | 0.1850 | 0.1986 |
| ID4 | 0.2067 | 0.1768 |
| ID5 | 0.3346 | 0.2231 |
| ID6 | 0.3237 | 0.2176 |
| ID7 | 0.4299 | 0.3428 |
ID1–ID3, with their lower RE of λ− (0.1469, 0.1061 and 0.1850 eV), have higher electron mobility than IDR (0.1986 eV). The resulting molecular mix has a finer morphology because of the plane geometric models, which boost exciton dispersion and electron mobility. Since ID2 exhibited the lowest RE for electron mobility (0.1061 eV) among the molecules studied, this finding suggests that the EGs recently grafted onto the molecule had a significant impact in improving its electron transport properties. ID2 < ID1 < ID3 < IDR < ID4 < ID6 < ID5 < ID7 is the examined compounds' λ− sequence. Remarkably, ID1 (0.1687 eV) has the greatest hole mobility of all the studied molecules since its RE for hole mobility has decreased the most.
3.8. Electrostatic potential (ESP)
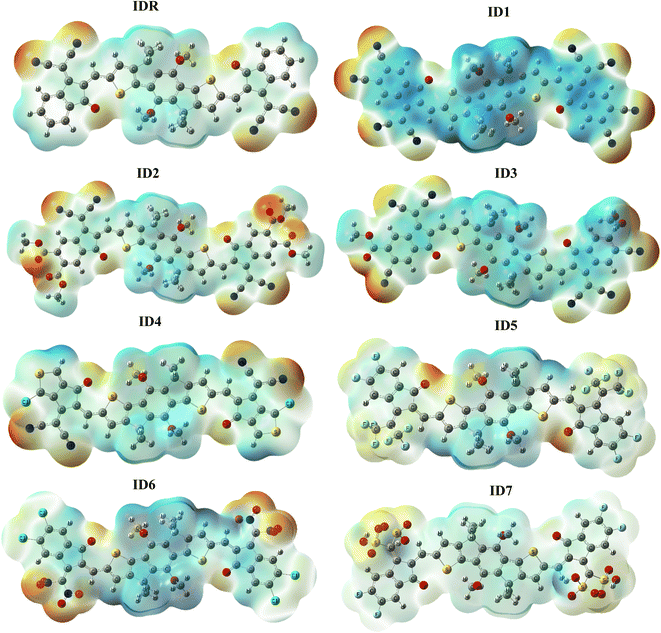
ESP signifies presence as well as absence of electrons, along with the 3D distribution of charges outside of a molecule.70 To forecast which reacting sites are present somewhere in a molecule's framework, we used the ESP approach to the substances that we had studied in great detail. The ESP maps display the three-dimensional distribution of lone pair, unbounded-electrons, and electron-rich components that are amenable to nucleophilic reactivity. ESP diagrams include dark red spots representing regions of high electron density around oxygen and nitrogen atoms at the EGs of molecules (Fig. 7). Because oxygen is present at EGs, its characteristic red hue serves as an indicator of the high electron density present across these spots. However, oxygen is present in the centre of molecules displaying blue and green hues, and the electrons deficient carbon atoms nearby cancels out the electrostatic concentration of the oxygen there.46 On the ESP maps, methyl and benzene and thiophene rings are shaded blue to indicate a significant deficiency of electrons.3.9. Transition density matrix (TDM) and exciton binding energy (Eb)
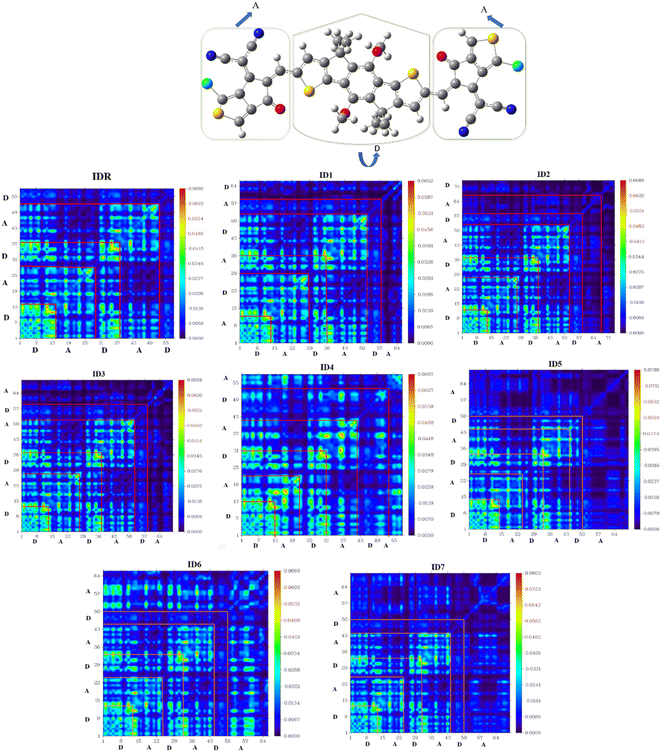
TDM assessment is essential for precisely predicting the exciton flux in between electron accepting and donating units in conjugated geometries at particular sites.71 It is feasible to predict charges transmissions, major charge patches, and the position of exciton motions throughout emissions and absorbance in the excited state by the use of this technique.72 TDM plots are created in order to examine electronic features, such as the degree of delocalization and the influence of resonance, as well as to understand how charges travel inside molecules. Hydrogen is often disregarded in TDM research because of the concept that its impact on electrostatic interaction is negligible. On the y-axis and x-axes, atoms that of molecules with no hydrogen in it are present. The coefficient representing the charge potential is displayed by the bar towards the right of the plot that has a gradient from blue to red along the x-axis. The electrostatic frequency can be seen in acceptor (A) and donor (D) both areas of IDR and ID1–ID7 (Fig. 8). Electrostatic potential alternates between flowing diagonally and off-diagonally from donor to acceptor all throughout the molecule, with the former being the more prevalent of the two. The images displayed the sequential conjugation of the compounds' EGs with the donor core sections, demonstrating the systematic transmission of electric densities from the donor central segment to the EGs.Eb is also important since it may be utilized as a predictor for the exciton (electron–hole) segregation possibilities, OSC functioning, and electrical qualities.73 Analysing the interaction among electron–hole pairs depending on coulombic forces yields the quantity of Eb.74 Electron–hole coulombic interaction is weak if Eb is small, and vice versa. According to this analysis's eqn (6), the projected values for Eb are shown in Table 7.
| Eb = Egap − Ex | (6) |
| Molecule | Egap | Ex | Eb |
|---|---|---|---|
| IDR | 2.24 | 1.89 | 0.34 |
| ID1 | 2.11 | 1.76 | 0.34 |
| ID2 | 2.19 | 1.84 | 0.35 |
| ID3 | 2.16 | 1.81 | 0.35 |
| ID4 | 2.16 | 1.84 | 0.32 |
| ID5 | 2.37 | 2.03 | 0.34 |
| ID6 | 2.09 | 1.70 | 0.39 |
| ID7 | 2.23 | 1.83 | 0.40 |
We observe that the Eb values of ID1 and ID5 are virtually equal to those of IDR. ID4 has the lowest Eb (0.32 eV) in the CHCl3 solvent as compared to other investigated molecules.
3.10. Performance of device
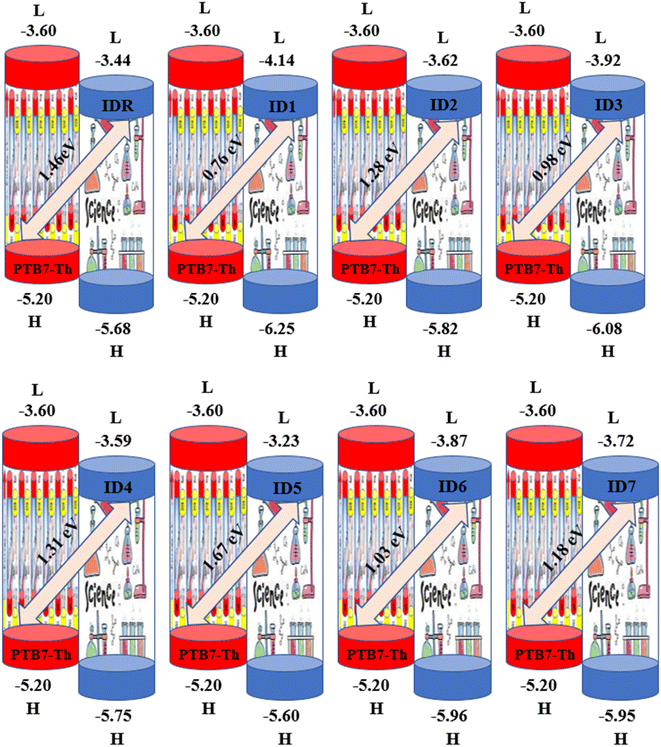
Any solar instrument's photovoltaic aptitude can be assessed by quantifying its open circuit voltage (VOC), making it a key aspect of understanding how the device functions.75 When no additional current is placed on an optical device, the voltage measured as VOC indicates the maximum voltage that can be delivered by the device.76 The highest voltage is generated when the HOMO from donor compound and LUMO from acceptor one are linked together. Reduced HOMO energies of donor and the increased LUMO energies of the acceptor are required to achieve the increased VOC values. In the presented work, the HOMO of PTB7-Th donor was coupled with studied acceptors' LUMO (IDR, ID1–ID7) to release the utmost VOC. The available study demonstrates that PTB7-Th, with its HOMO and LUMO energy of −5.20 and −3.60 eV, is a reliable donor for theoretical calculations due to its comparable LUMO value to the NFAs' LUMO for easy charge transfer.77 Here, we used eqn (7)78 to get a numerical approximation of VOC values.
 | (7) |
The e is the charge symbol for molecules, has a value of 1. The coefficient of charge between surfaces, often about 0.30. The proposed small acceptors (IDR, ID1–ID7) and PTB7-Th donor are shown in Fig. 9 together with their estimated VOC and FMOs. Evidence suggests that ID5 molecules have a higher VOC value (1.67 eV) than IDR molecules do (1.46 eV). The ascending VOC order of all newly proposed is ID1 < ID3 < ID6 < ID7 < ID2 < ID4 < ID5 (Table 8). Findings showed that ID5 had the greatest VOC value, indicating the possibility that it may be utilized in efficient OSC.
The fill factor (FF) is an essential factor in determining the PV system's PCE. The VOC present at the interface of the acceptor–donor materials has a major impact on FF. The FF of all the compounds in our investigation were determined using the following formula (8).79
 | (8) |
In eqn (8),  is the normalized VOC. Where e is average charge with a value of 1. KB is the Boltzmann constant and T is temperature of 300 K. The final findings show that compared to the original molecule, ID5 has better normalized VOC and FF (64.59 and 0.9210) as compared to the IDR molecule (56.47 and 0.9121), respectively (Table 8). On a side note, the FF values of the molecules, as studied computationally, are much higher than the possible experimental ones. However, they give an appropriate estimate and helps in determination of the molecules with higher experimental FF (though lower than the theoretical one) than other molecules.
PCE is calculated to see whether the PV substance is adequately effective for usage in practical systems and it compiles the relevant parameters of solar equipment's functioning into a single number.80 The PCE of a molecule is majorly influenced by the VOC, FF, and JSC. One of the best representations of this connection is given by eqn (9).
 | (9) |
Using the aforementioned formulae, this study computationally calculates the VOC and FF for the molecules IDR and ID1–ID7; however, the JSC was not computed owing to limited capabilities. It has been shown previously how LHE is one of the variables used to calculate the JSC. The newly created molecule in this study, ID5, has been shown to have higher PCE than IDR, as expected by the increased VOC and FF.
4. Conclusion
In this study, seven small acceptor-molecules (ID1–ID7) were computationally designed to optimize OSC performance by modifying the reference molecule's (IDR) EG acceptor. Our calculations of the new compounds' optoelectronic properties, using the B3LYP/6-31G(d,p) level of theory, are equated to those of the original molecule. The Egap of every recently proposed molecule has decreased (2.11–2.23 eV) as opposed to IDR (2.24 eV), with the exception of ID5 (2.37 eV). The ID1 has the largest EA (3.37 eV) and ID5 possesses the smallest IP (6.25 eV) in this study. Except ID5, all newly designed molecules have bathochromic shift in their λmax. The λmax of ID1–ID4, ID6 and ID7 molecules are 702 nm, 673 nm, 685 nm, 673 nm, 725 nm and 675 nm, respectively. LHE of ID2 and ID4 molecules were better than IDR. ID1–ID7 have much higher dipole moment values than IDR, which improves their solubility and crystallinity. ID1–ID3, with their lower RE of λ− (0.1469, 0.1061, and 0.1850 eV), have higher electron mobility than IDR (0.1986 eV). Remarkably, ID1 (0.1687 eV) has the greatest hole mobility of all the studied molecules since its RE for hole mobility has decreased the most. In the present work, the HOMO of PTB7-Th donor was coupled with the LUMO of the studied NFAs (IDR, ID1–ID7) to produce the maximum and ID5 molecules have a higher VOC value (1.67 eV) than IDR molecules do (1.46 eV). These findings suggest that the changed molecules deserve additional research as a means to develop OSC with improved photovoltaic performance.Conflicts of interest
The authors declare no conflict of interest.Acknowledgements
The authors acknowledge the technical support from Department of Chemistry University of Agriculture, Faisalabad, Pakistan. The authors from the King Khalid University extend their appreciation to Deanship of Scientific Research at King Khalid University for funding the work through the general research project (GRP-311-43). The authors would like to thank the Deanship of Scientific Research at Umm Al-Qura University for supporting this work by Grant Code: (22UQU4331174DSR51). We also thank Dr Khurshid Ayub, COMSATS University, Islamabad for additional resource.References
- Y. Liu, et al., Aggregation and morphology control enables multiple cases of high-efficiency polymer solar cells, Nat. Commun., 2014, 5(1), 1–8 Search PubMed.
- G. Li, et al., High-efficiency solution processable polymer photovoltaic cells by self-organization of polymer blends, Nat. Mater., 2005, 4(11), 864–868 CrossRef CAS.
- G. Li, R. Zhu and Y. Yang, Polymer solar cells, Nat. Photonics, 2012, 6(3), 153–161 CrossRef CAS.
- C. J. Traverse, et al., Emergence of highly transparent photovoltaics for distributed applications, Nat. Energy, 2017, 2(11), 849–860 CrossRef.
- Q. Tai and F. Yan, Emerging semitransparent solar cells: materials and device design, Adv. Mater., 2017, 29(34), 1700192 CrossRef PubMed.
- Y. Li, Molecular Design of Photovoltaic Materials for Polymer Solar Cells: Toward Suitable Electronic Energy Levels and Broad Absorption, Acc. Chem. Res., 2012, 45(5), 723–733 CrossRef CAS PubMed.
- R. Søndergaard, et al., Roll-to-roll fabrication of polymer solar cells, Mater. Today, 2012, 15(1–2), 36–49 CrossRef.
- L. Ye, et al., Surpassing 10% efficiency benchmark for nonfullerene organic solar cells by scalable coating in air from single nonhalogenated solvent, Adv. Mater., 2018, 30(8), 1705485 CrossRef PubMed.
- P. Cheng, et al., Ternary system with controlled structure: a new strategy toward efficient organic photovoltaics, Adv. Mater., 2018, 30(8), 1705243 CrossRef PubMed.
- S. Li, et al., An unfused-core-based nonfullerene acceptor enables high-efficiency organic solar cells with excellent morphological stability at high temperatures, Adv. Mater., 2018, 30(6), 1705208 CrossRef PubMed.
- E. U. Rashid, et al., Synergistic end-capped engineering on non-fused thiophene ring-based acceptors to enhance the photovoltaic properties of organic solar cells, RSC Adv., 2022, 12(20), 12321–12334 RSC.
- M. Li, et al., Solution-processed organic tandem solar cells with power conversion efficiencies > 12%, Nat. Photonics, 2017, 11(2), 85–90 CrossRef CAS.
- X. Che, et al., High fabrication yield organic tandem photovoltaics combining vacuum-and solution-processed subcells with 15% efficiency, Nat. Energy, 2018, 3(5), 422–427 CrossRef CAS.
- Y. Zhou, et al., High efficiency small molecular acceptors based on novel O-functionalized ladder-type dipyran building block, Nano Energy, 2018, 45, 10–20 CrossRef CAS.
- G. Zhang, et al., Efficient nonfullerene polymer solar cells enabled by a novel wide bandgap small molecular acceptor, Adv. Mater., 2017, 29(18), 1606054 CrossRef PubMed.
- J. Hou, et al., Organic solar cells based on non-fullerene acceptors, Nat. Mater., 2018, 17(2), 119–128 CrossRef CAS PubMed.
- Z. Yao, et al., Dithienopicenocarbazole-based acceptors for efficient organic solar cells with optoelectronic response over 1000 nm and an extremely low energy loss, J. Am. Chem. Soc., 2018, 140(6), 2054–2057 CrossRef CAS PubMed.
- J.-S. Wu, et al., Donor–acceptor conjugated polymers based on multifused ladder-type arenes for organic solar cells, Chem. Soc. Rev., 2015, 44(5), 1113–1154 RSC.
- H. Yao, et al., Molecular design of benzodithiophene-based organic photovoltaic materials, Chem. Rev., 2016, 116(12), 7397–7457 CrossRef CAS PubMed.
- G. Y. Ge, et al., Unveiling the Interplay among End Group, Molecular Packing, Doping Level, and Charge Transport in N-Doped Small-Molecule Organic Semiconductors, Adv. Funct. Mater., 2022, 32(7), 2108289 CrossRef CAS.
- J. Sun, et al., Dithieno[3,2-b:2′,3′-d]pyrrol fused nonfullerene acceptors enabling over 13% efficiency for organic solar cells, Adv. Mater., 2018, 30(16), 1707150 CrossRef PubMed.
- S. Zhang, et al., Over 14% efficiency in polymer solar cells enabled by a chlorinated polymer donor, Adv. Mater., 2018, 30(20), 1800868 CrossRef PubMed.
- Z. Fei, et al., An alkylated indacenodithieno[3,2-b]thiophene-based nonfullerene acceptor with high crystallinity exhibiting single junction solar cell efficiencies greater than 13% with low voltage losses, Adv. Mater., 2018, 30(8), 1705209 CrossRef PubMed.
- S. j. Xu, et al., A Twisted Thieno[3,4-b]thiophene-Based Electron Acceptor Featuring a 14-π-Electron Indenoindene Core for High-Performance Organic Photovoltaics, Adv. Mater., 2017, 29(43), 1704510 CrossRef PubMed.
- H. Bin, et al., 11.4% Efficiency non-fullerene polymer solar cells with trialkylsilyl substituted 2D-conjugated polymer as donor, Nat. Commun., 2016, 7(1), 1–11 Search PubMed.
- Y. Lin, et al., An electron acceptor challenging fullerenes for efficient polymer solar cells, Adv. Mater., 2015, 27(7), 1170–1174 CrossRef CAS PubMed.
- Y. Lin, et al., A facile planar fused-ring electron acceptor for as-cast polymer solar cells with 8.71% efficiency, J. Am. Chem. Soc., 2016, 138(9), 2973–2976 CrossRef CAS PubMed.
- B. Guo, et al., High efficiency nonfullerene polymer solar cells with thick active layer and large area, Adv. Mater., 2017, 29(36), 1702291 CrossRef PubMed.
- Z. Liang, et al., Optimization requirements of efficient polythiophene: nonfullerene organic solar cells, Joule, 2020, 4(6), 1278–1295 CrossRef CAS.
- L. Cai, et al., 4,9-Dihydro-4,4,9,9-tetrahexyl-s-indaceno[1,2-b:5,6-b′]dithiophene as a π-spacer of donor–π–acceptor dye and its photovoltaic performance with liquid and solid-state dye-sensitized solar cells, Org. Lett., 2014, 16(1), 106–109 CrossRef CAS PubMed.
- X. Li, et al., Simplified synthetic routes for low cost and high photovoltaic performance n-type organic semiconductor acceptors, Nat. Commun., 2019, 10(1), 1–11 CrossRef PubMed.
- E. U. Rashid, et al., Engineering of W-shaped benzodithiophenedione-based small molecular acceptors with improved optoelectronic properties for high efficiency organic solar cells, RSC Adv., 2022, 12(34), 21801–21820 RSC.
- K. Lin, et al., Star-shaped electron acceptors containing a truxene core for non-fullerene solar cells, Org. Electron., 2018, 52, 42–50 CrossRef CAS.
- M. Frisch, et al., Gaussian 09, revision D.01, Gaussian, Inc., Wallingford, CT, 2009 Search PubMed.
- R. Dennington, T. A. Keith and J. M. Millam, GaussView, version 6.0.16, Semichem Inc., Shawnee Mission, KS, 2016 Search PubMed.
- B. Civalleri, et al., B3LYP augmented with an empirical dispersion term (B3LYP-D*) as applied to molecular crystals, CrystEngComm, 2008, 10(4), 405–410 RSC.
- T. Yanai, D. P. Tew and N. C. Handy, A new hybrid exchange–correlation functional using the Coulomb-attenuating method (CAM-B3LYP), Chem. Phys. Lett., 2004, 393(1–3), 51–57 CrossRef CAS.
- C. Adamo and V. Barone, Exchange functionals with improved long-range behavior and adiabatic connection methods without adjustable parameters: the mPW and mPW1PW models, J. Chem. Phys., 1998, 108(2), 664–675 CrossRef CAS.
- J.-D. Chai and M. Head-Gordon, Long-range corrected hybrid density functionals with damped atom–atom dispersion corrections, Phys. Chem. Chem. Phys., 2008, 10(44), 6615–6620 RSC.
- J. Tomasi, B. Mennucci and R. Cammi, Quantum mechanical continuum solvation models, Chem. Rev., 2005, 105(8), 2999–3094 CrossRef CAS PubMed.
- L. Deschenes and A. David, Origin 6.0: Scientific Data Analysis and Graphing Software Origin Lab Corporation (Formerly Microcal Software, Inc.), Vanden Bout University of Texas, 2000, p. 595, http://www.originlab.com Search PubMed.
- T. Lu and F. Chen, Multiwfn: a multifunctional wavefunction analyzer, J. Comput. Chem., 2012, 33(5), 580–592 CrossRef CAS PubMed.
- A. L. Tenderholt, PyMOlyze: A Program to Analyze Quantum Chemistry Calculations, 2019 Search PubMed.
- S. Alexander and R. Orbach, Density of states on fractals: “fractons”, J. Phys., Lett., 1982, 43(17), 625–631 CrossRef.
- Z. Shuai, et al., Applying Marcus theory to describe the carrier transports in organic semiconductors: limitations and beyond, J. Chem. Phys., 2020, 153(8), 080902 CrossRef CAS PubMed.
- E. U. Rashid, et al., Depicting the role of end-capped acceptors to amplify the photovoltaic properties of benzothiadiazole core-based molecules for high-performance organic solar cell applications, Comput. Theor. Chem., 2022, 1211, 113669 CrossRef.
- G. R. Hutchison, M. A. Ratner and T. J. Marks, Hopping transport in conductive heterocyclic oligomers: reorganization energies and substituent effects, J. Am. Chem. Soc., 2005, 127(7), 2339–2350 CrossRef CAS PubMed.
- M. U. Saeed, et al., Structural modification on dimethoxythienothiophene based non-fullerene acceptor molecule for construction of high-performance organic chromophores by employing DFT approach, J. Phys. Chem. Solids, 2022, 170, 110906 CrossRef CAS.
- E. U. Rashid, et al., Quantum chemical modification of indaceno dithiophene-based small acceptor molecules with enhanced photovoltaic aspects for highly efficient organic solar cells, RSC Adv., 2022, 12(44), 28608–28622 RSC.
- I. N. Levine, D. H. Busch and H. Shull, Quantum chemistry, Pearson Prentice Hall, Upper Saddle River, NJ, 2009, vol. 6 Search PubMed.
- J. Zhou, et al., Small molecules based on benzo[1,2-b:4,5-b′]dithiophene unit for high-performance solution-processed organic solar cells, J. Am. Chem. Soc., 2012, 134(39), 16345–16351 CrossRef CAS PubMed.
- A. Altis, et al., Dihedral angle principal component analysis of molecular dynamics simulations, J. Chem. Phys., 2007, 126(24), 244111 CrossRef PubMed.
- S. Yang and M. Kertesz, Bond length alternation and energy band gap of polyyne, J. Phys. Chem. A, 2006, 110(31), 9771–9774 CrossRef CAS PubMed.
- M. Ans, J. Iqbal, Z. Ahmad, S. Muhammad, R. Hussain, B. Eliasson and K. Ayub, Designing three-dimensional (3D) non-fullerene small molecule acceptors with efficient photovoltaic parameters, ChemistrySelect, 2018, 3(45), 12797–12804 CrossRef CAS.
- M. Salim, et al., Amplifying the photovoltaic properties of azaBODIPY core based small molecules by terminal acceptors modification for high performance organic solar cells: a DFT approach, Sol. Energy, 2022, 233, 31–45 CrossRef CAS.
- B. R. Sutherland, Solar materials find their band gap, Joule, 2020, 4(5), 984–985 CrossRef.
- U. Azeem, et al., Tuning of a A–A–D–A–A-Type Small Molecule with Benzodithiophene as a Central Core with Efficient Photovoltaic Properties for Organic Solar Cells, ACS Omega, 2021, 6(43), 28923–28935 CrossRef CAS PubMed.
- J. Widmer, et al., Open-circuit voltage and effective gap of organic solar cells, Adv. Funct. Mater., 2013, 23(46), 5814–5821 CrossRef CAS.
- A. Farhat, et al., Tuning the optoelectronic properties of subphthalocyanine (SubPc) derivatives for photovoltaic applications, Opt. Mater., 2020, 107, 110154 CrossRef CAS.
- E. U. Rashid, et al., Quantum chemical modification of indaceno dithiophene-based small acceptor molecules with enhanced photovoltaic aspects for highly efficient organic solar cells, RSC Adv., 2022, 12(44), 28608–28622 RSC.
- I. Zubair, et al., Tuning the optoelectronic properties of indacenodithiophene based derivatives for efficient photovoltaic applications: a DFT approach, Chem. Phys. Lett., 2022, 793, 139459 CrossRef CAS.
- M. U. Saeed, et al., End-capped modification of Y-shaped dithienothiophen[3,2-b]-pyrrolobenzothiadiazole (TPBT) based non-fullerene acceptors for high performance organic solar cells by using DFT approach, Surf. Interfaces, 2022, 30, 101875 CrossRef CAS.
- M. Rafiq, et al., End-capped modification of dithienosilole based small donor molecules for high performance organic solar cells using DFT approach, J. Mol. Liq., 2022, 345, 118138 CrossRef CAS.
- M. Ans, et al., Designing alkoxy-induced based high performance near infrared sensitive small molecule acceptors for organic solar cells, J. Mol. Liq., 2020, 305, 112829 CrossRef CAS.
- A. Sharif, et al., Tuning the optoelectronic properties of dibenzochrysene (DBC) based small molecules for organic solar cells, Mater. Sci. Semicond. Process., 2021, 127, 105689 CrossRef CAS.
- M. Rani, et al., Strategies toward the end-group modifications of indacenodithiophene based non-fullerene small molecule acceptor to improve the efficiency of organic solar cells; a DFT study, Comput. Theor. Chem., 2022, 113747 CrossRef CAS.
- M. Waqas, et al., Impact of end-capped modification of MO-IDT based non-fullerene small molecule acceptors to improve the photovoltaic properties of organic solar cells, J. Mol. Graphics Modell., 2022, 116, 108255 CrossRef CAS PubMed.
- M. R. Aslam, et al., Tuning of diphenylamine subphthalocyanine based small molecules with efficient photovoltaic parameters for organic solar cells, J. Mol. Graphics Modell., 2022, 112, 108146 CrossRef CAS PubMed.
- N. E. Gruhn, et al., The vibrational reorganization energy in pentacene: molecular influences on charge transport, J. Am. Chem. Soc., 2002, 124(27), 7918–7919 CrossRef CAS PubMed.
- H. Yao, et al., 14.7% efficiency organic photovoltaic cells enabled by active materials with a large electrostatic potential difference, J. Am. Chem. Soc., 2019, 141(19), 7743–7750 CrossRef CAS PubMed.
- P. Å. Malmqvist, Calculation of transition density matrices by nonunitary orbital transformations, Int. J. Quantum Chem., 1986, 30(4), 479–494 CrossRef CAS.
- A. Luzanov, A. Sukhorukov and V. Umanskii, Application of transition density matrix for analysis of excited states, Theor. Exp. Chem., 1976, 10(4), 354–361 CrossRef.
- P. Gong, et al., Ultrafast Kinetics Investigation of a Fluorinated-Benzothiadiazole Polymer with an Increased Excited State Transition Dipole Moment Applied in Organic Solar Cells, ACS Appl. Energy Mater., 2021, 4(9), 9627–9638 CrossRef CAS.
- Y. A. Duan, et al., Theoretical characterization and design of small molecule donor material containing naphthodithiophene central unit for efficient organic solar cells, J. Comput. Chem., 2013, 34(19), 1611–1619 CrossRef CAS PubMed.
- A. Rasool, et al., Bithieno Thiophene-Based Small Molecules for Application as Donor Materials for Organic Solar Cells and Hole Transport Materials for Perovskite Solar Cells, ACS Omega, 2021, 7(1), 844–862 CrossRef PubMed.
- I. Zubair, et al., Designing the optoelectronic properties of BODIPY and their photovoltaic applications for high performance of organic solar cells by using computational approach, Mater. Sci. Semicond. Process., 2022, 148, 106812 CrossRef CAS.
- J. Sun, et al., High performance non-fullerene polymer solar cells based on PTB7-Th as the electron donor with 10.42% efficiency, J. Mater. Chem. A, 2018, 6(6), 2549–2554 RSC.
- M. C. Scharber, et al., Design rules for donors in bulk-heterojunction solar cells—towards 10% energy-conversion efficiency, Adv. Mater., 2006, 18(6), 789–794 CrossRef CAS.
- J. D. Chen, et al., Single-junction polymer solar cells exceeding 10% power conversion efficiency, Adv. Mater., 2015, 27(6), 1035–1041 CrossRef CAS PubMed.
- R. Rajeswari, et al., Recent progress and emerging applications of rare earth doped phosphor materials for dye-sensitized and perovskite solar cells: a review, Chem. Rec., 2020, 20(2), 65–88 CrossRef CAS PubMed.
| This journal is © The Royal Society of Chemistry 2023 |

