 Open Access Article
Effects of CO2 atmosphere on low-rank coal pyrolysis based on ReaxFF molecular dynamics
Chenkai Gu ,
Jing Jin*,
Ye Li,
Ruiyang Li and
Bo Dong
School of Energy and Power Engineering, University of Shanghai for Science and Technology, 516 Jungong Road, Shanghai 200093, P. R. China. E-mail: jinjingusst@163.com
First published on 11th January 2023
Abstract
Pyrolysis of low-rank coal in CO2 atmosphere can reduce carbon emissions while comprehensively utilizing coal resources. Based on ReaxFF molecular dynamics (ReaxFF-MD), the pyrolysis processes of low-rank coal in inert and CO2 atmosphere are simulated. By comparing the evolution of pyrolysis products, the influences of CO2 on the pyrolysis characteristic and product distribution are analyzed. It is found that CO2 slightly inhibits the conversion of char to tar in the early stage of pyrolysis. In the later stage, CO2 significantly promotes the decomposition of char and increases the yield of tar and pyrolysis gas. According to the different bond breaking behaviors of coal molecules, the pyrolysis process can be divided into pyrolysis activation stage, initial pyrolysis stage, accelerated pyrolysis stage and secondary pyrolysis stage. The reforming reaction of CO2 with alkanes generates free hydrogen radicals, which promotes the cleavage of ether bond, Car–Car bridge bond and aliphatic C–C bond. Compared with in inert atmosphere, final yield of light tar in CO2 atmosphere increases from 17.98% to 20.68%. In general, the CO2 atmosphere helps to improve the tar yield and tar quality of low-rank coal pyrolysis.
1 Introduction
Coal is the most abundant fossil fuel in China, and the proved reserves of low-rank coal account for more than half of the total.1,2 Low-rank coal has the characteristics of low heat value, high moisture and high volatility. The direct combustion of low-rank coal will lead to low energy efficiency, high pollutant emissions and waste of high value components in volatiles.3 Pyrolysis is an effective coal conversion technology and the initial reaction step of most coal utilization processes. The poly-generation technology based on coal pyrolysis can produce pyrolysis gas with high heat value, upgraded coal tar, clean solid fuel coke and other high-value products to realize multi-level and efficient utilization of coal resources.4 In recent years, high CO2 emissions have caused many environmental problems. CO2 capture, utilization, and storage (CCUS) technology is the best option to reduce global warming while addressing the energy crisis.5 Replacing the inert gas used in coal pyrolysis with CO2 is a promising way to utilize CO2. Various coal conversion processes have been involved in the gasification and pyrolysis of coal in CO2 atmosphere, such as CO2-enhanced gasification,6 CO2 reforming of methane and coal pyrolysis (CRMP)7,8 and IGCC process with CO2 recycles.9–11The main products of coal pyrolysis are char, tar and pyrolysis gas. The tar can be used for producing high value chemicals, but its quality is not satisfactory because of abundant heavy components.12 Heavy tar with high viscosity and causticity are harmful to subsequent apparatus and operations.13 As much light tar as possible is expected to be obtained during coal pyrolysis. The use of CO2 as pyrolysis atmosphere may affect the product distribution and tar composition. Therefore, it is of great practical value to study the effects of CO2 atmosphere on low-rank coal pyrolysis.
Many scholars have studied the characteristics of coal pyrolysis in CO2 atmosphere. For example, Lee et al.14 carried out pyrolysis experiments of peat in a quartz tube reactor in N2 and CO2 atmospheres, and found that CO2 increased the decomposition rate of peat in the range of 630–728 °C. However, CO2 reacted with volatile organic compounds, which reduced the yield of tar. Wang et al.15 conducted pyrolysis experiments of Shendong coal in different atmospheres (N2, H2, CH4 and CO2) with a vertical fixed-bed reactor. The results showed that CO2 atmosphere could promote the increase of tar yield compared with N2, H2 and CH4. Jamil et al.16 carried out slow (1 °C s−1) and fast (1000 °C s−1) pyrolysis experiments of Victoria lignite in He and CO2 atmosphere with a wire mesh reactor and concluded that CO2 had no significant effect on tar yield and tar composition. The above studies indicate that the effect of CO2 atmosphere on the distribution of coal pyrolysis products is still controversial, especially for tar. Moreover, there are few researches focus on the influence mechanism of CO2.
The pyrolysis process is accompanied by the generation, cross-linking and stabilization of free radicals. The reaction of free radicals plays a key role in the distribution of pyrolysis products. Due to the high activity and short existence time of free radicals, it is difficult to track the dynamic evolution tendencies of functional groups and free radicals even with the most advanced experimental techniques.17 With the rapid development of modern computing power, ReaxFF molecular dynamics (ReaxFF-MD) simulation has become an effective calculation method to study the coal pyrolysis from a microscopic perspective.
As a principal method to study chemical reactions, Quantum Chemistry (QC) can accurately locate the transition states and chemical reaction pathways.18 However, the high computational cost of QC limits its application in macromolecular models.19 Molecular Dynamics (MD) based on classical principles incurs much lower computational costs but it is not suitable for exploring the development of chemical bonds.20 The ReaxFF is an empirical force field proposed by van Duin and Goddard et al., which can describe the breaking and formation of chemical bonds in complex reaction systems.21,22 ReaxFF-MD combines MD with ReaxFF to obtain the motion trajectory of the system by calculating the state of atoms with time step. It allows simulating the chemical reaction of large and complicated molecular systems without setting the reaction pathways in advance, which makes it applicable for coal pyrolysis simulation.23
ReaxFF-MD method has been used by many scholars to study coal pyrolysis process.24,25 In these researches, the simulation results of ReaxFF-MD are qualitatively consistent with the experimental data, indicating that this method can accurately describe the reaction process of coal pyrolysis. Nevertheless, the effects of CO2 atmosphere on low-rank coal pyrolysis are rarely studied with ReaxFF-MD method. It is necessary to study the pyrolysis reaction from the microscopic perspective in order to explore its mechanism. This study has guiding significance in engineering for the clean utilization of low-rank coal and CO2 emission reduction.
2 Experimental and computational methods
2.1 Coal sample preparation and pyrolysis
In this study, a low-rank coal from Naomaohu in Xinjiang, China (NMH coal for short) was selected as the pyrolysis sample. The proximate and ultimate analyses of NMH coal are listed in Table 1. The volatile content of NMH coal accounts for 36.97%, which is suitable for coal pyrolysis and tar production. Before the experiment, the samples were dried in a vacuum oven at 105 °C for 6 hours to constant weight. After drying, the samples were ground and sieved to ensure that the particle size is less than 180 μm.TG-MS is a combination of Netzsch STA 449C thermogravimetric analyzer and Netzsch QMS 403 mass spectrometer. The samples with mass of (10 ± 0.01) mg were placed in an Al2O3 crucible and pyrolyzed in argon and CO2 atmosphere, respectively. The furnace was heated from 50 °C to 700 °C at heating rate of 10 K min−1 with purging gas flow of 50 mL min−1 and protective gas flow of 30 mL min−1.
2.2 Simulation details
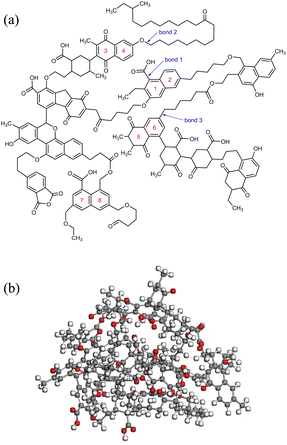
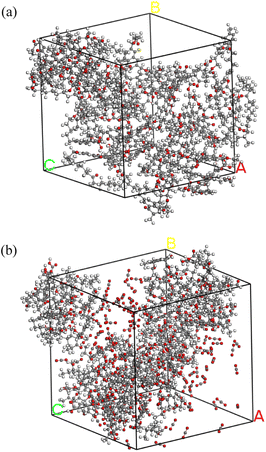
The chemical structure of coal consists of various covalent and non-covalent interactions, which is the basis of understanding the coal pyrolysis process.26 Based on proximate analysis, ultimate analysis and 13C-NMR, Mo Zheng27 constructed a molecular model of NMH coal and used it for ReaxFF-MD simulation of pyrolysis tar product. The simulation data was in great agreement with the experimental data. Both the coal samples of this paper and Mo Zheng were produced in Naomaohu, and the proximate and ultimate analysis are highly similar, as shown in Table 1. Therefore, we consider the coal to be the same as Mo Zheng's and directly adopted his coal molecular model C194H215O43. Fig. 1(a) presents the planar structure of C194H215O43. After geometry optimization of the planar structure, three-dimensional structure of coal molecules used in simulation was obtained, as shown in Fig. 1(b).Subsequently, 5 NMH coal molecules were assembled into a periodic cube to obtain the inert atmosphere reaction system. Similarly, the CO2 atmosphere reaction system was assembled using 5 NMH coal molecules and 150 CO2 molecules. The NPT ensemble was used for dynamic equilibrium at room temperature and one atmospheric pressure to optimize the model as much as possible. The final pyrolysis reaction systems in inert and CO2 atmosphere are shown in Fig. 2.
Pyrolysis was completed by heating the system from 300 K to 2600 K at heating rate of 10 K ps−1. In all simulations, the time step was 0.1 fs. Reaction temperature was controlled by Berendson thermostat with a 100 fs damping constant. All the simulations were carried out using the ReaxFF code in LAMMPS platform.
The product molecules in the simulation are classified according to the number of carbon atoms.28 C40+ fragments are considered as char that cannot be evaporated at high temperatures. C5–C13 and C14–C40 fragments are respectively thought to be light tar and heavy tar, which are liquid in normal temperature. Pyrolysis gas consists of inorganic gases and C1–C4 organic fragments.
3 Results and discussion
3.1 Experiment verification
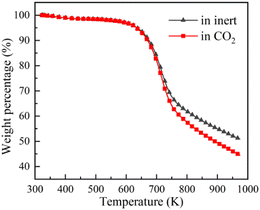
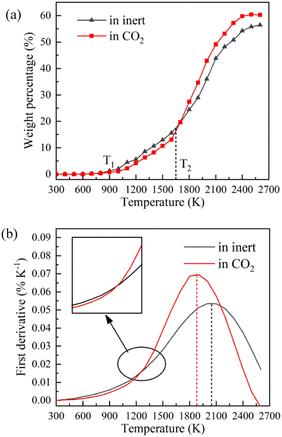
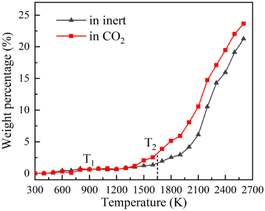
TG-MS enables real-time monitoring of char and pyrolysis gas yield. The residual solid weight percentage is the yield of char. Ion current density of pyrolysis gas components is used to monitor the yield of pyrolysis gases. The tar is commonly analysed for final yield and composition after pyrolysis. There are still great difficulties in real-time monitoring of tar components, so it is essential to carry out research through simulation.Firstly, the accuracy of ReaxFF-MD simulation is verified by the evolution trend of char and pyrolysis gas. The weight loss curves of NMH coal pyrolysis obtained by experiments is shown in Fig. 3, while the evolution of char weight percentage in simulation is presented in Fig. 4(a). It can be discovered that the char yield in two atmospheres is not much different in the early stage of pyrolysis. And the char yield in CO2 is significantly lower than that in inert at the later stage. Although the effect of CO2 in the early stage is slightly overestimated, the simulation results of char yield are basically consistent with the experimental data.
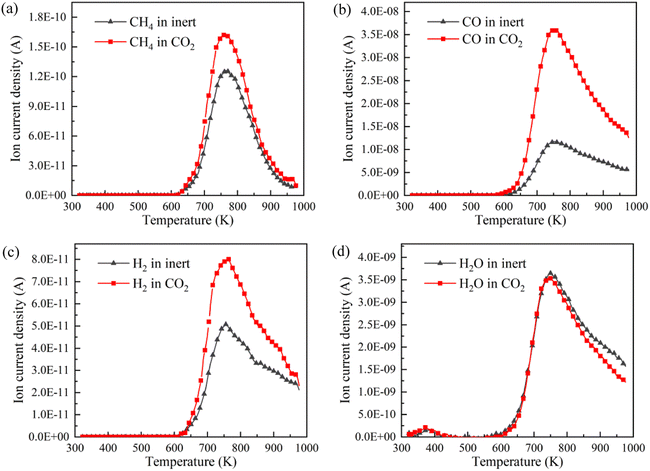
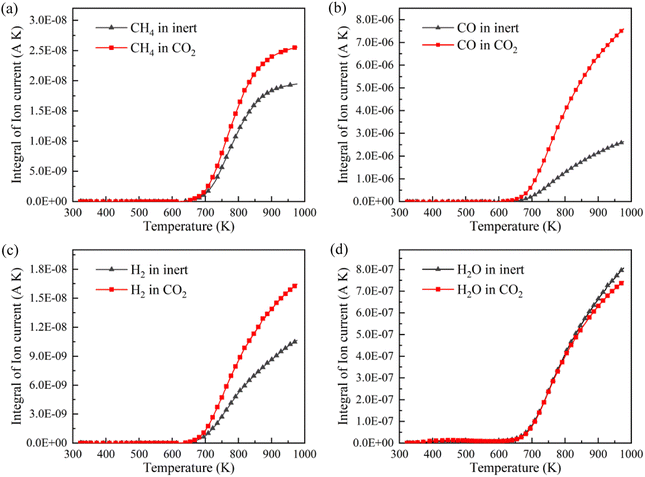
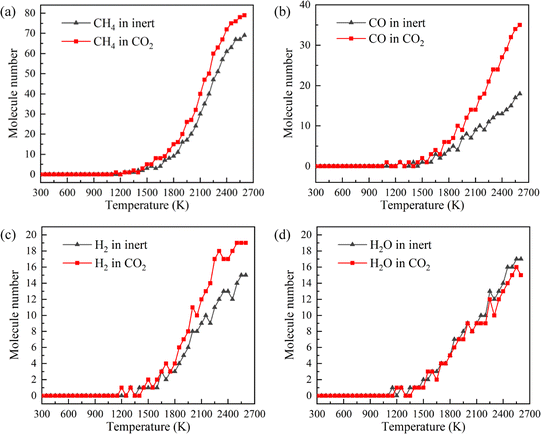
CH4, CO, H2 and H2O are the representative components of pyrolysis gas. The ion current intensities of CH4, CO, H2 and H2O detected by TG-MS are shown in Fig. 5, implying the generation rate of different pyrolysis gas components. Moreover, the mathematical integral of ion current intensity is presented in Fig. 6, which is proportional to the yield of pyrolysis gases. The variation of molecule numbers in simulation with temperature is displayed in Fig. 7. Fig. 6 and 7 reflect the experimental and simulation results of the evolution trend of pyrolysis gases yield, respectively. Their consistency indicates that the molecular model and calculation method are competent for the simulation of NMH coal pyrolysis.
It should be noted that the simulation temperature is much higher than the experimental temperature. This is because current molecular simulation computing ability is on nanosecond and nanometer scale, while the experimental observation capability is on second and millimeter scale. Generally, the simulation temperature is raised to ensure that reactions completed within an acceptable calculation time. Although there are differences on time and temperature scales between simulation and experiment, previous studies have illustrated that simulation results are qualitatively consistent with actual product evolution trend and reaction mechanism.29,30
3.2 Evolution of three-phase pyrolysis products
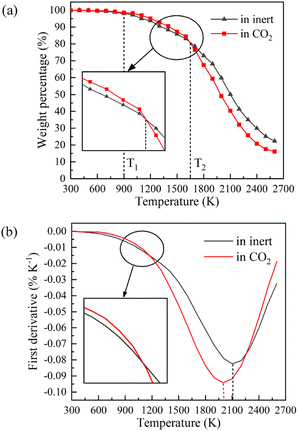
Fig. 4 displays the char weight loss curves obtained from ReaxFF-MD simulation and its first derivative. The char yield decreases with the increase of temperature in both atmospheres. Before 900 K (T1), the weight of char is basically constant, and coal pyrolysis is in an unactivated state. At about 1650 K (T2), the char yields in both groups are 80.8%. Between T1 and T2, the char yield in CO2 atmosphere is marginally higher than that in inert atmosphere, indicating that CO2 may have a certain inhibitory effect on char cracking in the early stage of pyrolysis. After T2, the weight loss rate increases evidently, and then decreases after reaching the peak. During this period, the char yield in CO2 atmosphere is always much lower than that in inert atmosphere. It implies that CO2 prominently promotes the decomposition of char in the later stage of reaction, making coal pyrolysis more complete. From Fig. 4(b), it can also be found that the maximum weight loss peak in CO2 atmosphere arrives earlier and the absolute value is larger. Char in CO2 atmosphere is easier to pyrolyze and has higher reaction rate.Evolution trend of tar in simulation are presented in Fig. 8. Before T1, there is almost no tar generation. Between T1 and T2, the tar yield in CO2 atmosphere is slightly lower than that in inert atmosphere. After T2, the tar yield in CO2 atmosphere is significantly higher. The evolution trend of tar yield is in great agreement with the weight loss of char. As depicted in Fig. 8(b), the tar generation rate reaches a maximum of 0.069% K−1 at about 1900 K in CO2 and 0.053% K−1 at about 2050 K in inert atmosphere. Compared with in inert atmosphere, the maximum generation rate of tar in CO2 atmosphere is about 30% higher. CO2 observably promotes the formation of tar during coal pyrolysis.
Fig. 9 is the evolution trend of pyrolysis gases in simulation. In the early stage of pyrolysis, only a small amount of pyrolysis gas is produced, and the pyrolysis gas yields in two atmospheres are essentially the same. Pyrolysis gas is generated in large quantities with the increase of temperature, and the yield of pyrolysis gas is higher in CO2 atmosphere.
Comparing the evolution of three-phase pyrolysis products in inert and CO2 atmosphere, it can be concluded that CO2 slightly inhibits the pyrolysis of NMH coal in the early stage of reaction. In the later stage of pyrolysis, CO2 significantly promotes the decomposition of char and the formation of tar and pyrolysis gas. The pyrolysis in CO2 atmosphere is more complete and the final yield of tar increases from 56.39% to 60.28%.
3.3 Evolution mechanism of light and heavy tar
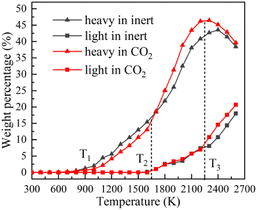
In order to explore the effect of CO2 on the quality of pyrolysis tar, the evolving profiles of light and heavy tar is studied, as shown in Fig. 10. By monitoring the dynamic process of NMH coal pyrolysis, the chemical bond breaking and formation behaviours of coal molecules are studied in order to thoroughly investigate the influence mechanism of CO2.Before T1, the coal molecules in system are quite stable. Carboxyl (–COOH) is the most unstable oxygen-containing functional group in coal molecule. The chemical bonds between carboxyl groups and the main body of coal molecule begin to break, such as bond 1 in Fig. 11(a). The detached carboxyl groups decompose into CO2 and hydrogen radicals. Coal has almost no weight loss because the main body has not been destroyed. In this stage, few reactions can occur because of the low temperature, and the impact of CO2 can be ignored. The stage before T1 is defined as the pyrolysis activation stage (stage I).
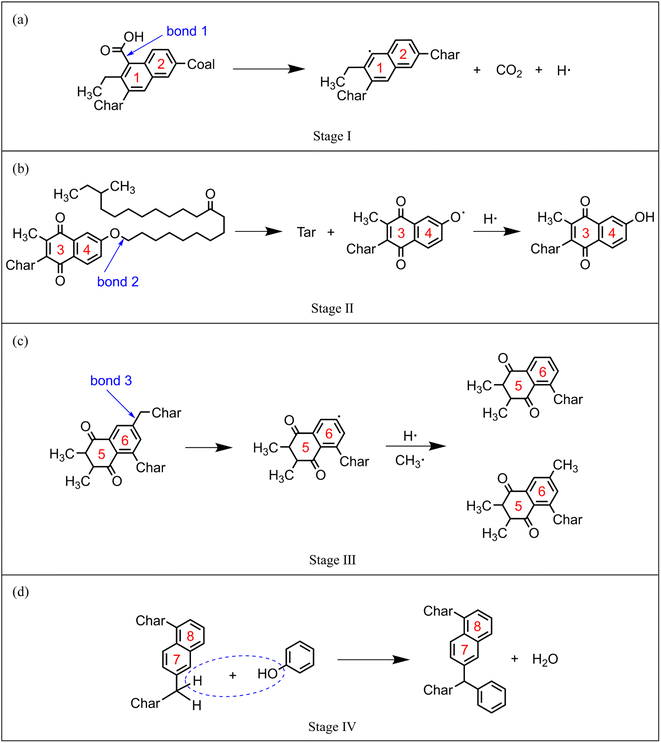 | ||
| Fig. 11 Typical reaction pathways in each pyrolysis stage: (a) stage I, (b) stage II, (c) stage III, (d) stage IV. | ||
Between T1 and T2, the linear ether bond (–O–CH2–) reaches the activation condition as well. As shown in Fig. 11(b), the coal molecule splits into two relatively small activated fragments when bond 2 breaks. The activated fragments combine with free radicals to form stable product molecules. The number of carbon atoms in product molecule decreases with the fracture of ether bonds. Pyrolysis tar begins to be formed, which is liquid at room temperature. The generated tar is mainly heavy component, whose carbon atoms number is mostly between 14 and 40. Fig. 10 shows that the yield of heavy tar in CO2 atmosphere is slightly lower than that in inert atmosphere. By analysing the trajectories of ReaxFF-MD simulations in CO2 atmosphere, we find that some CO2 react with hydrogen radicals to form aliphatic. Considering from the perspective of effective collision theory, the occurrence of chemical reaction requires both activated molecule and effective collision. The combination of CO2 and hydrogen radicals decreases the concentration of free hydrogen radicals. The chances of effective collision between ether bond and free hydrogen radicals are reduced, which inhibits the formation of tar. However, oxygen-containing fragments produced by ether bond cleavage are strong hydrogen receptors, which easily bind to hydrogen radicals to form hydroxyl groups. Therefore, the inhibitory effect of CO2 is very limited. In this stage, the main reaction is ether bond breaking and generating heavy tar. CO2 has a slight inhibitory effect on pyrolysis. The stage between T1 and T2 is defined as the initial pyrolysis stage (stage II).
In Fig. 10, the yields of heavy tar begin to decrease near T3 (2250 K). Between T2 and T3, there are two main reactions occurring in the pyrolysis system. One is the bridge bonds (Car–Car) breaking between aromatic groups, and the other is the C–C bonds breaking on aliphatic chains. As shown in Fig. 11(c), the product molecules become smaller with the fracture of bond 3. Parts of the tar become light component, whose carbon atoms number is between 5 and 13. As illustrated in Fig. 4(b) and 8(b), the pyrolysis reaction rate reaches the maximum in this stage. In contrast to stage II, the tar yield in CO2 atmosphere is higher than that in inert atmosphere. At this time, a lot of CH4, C2H6 and other alkanes have been generated in the system. CO2 and alkanes can occur reforming reaction at this temperature, as shown in formula (1). The reforming reaction produces CO and a large number of free hydrogen radicals. Hydrogen radicals can effectively collide with Car–Car bonds and C–C bonds, which promote the decomposition of macromolecules. This stage between T2 and T3 is defined as the accelerated pyrolysis stage (stage III).
 | (1) |
After T3, the yield of heavy tar starts to decrease, while that of light tar increases rapidly. There are two reasons for the reduction of heavy tar. On the one hand, heavy tar continues to crack into light tar. On the other hand, heavy tar starts to convert to char because of the condensation reaction in high temperature. As shown in Fig. 10, the turning point of heavy tar yield in CO2 atmosphere arrives earlier and the decomposition rate of heavy tar is faster, resulting in more light tar. This is due to the fact that more free hydrogen radicals in CO2 atmosphere promote the decomposition of heavy tar. In this stage, the decomposition reaction and condensation reaction compete fiercely. The yield of heavy tar decreases while more light tar is produced. This stage after T3 is defined as secondary pyrolysis stage (stage IV).
At the end of pyrolysis at 2600 K, the yields of char in inert and CO2 atmosphere are 22.36% and 16.08%, respectively. The yields of tar in inert and CO2 atmosphere are 56.39% and 60.28%. Moreover, compared with in inert atmosphere, the yield of light tar is promoted from 17.98% to 20.68% in CO2 atmosphere. It is concluded that CO2 is positive to improve the yield and quality of pyrolysis tar.
Xu et al.31 investigated the pyrolysis characteristics and kinetics of two Chinese low-rank coal samples by thermogravimetric technique and mathematical modeling. The results indicated that Coats–Redfern integral model was appropriate to describe pyrolysis reaction of the two low-rank coals and the pyrolysis process can be divided into four stages according to the calculated activation energy. The experimental calculation results are consistent with the simulation results of this paper, which proves that the simulation of NMH coal pyrolysis based on ReaxFF-MD method is of great reference value.
4 Conclusions
In this paper, NMH low-rank coal pyrolysis in inert and CO2 atmosphere is simulated based on ReaxFF-MD method. The effects of CO2 on coal pyrolysis and the reaction mechanism are studied. The conclusions are as follows:(1) The coal pyrolysis is first slightly inhibited and then significantly promoted by CO2. The pyrolysis in CO2 atmosphere is more complete and the final yield of char decreases from 22.36% to 16.08%.
(2) CO2 helps to improve the pyrolysis tar yield and quality. Compared with in inert atmosphere, the final tar yield in CO2 atmosphere increases from 56.39% to 60.28% and the light tar yield increases from 17.98% to 20.68%.
(3) Coal pyrolysis process can be divided into four stages according to the product distribution and chemical reaction type. In stage I, the carboxyl groups are detached and a small amount of CO2 is produced. In stage II, the ether bonds are broken and the tar products are mainly heavy components. In stage III, disconnection of Car–Car bonds between aromatic groups and C–C bonds on aliphatic chains leads to the generation of light and heavy tars. In stage IV, decomposition reaction and condensation reaction compete fiercely and the yield of heavy tar decreases.
(4) In stage II, CO2 slightly inhibits coal pyrolysis because CO2 scrambles for free hydrogen radicals with ether bonds. In stage III and stage IV, reforming reaction of CO2 with alkanes provides a great deal of hydrogen radicals and promotes the generation of tar.
Conflicts of interest
There are no conflicts to declare.Acknowledgements
This work was supported by the National Natural Science Foundation of China (Grant No. 51976129).Notes and references
- F. Yang, Q. Yu, Z. Qi and Q. Qin, RSC Adv., 2021, 11, 38434–38443 RSC.
- Y. Hu, Z. Wang, X. Cheng and C. Ma, RSC Adv., 2018, 8, 22909–22916 RSC.
- T. Li, Y. Li, Y. Cheng, X. Li, Y. Shen, L. Yan, M. Wang, L. Chang and W. Bao, RSC Adv., 2021, 11, 38537–38546 RSC.
- T. Lv, M. Fang, H. Li, J. Yan, J. Cen, Z. Xia, J. Tian and Q. Wang, RSC Adv., 2021, 11, 17993–18002 RSC.
- T. A. Saleh, RSC Adv., 2022, 12, 23869–23888 RSC.
- T. Chmielniak, M. Sciazko, G. Tomaszewicz and M. Tomaszewicz, J. Therm. Anal. Calorim., 2014, 117, 1479–1488 CrossRef CAS.
- X. He, H. Hu, L. Jin and W. Hua, Energy Sources, Part A, 2016, 38, 613–620 CrossRef CAS.
- P. Wang, L. Jin, J. Liu, S. Zhu and H. Hu, Energy Fuels, 2010, 24, 4402–4407 CrossRef CAS.
- Q. Yi, Y. Fan, W. Li and J. Feng, Ind. Eng. Chem. Res., 2013, 52, 14231–14240 CrossRef CAS.
- Y. Oki, J. Inumaru, S. Hara, M. Kobayashi, H. Watanabe, S. Umemoto and H. Makino, Energy Procedia, 2011, 4, 1066–1073 CrossRef CAS.
- K. R. Jillson, V. Chapalamadugu and B. Erik Ydstie, J. Process Control, 2009, 19, 1470–1485 CrossRef CAS.
- M. Wang, L. Jin, H. Zhao, X. Yang, Y. Li, H. Hu and Z. Bai, Fuel, 2019, 250, 203–210 CrossRef CAS.
- J. Han, X. Wang, J. Yue, S. Gao and G. Xu, Fuel Process. Technol., 2014, 122, 98–106 CrossRef CAS.
- J. Lee, X. Yang, H. Song, Y. S. Ok and E. E. Kwon, Energy, 2017, 120, 929–936 CrossRef CAS.
- P. Wang, L. Jin, J. Liu, S. Zhu and H. Hu, Fuel, 2013, 104, 14–21 CrossRef CAS.
- K. Jamil, J.-i. Hayashi and C.-Z. Li, Fuel, 2004, 83, 833–843 CrossRef CAS.
- X. Li, Z. Mo, J. Liu and L. Guo, Mol. Simul., 2014, 41, 13–27 CrossRef.
- J.-P. Wang, Y.-N. Wang, G.-Y. Li, Z.-Z. Ding, Q. Lu and Y.-H. Liang, Chem. Phys. Lett., 2020, 744, 137214 CrossRef.
- Y. Zhang, C. Liu and X. Chen, J. Anal. Appl. Pyrolysis, 2015, 113, 621–629 CrossRef CAS.
- F. Xu, H. Liu, Q. Wang, S. Pan, D. Zhao, Q. Liu and Y. Liu, Fuel Process. Technol., 2019, 195, 106147 CrossRef CAS.
- A. C. T. van Duin, S. Dasgupta, F. Lorant and W. A. Goddard III, J. Phys. Chem. A, 2001, 105, 9396–9409 CrossRef CAS.
- F. Castro-Marcano, A. M. Kamat, M. F. Russo, A. C. T. van Duin and J. P. Mathews, Combust. Flame, 2012, 159, 1272–1285 CrossRef CAS.
- F. Xu, H. Liu, Q. Wang, S. Pan, D. Zhao and Y. Liu, Fuel, 2019, 256, 115884 CrossRef CAS.
- M. Gao, X. Li and L. Guo, Fuel Process. Technol., 2018, 178, 197–205 CrossRef CAS.
- D. Hong, L. Liu, S. Zhang and X. Guo, Fuel Process. Technol., 2018, 178, 133–138 CrossRef CAS.
- M. Zheng, X. Li, M. Wang and L. Guo, Fuel, 2019, 253, 910–920 CrossRef CAS.
- M. Zheng, X. Li, J. Liu and L. Guo, Energy Fuels, 2013, 27, 2942–2951 CrossRef CAS.
- M. Zheng, X. Li and L. Guo, Fuel, 2018, 233, 867–876 CrossRef CAS.
- Y. Liu, J. Ding and K.-L. Han, Fuel, 2018, 217, 185–192 CrossRef CAS.
- C. Chen, L. Zhao, J. Wang and S. Lin, Ind. Eng. Chem. Res., 2017, 56, 12276–12288 CrossRef CAS.
- Y. Xu, Y. Zhang, G. Zhang, Y. Guo, J. Zhang and G. Li, J. Therm. Anal. Calorim., 2015, 122, 975–984 CrossRef CAS.
| This journal is © The Royal Society of Chemistry 2023 |

![[thin space (1/6-em)]](https://www.rsc.org/images/entities/char_2009.gif)
