 Open Access Article
Wettability of net C, net W and net Y: a molecular dynamics simulation study
Amin Hamzei a,
Hossein Hajiabadi
 b and
Morteza Torabi Rad
 *b
*b
aKerman Graduate University of Technology, Kerman, Iran
bDepartment of Physical Chemistry, School of Chemistry, College of Science, University of Tehran, Tehran, Iran. E-mail: morteza.0mtr0@yahoo.com; mortezatorabirad@ut.ac.ir
First published on 16th January 2023
Abstract
The experimental synthesis of biphenylene, a two-dimensional carbon allotrope, theoretically predicted in 1997, took place in 2021. Biphenylene is also called net C. Two close relatives of this structure, known as net W and net Y, have not yet been experimentally synthesized. In this article, the wettability properties of these three carbon allotropes are investigated, using molecular dynamics simulation. The electronic and mechanical properties of these allotropes have been extensively studied, but their wettability properties are unknown. The chemical structure of the three allotropes is similar and contain four, six, and eight carbon membered rings. The results of molecular dynamics calculations with reactive potential show that net C, net W and net Y are hydrophobic substrates with contact angles of 122.3° ± 1.3°, 126.2° ± 1.3° and 127.8° ± 1.2°, respectively. The droplets on the above-mentioned substrates have a completely layered structure. That is, the water molecules inside the droplet are completely placed in certain layers. Calculating the order parameter for water molecules shows that the degree of water molecules' tetrahedrality on all three substrates is exactly the same. In terms of hydrogen bonding at the interface, the three substrates act identically and show almost the same effect. The droplet displacement is the highest on net W and the lowest on net Y. Furthermore, the van der Waals potential on all three substrates has been scanned. It is demonstrated that the amount of droplet displacement on the surface is inversely related to the surface density of the potential peaks.
1. Introduction
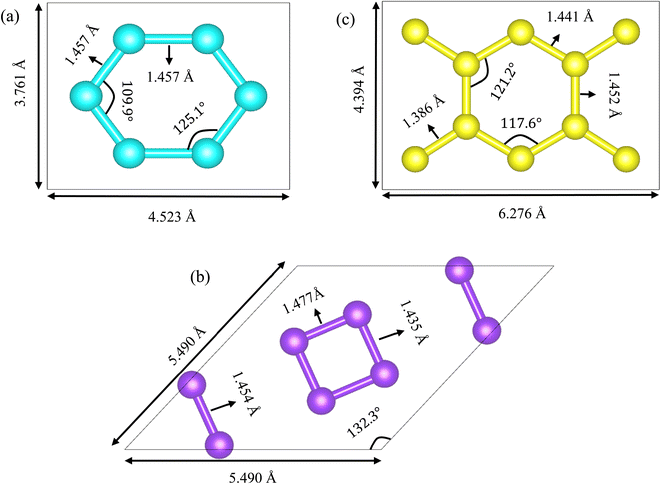
In 2021, an important carbon allotrope called biphenylene,1 theoretically predicted in 1997,2 was synthesized by Fan et al. Biphenylene is the name given to this structure by experimental chemists. Another name for this structure is net C.3 Net C has two close relatives with similar structure to net C. All three structures have all been predicted by theoretical calculations. Net C was predicted by Tyutyulkov et al. in 1997.2 Net W was predicted in 2013 by Wang.3 Net Y was predicted by Rong et al. in 2018.4Net C, net W and net Y have Pmmm (space group number 47),2 Cmmm (space group number 65)3 and Pmmm (space group number 47)4 space groups, respectively. Net C and net Y's unit cells are orthorhombic. Net W's unit cell is rhombic. Net C, net W and net Y have 6, 8 and 10 carbon atoms in a unit cell, respectively. Their lattice parameters are a = 4.523 Å, b = 3.761 Å, a = b = 5.490 Å, a = 6.276 Å and b = 4.394 Å, respectively. Carbon's atomic densities for these three substrates are 0.353 atom per Å2, 0.359 atom per Å2 and 0.363 atom per Å2, respectively. Net Y's atomic density is higher than that of net C and net W. Also, net C's atomic density is lower than that of net W. In fact, net C is the lightest allotrope among the three. Net C's electronic properties are a function of the arrangement of the substrate edges.2,5,6 These allotropes' unit cells are shown in Fig. 1. Carbon atoms in net C are divided into two groups.2 The first group consists of four carbons and the second group of two carbons. There are two types of carbon atoms in net W's unit cell.3 Inside the unit cell, the four carbon atoms, which form a square, are equivalent. The four carbon atoms that are close to the edges of the unit cell are also equivalent. But in net Y's unit cell, are divided into three types.4 The first type consists of four carbon atoms, located near the cell corners. The second type consists of four carbons which are connected to the carbons located near the cell corners. The third type consists of two carbon atoms that are opposite to each other.
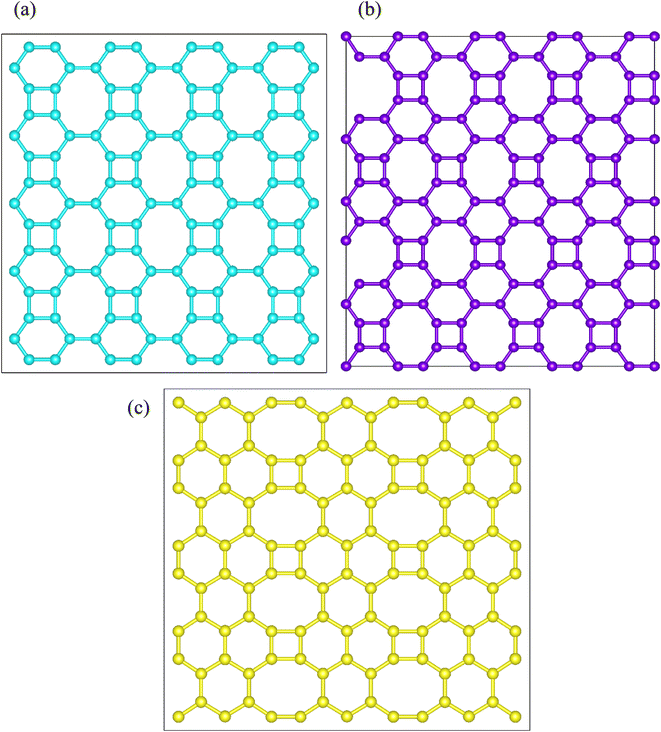
The carbon atoms in net C, net W and net Y are shown in cyan, violet, and yellow colors, respectively. In terms of energy, the allotropes' structural stability is: net Y > net W > net C.4 The allotropes have metallic properties and their band gap is zero.2–4 The allotropes have 4-, 6- and 8-membered carbon rings. But the orientation of these rings is different in each substrate. The allotropes' substrates are shown in Fig. 2. As shown in Fig. 2, in net C, each octagonal ring is surrounded by two square rings, two octagonal rings, and four hexagonal rings. In net W and net Y, each eight-membered ring is surrounded by two square rings and six hexagonal rings. In net W, each six-membered ring is surrounded by a square ring, two six-membered rings and three eight-membered rings. In net Y, there are two types of six-membered rings. In the first type, each six-membered ring is surrounded by four other six-membered rings and two eight-membered rings, respectively. In the second type, each six-membered ring is surrounded by a square ring, three six-membered rings and two eight-membered rings.
Two-dimensional materials have a large surface area and one method to understand the properties of the surface is to study their wettability.7 One of the most important quantities in wettability which determines the surface properties is the contact angle, given by the Young–Dupree equation:8,9
 | (1) |
In this equation, γSV, γSL and γLV are the solid–vapor, solid–liquid and liquid–vapor surface tensions, respectively. θ is Young's contact angle, measured from the droplet's inside. Young's contact angle varies between 0° and 180°. Materials with a contact angle of less than 90° are called hydrophilic. Materials with a contact angle of more than 90° are called hydrophobic. The measured contact angle shows a wide range. For example, the water contact angle on some metals is zero.10 But the contact angle on the petals of a number of plants is very high.11 For two-dimensional substrates such as graphene, the measured contact angle is about 127°.12,13 A number of two-dimensional substrates such as net W and net Y have not yet been synthesized experimentally. In such cases, computational methods are vital. They make very accurate estimates in the majority of cases. The molecular dynamics method is very reliable. It has been used to study the wettability of a large number of systems.14,15 In this article net C, net W and net Y's wettability is examined with the help of reactive potential. Properties such as contact angle, droplet contact diameter, hydrogen bonding at the interface, order parameter, droplet displacement on the substrate, etc. have been investigated.
2. Computational method
2.1. Computational details
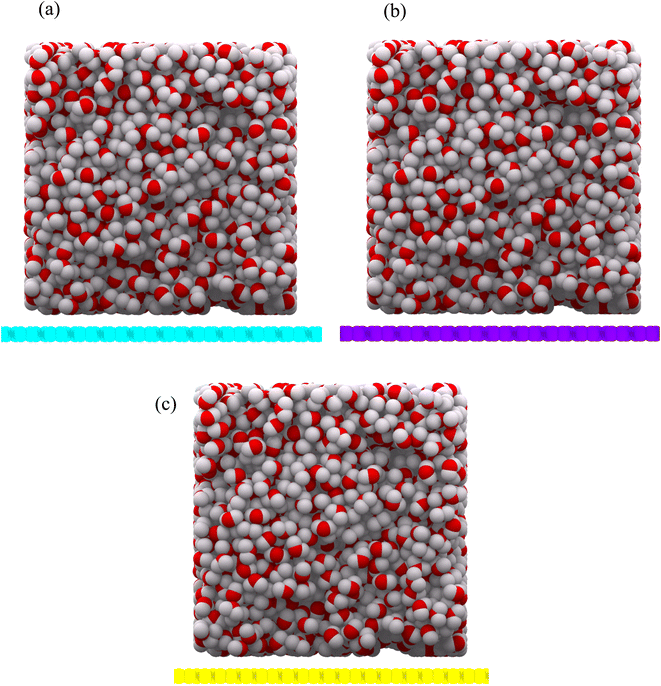
Reactive Force Field (ReaxFF) has been used to model the interaction between water droplets and the substrates (as well as between the hydrogen and oxygen atoms).16 This force field is specifically designed for carbon, hydrogen and oxygen atoms. This force field has already been used to study wettability.17 A canonical ensemble with 2000 water molecules at a temperature of 300 K is used. Because all three allotropes are stable at 300 K, the simulations are performed at this temperature. The time step is 1 femtosecond and the simulation time is 2 nanoseconds. The SPC/E water model was used to start the simulations. The substrates were considered with 200 Å × 200 Å dimensions. Periodic boundary conditions were considered in the x and y directions. In the z direction, the mirror boundary condition was applied. A droplet of cubic water with a density of 1 g cm−3 was initially placed on the center of the substrates and was given sufficient time to reach equilibrium. The final 500 equilibrium frames were used to extract the results. All calculations in this article have been done with LAMMPS Software.18 The structures were prepared using Packmol Package19 and depicted with OVITO Software.20 The initial configuration for the substrates is shown in Fig. 3(a) and (b), respectively.2.2. Reactive force field
Eqn (2) describes the energy of the whole system in terms of reactive potential:| Esystem = Ebond + Elp + Eover + Eunder + Eval + Epen + Ecoa + EC2 + Etriple + Etors + Econj + EH-bond + Evdw Walls + Ecoulomb | (2) |
There are 14 terms in this equation. The first and second terms are bond energy and Lone pair energy, respectively. Eover and Eunder are the over-coordination and under-coordination energies, respectively. Eval is angular energy. Epen and Ecoa are penalty energy and three-body conjugation energy, respectively. EC2 is the energy correction for the C2 molecule. Etriple is the energy of the triple bond. Etors and Econj are the torsion angle energy and conjugation effect term, respectively. The last three terms are the contributions of hydrogen bond energy, van der Waals energy and Coulomb energy, respectively.
2.3. Method of calculating contact angle
To calculate the contact angle, first the entire simulation box was divided into small cubes. Then the number of atoms in each element was counted and the density of atoms in each element was obtained. The points between the substrate and the minimum after the first density peak were removed due to the density fluctuation in the first layer. The boundary between the vapor phase and the liquid phase was considered to be a density of 0.4 g cm−3.15 Although a three-dimensional droplet is not a sphere, every two-dimensional slice of it is a circle.15 A circle was fitted on the remaining points. The contact angle was calculated at the minimum after the first peak.3. Results and discussion
3.1. Density
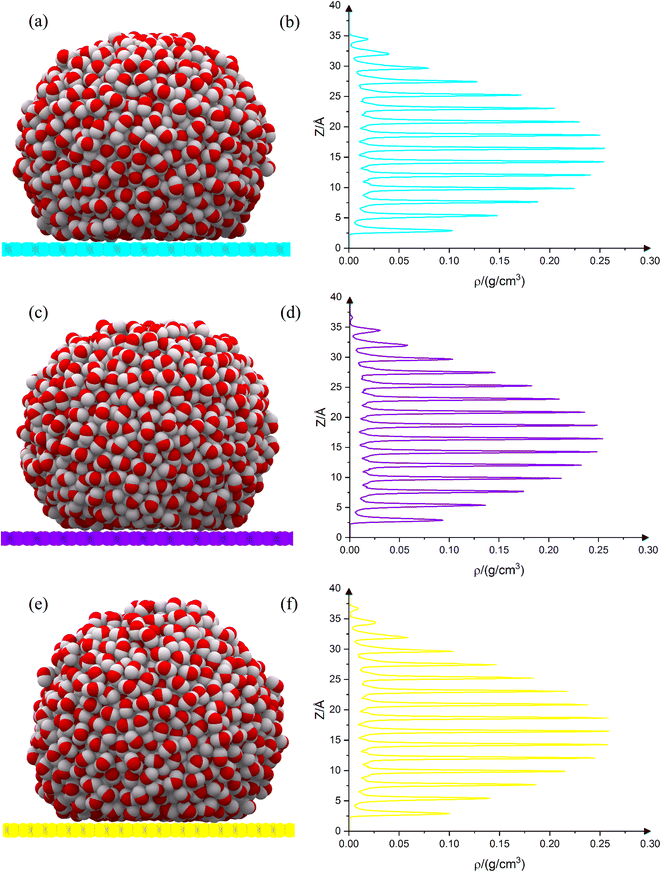
The equilibrium shape of the droplets on the substrates is shown in Fig. 4(a), (c) and (e). The droplet density diagram, in terms of the droplet height, is shown in Fig. 4(b), (d) and (f). As can be observed from the density diagram, the droplet on all three substrates has a completely layered structure. Such a layered structure has already been seen for drops on graphene and penta-graphene.17 Although the Leonard-Jones potential predicts only two or three peaks,14 the reactive potential indicates a greater number of peaks, demonstrating the fact that the water droplet's configuration on the substrate is layered. Although the Leonard-Jones potential produces only two or three peaks,21 the layer structure has been extracted empirically,22 both in terms of molecular dynamics simulations23 and density functional theory.22 The number of peaks on net C is 15. But on net W and net Y, this number is 16 (on net W there is a small peak at the top of the diagram). In all three cases, the average distance between the peaks is 2.25 Å. The peaks' intensity is almost the same in all three cases. On net W and net Y, the peaks' intensity in the upper layers is slightly higher than on net C. This fact shows that all three carbon substrates have almost the same effect. Each layer is located between two minima. There are 15 layers on net C and 16 layers on net W and net Y. The layers' thickness is almost the same in all three cases and is equal to 2.24 Å. The layers are located at the same height in all three substrates. Because the three carbon substrates have 4, 6 and 8 carbon membered-rings, it is expected that their density graphs are similar. This similarity can be easily observed from the density diagrams. But there is a difference in the number of peaks. This fact is very important. This is due to the difference in the atomic density of carbon allotropes. The higher the atomic density of the substrate, the greater the effect on the droplet. Net C has the lowest density. There are 15 peaks on net C. The atomic density of net W is slightly higher than that of net C, but lower than that of net Y. As can be observed from Fig. 4(d), a very small peak is growing at the end of the graph. This peak is completed in Fig. 4(f) because the atomic density of net Y is higher than the atomic density of the other two substrates.3.2. Contact angle and contact diameter
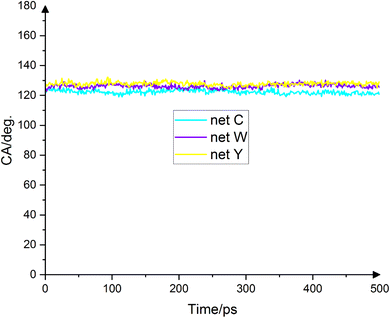
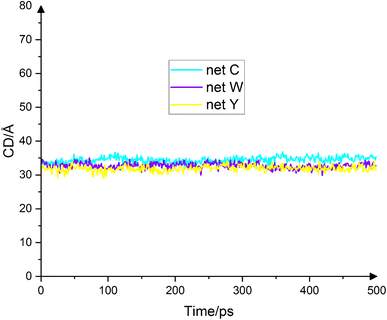
Fig. 5 shows the droplets' contact angles on the substrates at the final 500 ps. The average droplets' contact angles on net C, net W and net Y are 122.3° ± 1.3°, 126.2° ± 1.3° and 127.8° ± 1.2°, respectively. No experimental values for contact angles have been reported before. These values are the first estimates of water contact angles on these substrates. It should be noted that this force field gives a value of 128.76° for the contact angle of water on graphene, which is very close to the experimental value.17 The contact angle trend is net Y > net W > net C, which corresponds to these allotropes' energy trend. The point that justifies the contact angle trend is the carbon substrates' atomic density. Since carbon substrates are mainly hydrophobic,12,13 van der Waals force prevails in the interface. The lower the substrate's atomic density, the lower the van der Waals force. As a result, the water droplet is more dispersed and the contact angle is smaller. The contact angle trend corresponds to the allotropes' atomic density trend. Net C's atomic density is 0.353 atom per Å2, the lowest value among the three allotropes. It is expected that the van der Waals repulsion force between the droplet and the substrate at the interface to be the lowest for net C, and therefore the contact angle to be the lowest. The contact angle for net C is 122.3° ± 1.3°, the lowest value among the three allotropes. The atomic density of net Y is 0.363 atom per Å2, the highest among the three allotropes. For this substrate, van der Waals repulsion is the maximum value. Therefore, it is expected that the contact angle be the maximum value for net Y. The droplet's contact angle on net Y is 127.8° ± 1.2°, the highest value among the three allotropes. Net W's atomic density is 0.359 atom per Å2, which is larger than net C but smaller than the net Y. It is expected that the van der Waals repulsion between the droplet and the substrate at the interface for net W to be between the other two substrates. Therefore, the droplet's contact angle on net W should be larger than net C but smaller than net Y. The contact angle for net W is 126.2° ± 1.3°, which is exactly what is expected. The contact angle of net W is closer to net Y because the net W's atomic density is closer to net Y than to net C. For carbon mono-layered substrates, the atomic density of the substrate plays a significant role in determining the contact angle.Another important quantity which is usually considered along the contact angle is the diameter of the droplet base, also called the contact diameter. The contact diameter is inversely proportional to the contact angle, meaning the larger the contact angle, the smaller the contact diameter. Fig. 6 shows the droplets' contact dimeters in the final 500 ps. The average contact diameters for net C, net W and net Y are 34.5 Å ± 0.9 Å, 32.7 Å ± 0.8 Å and 31.9 Å ± 0.8 Å, respectively. The contact diameter for a water drop on graphene is 39.35 Å.17 Because the contact angle for net C is the smallest, the contact diameter for net C is the largest. The contact angle for net Y is the largest and therefore the contact diameter for net Y is the smallest. The contact angle for net W has a value between net C and net Y. Therefore, the contact diameter for net W is less than net C and more than net Y. Fig. 6 fully illustrates this fact.
3.3. The local order parameter, Sk
The local order parameter is a dimensionless quantity which measures changes in the radial distance between a reference oxygen atom and four close neighbors. This quantity is given by the eqn (3):24
 | (3) |
In this formula, rk is the distance from the k-th oxygen to the reference oxygen and ![[r with combining macron]](https://www.rsc.org/images/entities/i_char_0072_0304.gif) stands for the arithmetic mean of these distances. This quantity measures the degree of tetrahedrality. The higher the tetrahedrality, the larger the quantity. The minimum value of Sk is zero and the maximum value is 1, obtainable only in a perfect tetrahedral. It has been shown that this quantity is very sensitive to density fluctuations.25 Sk for the water model TIP4P/2005, which is one of the most accurate water models, is obtained at a temperature of 298 kelvin, equal to 0.99900.26 The order parameter for all substrates is exactly the same and is equal to 0.99954. However, the order parameter value is different in each frame. For example, this parameter's value in the last simulation frame and at the droplet–substrate interface for three allotropes is equal to 0.99678, 0.99654 and 0.99637, respectively. In order to observe a noticeable difference in the local order parameter, the density diagrams must be very different. Factors that can affect the local order parameter include the peak's number and intensity, as well as the minima's geometric location. These three parameters are the same for the three substrates. Therefore, no difference in the value of the local order parameter is expected. It should be noted that the value of the reported local order parameter is an average value, averaged over the final 500 equilibrium frames. The value of Sk in each frame is different for the three substrates, but the final mean value is the same.
stands for the arithmetic mean of these distances. This quantity measures the degree of tetrahedrality. The higher the tetrahedrality, the larger the quantity. The minimum value of Sk is zero and the maximum value is 1, obtainable only in a perfect tetrahedral. It has been shown that this quantity is very sensitive to density fluctuations.25 Sk for the water model TIP4P/2005, which is one of the most accurate water models, is obtained at a temperature of 298 kelvin, equal to 0.99900.26 The order parameter for all substrates is exactly the same and is equal to 0.99954. However, the order parameter value is different in each frame. For example, this parameter's value in the last simulation frame and at the droplet–substrate interface for three allotropes is equal to 0.99678, 0.99654 and 0.99637, respectively. In order to observe a noticeable difference in the local order parameter, the density diagrams must be very different. Factors that can affect the local order parameter include the peak's number and intensity, as well as the minima's geometric location. These three parameters are the same for the three substrates. Therefore, no difference in the value of the local order parameter is expected. It should be noted that the value of the reported local order parameter is an average value, averaged over the final 500 equilibrium frames. The value of Sk in each frame is different for the three substrates, but the final mean value is the same.
3.4. Interfacial hydrogen bond
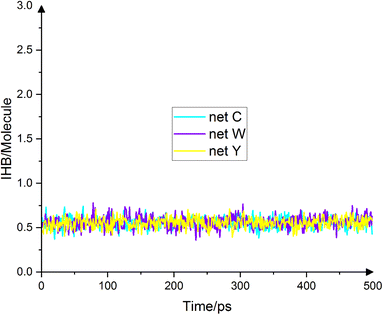
One of the most important determinants of water molecules' spatial structure is the hydrogen bond. This quantity can be obtained both experimentally, by means of molecular dynamics simulations, as well as through quantum calculations. The number of hydrogen bonds per water molecule in the bulk system for the SPC/E, TIP4P and TIP5P models is 1.90, 1.94 and 1.9427, respectively.27 Of course, the DFT and AIMD methods predict more than 3 hydrogen bonds for the bulk system.28 Since this article deals with the wettability of a limited droplet, the number of hydrogen bonds in the interface is important. Because the number of molecules in the interface is smaller than the bulk, it is expected that the number of hydrogen bonds to be lower than the values obtained for the bulk system. It has already been shown that the number of hydrogen bonds is a function of the distance from the substrate.29 In this article, the average number of hydrogen bonds in the interface (exactly up to the minimum after the first peak in the density diagram), per water molecule, for the substrate of net C, net W and net Y is 0.55443, 0.55947 and 0.55483, respectively, obtained according to the geometric criterion of Luzar.30 Two water molecules, i and j, are hydrogen bonded if the following three conditions hold simultaneously: (a) the distance between the two oxygens is less than 3.5 angstroms. (b) The distance between hydrogen i and oxygen j is less than 2.45 angstroms and (c), the angle between the oxygen distance vector and the OH bond vector is less than 30°. Fig. 7 shows the number of hydrogen bonds in the final 500 frames for the three substrates. As can be observed from the diagram, the number of hydrogen bonds at the interface for all three substrates is very close to each other and practically, not different from each other. As mentioned, the average number of hydrogen bonds is the same for the three substrates up to two decimal places. There is a difference from the third digit onward. The trend is net W > net![[thin space (1/6-em)]](https://www.rsc.org/images/entities/char_2009.gif) Y > net C. Usually, the higher the number of hydrogen bonds in the interface, the lower the droplet's contact angle.31 In order to create a difference of about seven degrees in the contact angle, the number of hydrogen bonds at the interface must be doubled. In the three substrates studied in this article, the difference in the number of hydrogen bonds is in the third decimal place. Therefore, a significant difference in the contact angle is not expected. The resultant numbers mean that a large number of water molecules are practically separated in the interface. That is, in the interface, a number of molecules have actually no hydrogen bonds. For example, the average number in the interface for net C, net W and net Y is 26.788, 24.474 and 24.924, respectively. However, the average total number of water molecules in the interface for the three substrates is 92.894, 84.33 and 85.35, respectively. Because net C has the lowest contact angle, it also has more water molecules in its interface. Therefore, in terms of hydrogen bonding at the interface, the substrates are not significantly different from each other. Even the average number of molecules with one, two, three and four bonds, is the same for all substrates. For example, the average single-bond molecules for net C, net W, and net Y are 37
Y > net C. Usually, the higher the number of hydrogen bonds in the interface, the lower the droplet's contact angle.31 In order to create a difference of about seven degrees in the contact angle, the number of hydrogen bonds at the interface must be doubled. In the three substrates studied in this article, the difference in the number of hydrogen bonds is in the third decimal place. Therefore, a significant difference in the contact angle is not expected. The resultant numbers mean that a large number of water molecules are practically separated in the interface. That is, in the interface, a number of molecules have actually no hydrogen bonds. For example, the average number in the interface for net C, net W and net Y is 26.788, 24.474 and 24.924, respectively. However, the average total number of water molecules in the interface for the three substrates is 92.894, 84.33 and 85.35, respectively. Because net C has the lowest contact angle, it also has more water molecules in its interface. Therefore, in terms of hydrogen bonding at the interface, the substrates are not significantly different from each other. Even the average number of molecules with one, two, three and four bonds, is the same for all substrates. For example, the average single-bond molecules for net C, net W, and net Y are 37![[thin space (1/6-em)]](https://www.rsc.org/images/entities/char_2009.gif) 200, 32
200, 32![[thin space (1/6-em)]](https://www.rsc.org/images/entities/char_2009.gif) 994, and 33
994, and 33![[thin space (1/6-em)]](https://www.rsc.org/images/entities/char_2009.gif) 488, respectively. The average number of water molecules with two hydrogen bonds is 21.748, 20.036 and 20.374, respectively. These numbers are not significantly different from each other and in terms of hydrogen bonding at the interface, the surfaces of all three substrates act the same.
488, respectively. The average number of water molecules with two hydrogen bonds is 21.748, 20.036 and 20.374, respectively. These numbers are not significantly different from each other and in terms of hydrogen bonding at the interface, the surfaces of all three substrates act the same.
3.5. Droplet's center of mass trajectory
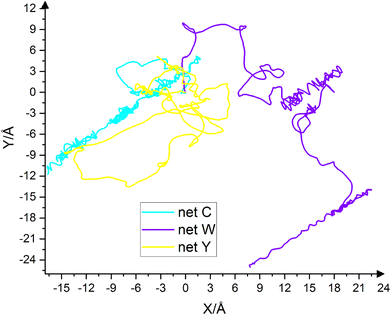
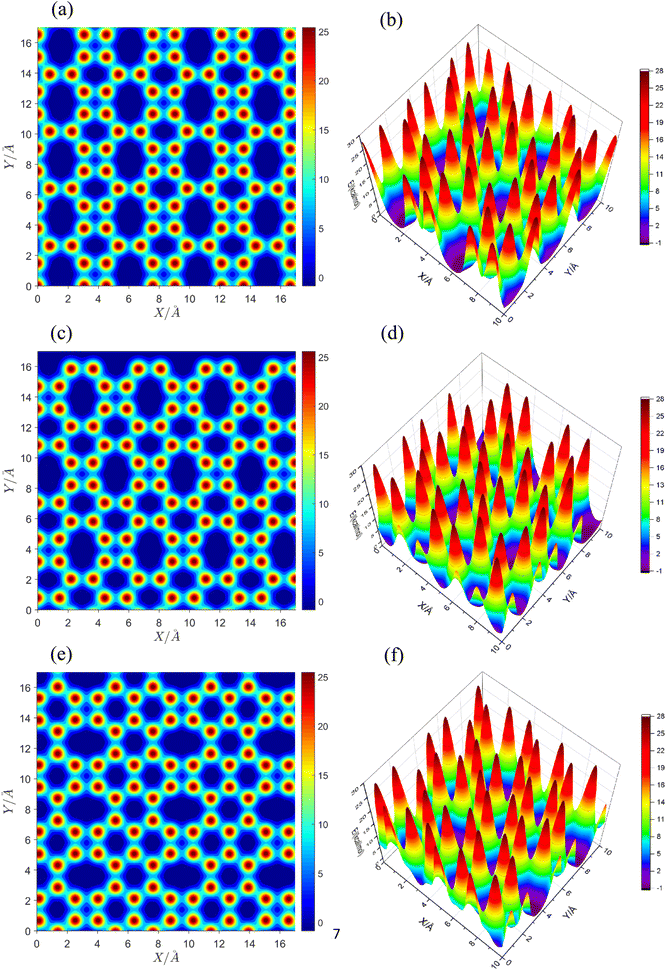
The droplet's motion on the substrate depends on the Potential Energy Surface (PES). In fact, the energy barriers on the potential energy surface are responsible for whether or not the droplet moves. Fig. 8 shows the path of the droplet's center of mass on the substrate during the simulation. The first frame is set to point (0,0). Cyan curve corresponds to net C, purple curve corresponds to net W and yellow curve corresponds to net Y. The route's length traveled in two dimensions by net C, net W and net Y is 177.64 Å, 190.61 Å and 152.11 Å, respectively. That is, the trend of these numbers is net W > net C > net Y. The path taken by the center of mass is the longest on net W. The three-dimensional path lengths for the substrates are 228.79 Å, 244.43 Å and 213.66 Å, respectively. In three dimensions, net W is longer than the other two substrates. In two dimensions, the amount of droplet displacement on net W is 13 angstroms higher than that of net C. The displacement on net C is about 25 angstroms higher than that of net Y. Finally, the displacement on net W is 38 angstroms higher than that of net Y.In order to better understand and analyze the droplet translational motion on the substrates, the van der Waals potential energy for the movement of an oxygen atom on the substrates was scanned. Fig. 9(a), (c) and (e) show the contour diagrams for net C, net W and net Y, respectively. Because all three substrates contain four-, six- and eight-membered rings, the general shape of the potential basins are square, hexagonal and octagonal. There is little difference in the general shape of the potential basins. In net C and net W, the large diameter of the octagonal basin is in the direction of the y axis. But in net Y, the large diameter is in the direction of the X axis.
Fig. 9(b), (d) and (f) show the three-dimensional PES of the van der Waals potential energy for the substrates. The deepest points are at the center of the basins. The energy of the centers of the square basins in all substrates is almost the same and is equal to +3.6 kcal mol−1. However, the energy of the centers of hexagonal basins is ≈−0.5 kcal mol−1. The octagonal centers are the deepest points on the potential energy surface with an energy of −0.8 kcal mol−1. But a very important point that can justify the trend of net W > net C > net Y is the number of potential peaks per area of the surface; in other words, the surface density of the potential peaks. In an area of 10 × 10 Å2, there are 34, 33 and 38 peaks in net C, net W and net Y substrates, respectively. The surface density of the potential peaks follows exactly the net W < net C < net Y trend. The number of potential peaks on net W is the lowest and on net Y the highest. Therefore, the water droplet will move harder on net Y and easier on net W. Net C, which has a potential peaks number between net W and net Y, is between the two substrates in terms of droplet displacement. In other words, moving the droplet on net W is a little easier than on net C because the droplet encounters fewer peaks in its path. Moving the drop on net C is also a little easier than on net Y, because the droplet encounters fewer peaks in its path. The path of the droplets' center of mass on all three substrates is completely random and no direction is preferred. The summary of the results obtained for the wetting behavior of three carbon allotropes are reported in Table 1.
| Substrate | Number of density peaks | CA/degree | CD/Å | Sk | IHB | COM path length (3D)/Å |
|---|---|---|---|---|---|---|
| net C | 15 | 122.3° ± 1.3° | 34.5 Å ± 0.9 Å | 0.99954 | 0.55443 | 228.79 |
| net W | 16 | 126.2° ± 1.3° | 32.7 Å ± 0.8 Å | 0.99954 | 0.55947 | 244.43 |
| net Y | 16 | 127.8° ± 1.2° | 31.9 Å ± 0.8 Å | 0.99954 | 0.55483 | 213.66 |
4. Conclusion
This article investigated the wettability properties of three carbon allotropes, namely net C (biphenylene), net W and net Y, using reactive molecular dynamics. The simulation results show that all three substrates are hydrophobic and the water contact angle on them is 122.3°, 126.2° and 127.8°, respectively. The contact diameter is inversely proportional to the contact angle. The droplets' structure on the substrates is layered, which can be deduced from the density diagram along the z-axis. The local order parameter shows that in terms of the tetrahedral arrangement of water molecules, the substrates are not different from each other and the water molecules on all three substrates are equally tetrahedral. The average number of hydrogen bonds in the interface does not show a significant difference for the substrates. But the amount of droplet displacement on the substrates is different. The droplet moves more on net W than on net C and more on net C than on net Y. This is shown to be the result of the surface density of potential peaks. Because there is no experimental value for the wettability properties of these allotropes in the literature, the values reported in this work can be considered as the first estimate of the wettability properties of these allotropes.Conflicts of interest
There are no conflicts to declare.Acknowledgements
We wish to thank Professor Jian-Tao Wang for kindly providing us with the net C and net W structures.References
- Q. Fan, L. Yan, M. W. Tripp, O. Krejčí, S. Dimosthenous, S. R. Kachel, M. Chen, A. S. Foster, U. Koert, P. Liljeroth and J. M. Gottfried, Biphenylene network: a nonbenzenoid carbon allotrope, Science, 2021, 372, 852–856 CrossRef CAS PubMed.
- N. Tyutyulkov, F. Dietz, K. Müllen and M. Baumgarten, Structure and energy spectra of a two-dimensional dielectric carbon allotrope, Chem. Phys. Lett., 1997, 272, 111–114 CrossRef CAS.
- X.-Q. Wang, H.-D. Li and J.-T. Wang, Prediction of a new two-dimensional metallic carbon allotrope, Phys. Chem. Chem. Phys., 2013, 15, 2024–2030 RSC.
- J. Rong, H. Dong, J. Feng, X. Wang, Y. Zhang, X. Yu and Z. Zhan, Planar metallic carbon allotrope from graphene-like nanoribbons, Carbon, 2018, 135, 21–28 CrossRef CAS.
- M. A. Hudspeth, B. W. Whitman, V. Barone and J. E. Peralta, Electronic Properties of the Biphenylene Derivatives Sheet and Its One-Dimensional, ACS Nano, 2010, 4, 4565–4570 CrossRef CAS PubMed.
- N. N. Karaush, G. V Baryshnikov and B. F. Minaev, DFT Characterization of a New Possible Graphene Allotrope, Chem. Phys. Lett., 2014, 612, 229–233 CrossRef CAS.
- K. L. Mittal, Contact Angle, Wettability and Adhesion, 2006, vol. 6 Search PubMed.
- T. Young, An Essay on the Cohesion of Fluids, Philos. Trans. R. Soc. London, 1805, 95, 65–87 CrossRef.
- A. M. Dupré and P. Dupré, Théorie mécanique de la chaleur, Gauthier-Villars, 1869 Search PubMed.
- Z. Xu, Y. Gao, C. Wang and H. Fang, Nanoscale hydrophilicity on metal surfaces at room temperature: coupling lattice constants and crystal faces, J. Phys. Chem. C, 2015, 119, 20409–20415 CrossRef CAS.
- C. Neinhuis and W. Barthlott, Characterization and Distribution of Water-repellent, Self-cleaning Plant Surfaces, Ann. Bot., 1997, 79, 667–677 CrossRef.
- S. Wang, Y. Zhang, N. Abidi and L. Cabrales, Wettability and Surface Free Energy of Graphene Films, Langmuir, 2009, 25, 11078–11081 CrossRef CAS PubMed.
- G. Kim, S. Gim, S. Cho, N. Koratkar and I. Oh, Wetting-Transparent Graphene Films for Hydrophobic Water-Harvesting Surfaces, Adv. Mater., 2014, 26, 5166–5172 CrossRef CAS PubMed.
- M. Foroutan, F. Esmaeilian and M. T. Rad, The change in the wetting regime of a nanodroplet on a substrate with varying wettability: a molecular dynamics investigation, Phys. Fluids, 2021, 33, 032017 CrossRef CAS.
- M. Foroutan, M. Torabi Rad, A. Boudaghi and H. Ataeizadeh, The shape of two-dimensional and three-dimensional drops on flat and curved hydrophilic substrates: variational, numerical and molecular dynamics simulation investigations, J. Iran. Chem. Soc., 2021, 1–11 Search PubMed.
- K. Chenoweth, A. C. T. Van Duin and W. A. Goddard, ReaxFF Reactive Force Field for Molecular Dynamics Simulations of Hydrocarbon Oxidation, J. Phys. Chem. A, 2008, 112, 1040–1053 CrossRef CAS PubMed.
- M. Torabi Rad and M. Foroutan, Wettability of Penta-Graphene: A Molecular Dynamics Simulation Approach, J. Phys. Chem. C, 2022, 126, 1590–1599 CrossRef CAS.
- S. Plimpton, J. Comput. Phys., 1995, 117, 1–19 CrossRef CAS.
- L. Martínez, R. Andrade, E. G. Birgin and J. M. Martínez, Packmol: A Package for Building Initial Configurations, J. Comput. Chem., 2009, 30, 2157–2164 CrossRef PubMed.
- A. Stukowski, Visualization and analysis of atomistic simulation data with OVITO – the Open Visualization Tool, Model. Simul. Mater. Sci. Eng., 2010, 18, 015012 CrossRef.
- J. Liu, C. Lai, Y. Zhang, M. Chiesa and S. T. Pantelides, Water wettability of graphene: interplay between the interfacial water structure and the electronic structure, RSC Adv., 2018, 8, 16918–16926 RSC.
- E. Sauer, A. Terzis, M. Theiss, B. Weigand and J. Gross, Prediction of Contact Angles and Density Pro fi les of Sessile Droplets Using Classical Density Functional Theory Based on the PCP-SAFT Equation of State, Langmuir, 2018, 34, 12519–12531 CrossRef CAS PubMed.
- M. Isaiev, S. Burian, L. Bulavin, W. Chaze, M. Gradeck, G. Castanet, S. Merabia, P. Keblinski, K. Termentzidis, U. De Lorraine and V. N. F. Gibbs, Adsorption Impact on a Nanodroplet Shape: Modification of Young − Laplace Equation, J. Phys. Chem. B, 2018, 122, 1–8 CrossRef PubMed.
- P. Chau and A. J. Hardwick, A new order parameter for tetrahedral configurations, Mol. Phys., 1998, 93, 511–518 CrossRef CAS.
- P. Jedlovszky, Voronoi polyhedra analysis of the local structure of water from ambient to supercritical conditions, J. Chem. Phys., 1999, 111, 5985 Search PubMed.
- E. Duboue, D. Laage and E. Normale, Characterization of the Local Structure in Liquid Water by Various Order Parameters, J. Phys. Chem. B, 2015, 119, 8406–8418 CrossRef PubMed.
- C. Caleman and D. Van Der Spoel, Temperature and structural changes of water clusters in vacuum due to evaporation, J. Chem. Phys., 2006, 154508 CrossRef PubMed.
- A. Marmur, Wetting on Hydrophobic Rough Surfaces: To Be Heterogeneous or Not To Be?, Langmuir, 2003, 19, 8343–8348 CrossRef CAS.
- C. Lee, J. A. Mccammon and P. J. Rossky, The structure of liquid water at an extended hydrophobic surface the structure of liquid water at an extended hydrophobic surface, J. Chem. Phys., 1984, 80, 4448 CrossRef CAS.
- A. Luzar and D. Chandler, Structure and hydrogen bond dynamics of water–dimethyl sulfoxide mixtures by computer simulations, J. Chem. Phys., 1993, 98, 8160–8173 CrossRef CAS.
- M. Foroutan, M. Darvishi and S. M. Fatemi, Structural and dynamical characterization of water on the Au (100) and graphene surfaces, Phys. Rev. E, 2017, 96, 033312 CrossRef PubMed.
| This journal is © The Royal Society of Chemistry 2023 |

