 Open Access Article
Electrochemical behaviour of cellulose/reduced graphene oxide/carbon fiber paper electrodes towards the highly sensitive detection of amitrole
Hui Hua,
Si Wu b,
Cheng Wangc,
Xiaohui Wang
 c and
Xiaowen Shi
 *a
*a
aSchool of Resource and Environmental Science, Hubei Engineering Center of Natural Polymers-Based Medical Materials, Hubei Biomass-Resource Chemistry and Environmental Biotechnology Key Laboratory, Hubei International Scientific and Technological Cooperation Base of Sustainable Resource and Energy, Wuhan University, Wuhan 430079, China. E-mail: shixw@whu.edu.cn
bCollege of Resources and Environmental Engineering, Hubei Key Laboratory for Efficient Utilization and Agglomeration of Metallurgic Mineral Resources, Wuhan University of Science and Technology, Wuhan 430081, China
cState Key Laboratory of Pulp and Paper Engineering, South China University of Technology, Guangzhou 510640, China
First published on 10th January 2023
Abstract
Amitrole is a non-selective triazole herbicide that is widespread used to control a variety of weeds in agriculture, but it may pollute the environment and do harm to organisms. Thus, it is of critical significance to enlist a low-cost, sensitive, stable and renewable method to detect amitrole. In this paper, electrochemical experiments were carried out using carbon fibers/reduced graphene oxide/cellulose paper electrodes, which demonstrated good electrocatalytic performance for amitrole detection. The electrochemical process of amitrole on the surface of the reduced paper electrode was a quasi-reversible reaction controlled by diffusion. Cyclic voltammetry and the amperometric i–t curve method were used for amitrole determination at a micro molar level and higher-concentration range with the following characteristics: linear range 5 × 10⁻⁶ mol L−1 to 3 × 10⁻⁵ mol L−1, detection limit 2.44 × 10⁻⁷ mol L−1. In addition, the relative standard deviation of repeatability is 3.74% and of stability is 4.68%. The reduced paper electrode with high sensitivity, low detection limit, good stability and repeatability provides novel ideas for on-site amitrole detection in food and agriculture.
1. Introduction
Amitrole (3-amino-1,2,4-triazole) is a non-selective triazole herbicide, which is commonly used in combination with other chemical agents to control a variety of weeds in agriculture.1–4 It is an organic heterocyclic compound that can block the biosynthesis of carotenoid.5,6 This herbicide has strong polarity, low volatility and high solubility in water, so it may pollute groundwater, surface water and contaminate food through plants, fruit and water medium. Even worse, it will cause toxic side effects and damage human health when it enters the body.6–8 Traditional strategies and analytical techniques have been developed for the detection of amitrole, such as high performance liquid chromatography (HPLC),7,9 gas/liquid chromatography-mass spectrometry (GC/LC-MS)10,11 and capillary electrophoresis.12,13 However, these methods have their drawbacks with high operation cost,5 complicated procedure, time-consuming, and requirement of skilled personnel.14,15 Electrochemical methods have attracted much attention due to their advantages of simple and convenient operation, cost-effectiveness, precision and rapid analysis and high sensitivity.16,17 Electrochemistry has unique versatilities, its detection data is easy to read and analyze, and it is suitable for miniaturization, intelligence and field applications to screen and monitor pollutants.18–20In the electrochemical detection of analytes, the working electrode is extremely important.19 When using electrochemical methods, applying voltage through various electrochemical technologies such as cyclic voltammetry will cause electrochemical redox reaction of analytes on the working electrode.21 The reaction mechanism and chemical properties of the analytes can be explored by outputting the change of its response current. The working electrodes made of different materials have different properties and have their own advantages in the detection of analytes. When detected on traditional bare electrodes, amitrole has a high oxidation overpotential and will contaminate the electrode.1 The selectivity of detection is also affected by the coexistence of other interfering molecules with similar oxidation potential.15 These limitations can be overcome by electrode modification. A literature investigation has shown that different kinds of modified electrodes have been used for the electrochemical detection of amitrole, including metals and their oxides,3,22,23 phthalocyanine,2,16,17 labeled enzyme or probe reactions6,24 and carbon materials,25,26 etc. These modified electrodes have high sensitivity and good selectivity, but the modification process is complex and time-consuming. In this regard, functionalized paper-based electrodes provide opportunities for low-cost, efficient, and environmentally friendly stable chemical analysis.27,28 At present, a variety of paper-based electrochemical sensors have been developed for environmental field monitoring,29 rapid analysis of food safety,30 biomedical detection,31 but there are few examples of pesticide detection in literature reports.14,32
Cellulose-based paper has attracted considerable attention due to environmentally friendly and degradability of the cellulose substrate.33,34 Graphene has high specific surface area, excellent electrochemical performance and thin-layer nanostructure, which is a good catalyst support.19,35 In our previous work, a composite paper electrode made from carbon fibers (CF), graphene oxide (GO) and cellulose fibers was fabricated in large scale with superior electrocatalytic property.28 To expand the electrochemical application of the CF/GO/cellulose paper electrode, we selected this composite paper electrode for amitrole detection. As far as we know, this work is the first report on amitrole detection by using paper electrode, which is low-cost, simple, fast and efficient, and environmentally friendly. We explored the electrochemical reaction type, detection range and detection limit of amitrole by cyclic voltammetry and amperometric i–t method. In addition, the interference experiment and real sample detection were carried out. The results show that the CF/GO/cellulose paper electrode has the potential to electrochemical detection of pesticides with portable and disposable manner, which provides novel ideas for on-site amitrole detection in food and agriculture.
2. Experimental
2.1. Materials
Amitrole was obtained from Sigma. The carbon fibers/graphene oxide/cellulose paper electrochemical sensors were received from State Key Laboratory of Pulp and Paper Engineering, South China University of Technology (SCUT). The 0.1 mol L−1 phosphate buffer (PB) used as the supporting electrolyte was prepared with appropriate amounts of Na2HPO4·12H2O and NaH2PO4·2H2O, and the pH adjusted with 0.1 M H3PO4 or NaOH. Ultrapure water of resistivity 18.2 M was obtained from a Molgene and was used throughout the experiments. All the experiments were carried out at room temperature. All other reagents were analytical reagent grade and were used as received without further purification.2.2. Instrumentation
Electrochemical experiments were recorded using a three electrode system controlled by CHI 840D electrochemical workstation (Shanghai, China), with a CF/GO/cellulose composite paper (1 × 1.5 cm) as a working electrode, an Ag/AgCl reference electrode and a platinum counter electrode. The surfaces of the paper-based electrodes were characterized by scanning electron microscope (SEM).2.3. Electrochemical measurements
3. Results and discussion
3.1. Characterization of CF/GO/cellulose paper electrode
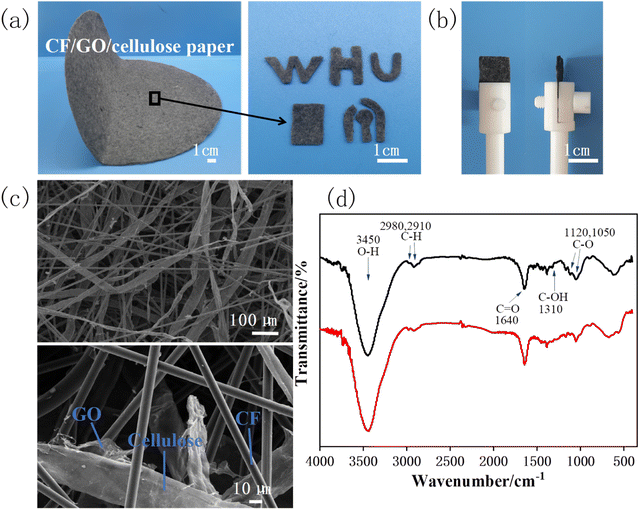
The composite paper is composed of carbon fibers (CF), graphene oxide (GO) and cellulose, wherein the mass ratio of CF and cellulose is 1![[thin space (1/6-em)]](https://www.rsc.org/images/entities/char_2009.gif) :
:![[thin space (1/6-em)]](https://www.rsc.org/images/entities/char_2009.gif) 1, and the content of GO is 8% (w/w).28 CF can impart conductivity to paper electrodes, GO endow them with electrocatalytic activity. The composite paper is uniform, stable and foldable. As shown in Fig. 1a, the composite paper (25 cm in diameter) can be cut into desired shapes to facilitate the experiment. Fig. 1b shows the rectangular sheets (1 × 1.5 cm), which were used as working electrodes in subsequent experiments by clamping them with electrode clips. Then, we observed the surface microstructure of the paper electrode using scanning electron microscopy (SEM). Fig. 1c shows that the surface microscopy of the paper electrode is relatively uniform, which is interwoven by cellulose/GO and CF, while GO covers on the surface of cellulose.
1, and the content of GO is 8% (w/w).28 CF can impart conductivity to paper electrodes, GO endow them with electrocatalytic activity. The composite paper is uniform, stable and foldable. As shown in Fig. 1a, the composite paper (25 cm in diameter) can be cut into desired shapes to facilitate the experiment. Fig. 1b shows the rectangular sheets (1 × 1.5 cm), which were used as working electrodes in subsequent experiments by clamping them with electrode clips. Then, we observed the surface microstructure of the paper electrode using scanning electron microscopy (SEM). Fig. 1c shows that the surface microscopy of the paper electrode is relatively uniform, which is interwoven by cellulose/GO and CF, while GO covers on the surface of cellulose.
It is reported that reduction of GO in the paper electrode has a significant impact on electrochemical detection.28 Thus, the CF/GO/cellulose paper electrode was reduced at −0.9 V for 1000 s. The functional groups of the GO paper electrode before and after the reduction were studied by FTIR spectroscopy. As shown in Fig. 1d, the strong peak at 3450 cm−1 from the stretching vibration of O–H group, the bonds at 2980 cm−1 and 2910 cm−1 are attributed to C–H stretching and the peak at 1640 cm−1 corresponded to the skeletal vibration of the C![[double bond, length as m-dash]](https://www.rsc.org/images/entities/char_e001.gif) O stretch.36 For the GO paper electrode, characteristic peaks corresponding to various functional groups, including C–O (1120 cm−1, 1050 cm−1), C–OH (1310 cm−1).37,38 After the GO is electrochemically reduced, the broad O–H stretching bond and the C
O stretch.36 For the GO paper electrode, characteristic peaks corresponding to various functional groups, including C–O (1120 cm−1, 1050 cm−1), C–OH (1310 cm−1).37,38 After the GO is electrochemically reduced, the broad O–H stretching bond and the C![[double bond, length as m-dash]](https://www.rsc.org/images/entities/char_e001.gif) O bond remain, but the intensity of the oxygen functionalities C–O bond at 1050 cm−1 was markedly weakened, indicating that part of GO was reduced to rGO.
O bond remain, but the intensity of the oxygen functionalities C–O bond at 1050 cm−1 was markedly weakened, indicating that part of GO was reduced to rGO.
3.2. Electrochemical performance of CF/rGO/cellulose paper electrode
| Ip = (2.69 × 10⁵)n3/2AD1/2Cv1/2 | (1) |
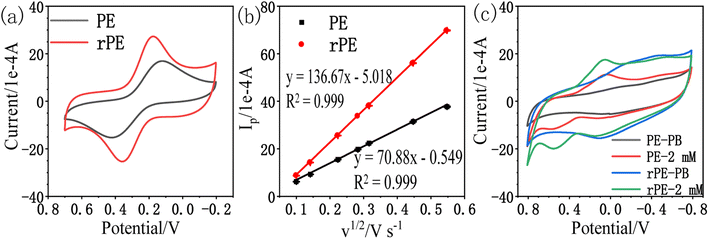
Experiments at different scan rates were performed in a solution of 1 mM K3[Fe(CN)6] in 1 M KCl. The plot of Ip vs. v1/2 (Fig. 2b) was found to be linear with the slope of 70.88 and 136.67 for the paper electrode (PE) and the reduced paper electrode (rPE) respectively regarding following equations:
| PE: Ip (1 × 10⁻⁴ A) = 70.88v1/2 (V s−1) − 0.549; R2 = 0.999 |
| rPE: Ip (1 × 10⁻⁴ A) = 136.67v1/2 (V s−1) − 5.018; R2 = 0.999 |
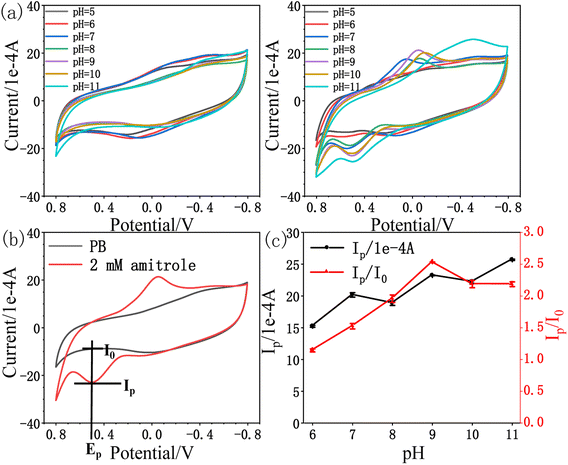
The effective sensing surface areas were estimated to be 9.56 cm2 for PE and 18.43 cm2 for rPE. Therefore, rPE is expected to perform better than PE based on the effective electrode area. The peak potential separation (ΔE) can reflect the electron transfer ability, which is used to evaluate the electrode surface performance as an electrocatalytic platform, the lower the ΔE, the better the electron transfer ability of the electrode.41 Thus the electron transfer ability of rPE (0.185 V) is better than PE (0.300 V), proving that the reduction of GO resulted in a higher electron transfer ability. Fig. 2c shows the CV curves of PE and rPE in 0.1 M phosphate buffer (PB, pH = 7) and 2 mM amitrole in 0.1 M PB at the scan rate of 50 mV s−1. As illustrated, there are redox peaks observed for amitrole both on the PE and rPE. Comparing with PE, the catalytic peak current of amitrole on the rPE is enhanced and the oxidation peak potential is slightly negatively shifted, proving that the reduction of GO has a catalytic effect on the detection of amitrole. Therefore, the rPE is selected as the working electrode in the following experiments.
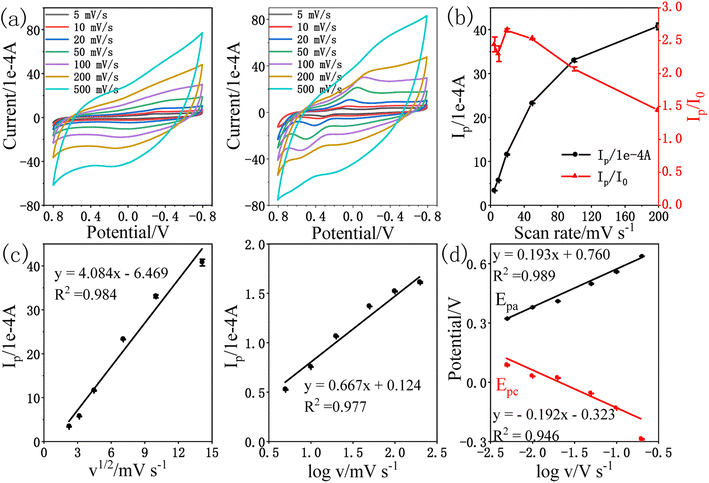
The obtained results exhibited that the oxidation peak current (Ip) of amitrole followed a linear relationship with the square root of scan rate (v1/2) as indicated in Fig. 4c. The linear regression equation is shown below:
| Ip (1 × 10⁻⁴ A) = 4.084v1/2 (mV s−1) − 6.469; R2 = 0.984 |
Further, the slope value of logarithm of Ip vs. logarithm of v was calculated to be 0.667 for amitrole, which is near to the theoretical value as observed for the diffusion controlled processes,4,44 confirming that the electrochemical process of amitrole on the surface of rPE is diffusion controlled.45 The linear regression equation is shown below:
log![[thin space (1/6-em)]](https://www.rsc.org/images/entities/char_2009.gif) Ip (1 × 10⁻⁴ A) = 0.667 Ip (1 × 10⁻⁴ A) = 0.667![[thin space (1/6-em)]](https://www.rsc.org/images/entities/char_2009.gif) log log![[thin space (1/6-em)]](https://www.rsc.org/images/entities/char_2009.gif) v (mV s−1) + 0.124; R2 = 0.977 v (mV s−1) + 0.124; R2 = 0.977 |
Fig. 4d shows the anodic peak potential Epa and the cathodic peak potential Epc were proportional with the log![[thin space (1/6-em)]](https://www.rsc.org/images/entities/char_2009.gif) v with the linear regression equations as: Epa (V) = 0.193
v with the linear regression equations as: Epa (V) = 0.193![[thin space (1/6-em)]](https://www.rsc.org/images/entities/char_2009.gif) log
log![[thin space (1/6-em)]](https://www.rsc.org/images/entities/char_2009.gif) v (V s−1) + 0.760 (R2 = 0.989) and Epc (V) = −0.192
v (V s−1) + 0.760 (R2 = 0.989) and Epc (V) = −0.192![[thin space (1/6-em)]](https://www.rsc.org/images/entities/char_2009.gif) log
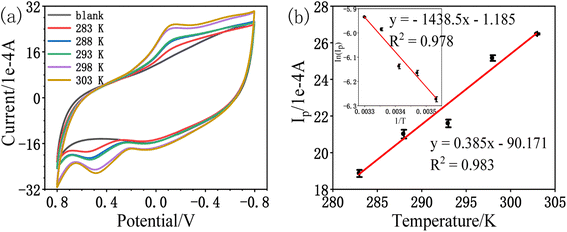
log![[thin space (1/6-em)]](https://www.rsc.org/images/entities/char_2009.gif) v (V s−1) − 0.323 (R2 = 0.946), respectively. According to Laviron's theory, the slopes of the lines are equal to 2.3RT/(1 − α)nF for the anodic peak and −2.3RT/αnF for the cathodic peak, respectively.46,47 The charge transfer coefficient α can be calculated to be 0.50, indicating that the activated complex is at least halfway between substrate and the product on the reaction coordinate.17 With the increase of scan rate, the oxidation peak potential gradually shifts positively and the reduction peak potential shifts negatively, indicating that the electrochemical reaction of amitrole on the surface of rPE is a quasi-reversible reaction.48
v (V s−1) − 0.323 (R2 = 0.946), respectively. According to Laviron's theory, the slopes of the lines are equal to 2.3RT/(1 − α)nF for the anodic peak and −2.3RT/αnF for the cathodic peak, respectively.46,47 The charge transfer coefficient α can be calculated to be 0.50, indicating that the activated complex is at least halfway between substrate and the product on the reaction coordinate.17 With the increase of scan rate, the oxidation peak potential gradually shifts positively and the reduction peak potential shifts negatively, indicating that the electrochemical reaction of amitrole on the surface of rPE is a quasi-reversible reaction.48
 | (2) |
The activation energy value of the oxidation peak current of amitrole is calculated from the Arrhenius equation to be 11.96 kJ mol−1. Although the oxidation peak current is larger at higher temperature, this may be due to the diffusibility variations of the amitrole molecule.5,23
3.3. Electrochemical behaviour towards amitrole
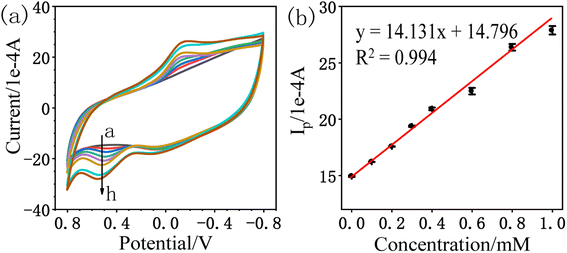
| Ip (1 × 10⁻⁴ A) = 14.131CA (mM) + 14.796; R2 = 0.994 |
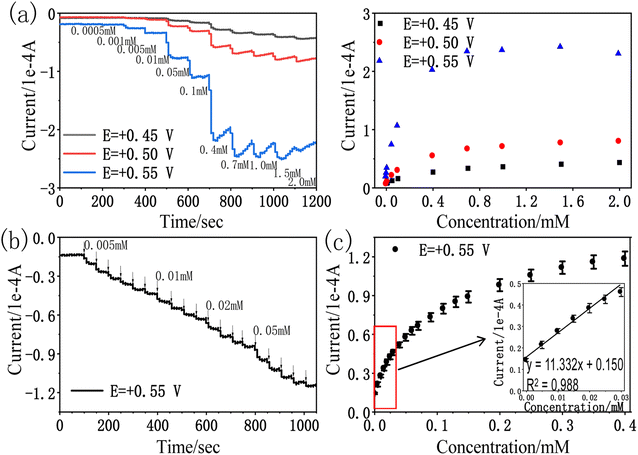
We further demonstrated the I–t curve of amitrole concentration in the range 0 mM to 0.40 mM under conditions at which the potential of rPE was kept at +0.55 V vs. Ag/AgCl. Initially, 0.005 mM amitrole was added at a time, then gradually increased the concentration to 0.01 mM, 0.02 mM and 0.05 mM. Fig. 7b shows that during the successive addition of amitrole, typical current responses were observed. In the process of amperometric I–t detection, the increase rate of response current gradually decreases as the concentration of amitrole increases (Fig. 7c). This may be because the oxidized product was partially blocked on the paper electrode, leading to the reduction of its electrochemical activity and the decrease of sensitivity in the subsequent concentration detection.31,52,53 As shown in inset of Fig. 7c, the amperometric current response was increased linearly with increasing amitrole concentration in the range 0.005 mM to 0.030 mM. The regression equation of the linear plot is shown as:
| I (1 × 10⁻⁴ A) = 11.332CA (mM) + 0.150; R2 = 0.988 |
| S.·No. | Modified electrode | Method | Linearity range (μM) | LOD (M) | Ref. |
|---|---|---|---|---|---|
| a GCE; glassy carbon electrode.b CPE; carbon paste electrode.c MWCNTs; multi-walled carbon nanotubes.d SWV; square-wave voltammetry.e CA; chronoamperometry.f I–t; amperometric i–t.g DPV; differential pulse voltammetry. | |||||
| 1 | GCEa/Nafion/lead–ruthenium oxide pyrochlore | SWVd | 30–250 | 3.8 × 10⁻⁷ | 3 |
| 2 | CPEb/iron(II) phthalocyanine nanoparticles | CAe | 0.001–0.012 | 3.62 × 10⁻⁹ | 2 |
| 3 | GCE/tetraaminophthalocyanine-single walled carbon nanotube dendrimer | CA | 63–100 | 2.15 × 10⁻⁷ | 17 |
| 4 | WO3·0.33H2O/CPE | SWV | 0.1–0.28 | 2.30 × 10⁻⁹ | 8 |
| 5 | GCE/calcium cross linked pectin stabilized gold nanoparticle film | SWV | 0.1–1.5 | 2.0 × 10⁻⁸ | 1 |
| 6 | GCE/graphene oxide-MWCNTsc | I–tf | 5–3545 | 4.5 × 10⁻⁷ | 25 |
| 7 | GCE/calcium-doped zinc oxide nanoparticles-MWCNTs | SWV | 0.01–0.6 | 3.58 × 10⁻⁹ | 5 |
| 8 | GCE/N-doped carbon nanotube arrayed mesoporous carbon | DPVg | 20–250 | 7.0 × 10⁻⁶ | 26 |
| 9 | Carbon fibers/reduced graphene oxide/cellulose paper | I–t | 5–30 | 2.44 × 10⁻⁷ | Present work |
4. Analytical applications
4.1. Interference studies
The selectivity of the reduced paper electrode towards amitrole was carried out using CV method. In the existence of 100 folds excess concentration (50 mM) of interfering ions and dissolved organic matters such as KCl, NaNO3, NaAc, K2SO4, urea, and glucose, it was seen from Fig. 8 that the above mentioned interferents did not show any significant effect (did not surpass ±5%) on the oxidation peak current of amitrole. The results suggested the reduced paper sensor has high selectivity in the detection of amitrole.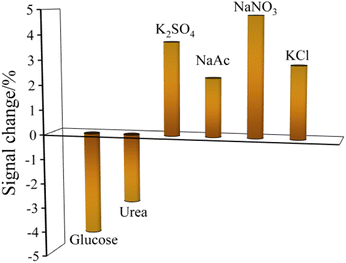 | ||
| Fig. 8 Interference studies of ions and dissolved organic matters in the determination of amitrole by CV technique. | ||
4.2. Analysis of amitrole in water samples
From I–t technique, the practical feasibility of the reduced paper sensor detection of amitrole was demonstrated in lake and tap water samples. First, filter paper was used to remove impurities and dust particles from the water sample. Then, pretreated water samples were prepared with corresponding concentrations of 0.01, 0.02 and 0.03 mM with standard amitrole solutions to study the recovery. The results of water samples evaluation are shown in Table 2. The recovery and relative standard deviation results proved that the reduced paper sensor has practicability in actual environmental samples.| Water samples | Added (10−4 M) | Detected (10−4 M) | Recovery (%) | RSD (%) |
|---|---|---|---|---|
| Tap water | 0.1 | 0.1047 | 104.7 | 3.19 |
| 0.2 | 0.2075 | 103.8 | 5.02 | |
| 0.3 | 0.3020 | 100.7 | 2.34 | |
| Lake water | 0.1 | 0.1016 | 101.6 | 3.81 |
| 0.2 | 0.2036 | 101.8 | 6.59 | |
| 0.3 | 0.3048 | 101.3 | 5.74 |
4.3. Stability and reproducibility
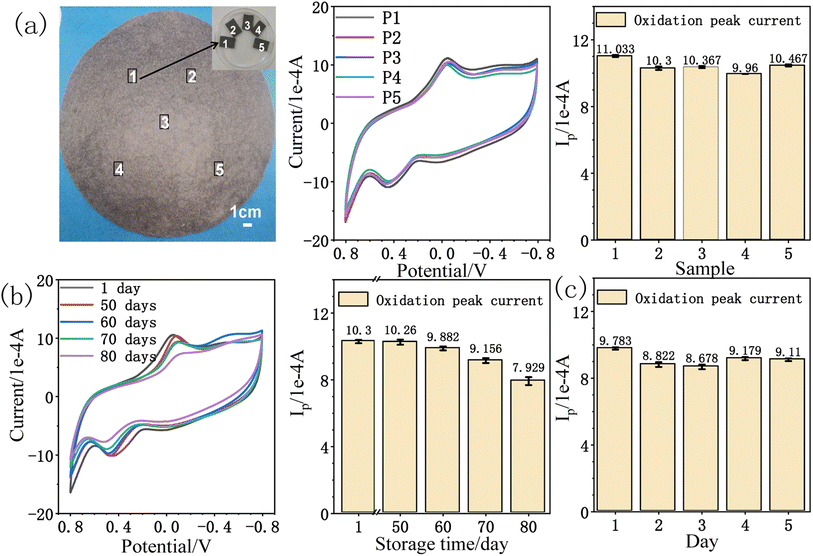
The reduced paper electrode has good current response effect and low detection limit towards amitrole detection. The repeatability54 and stability28 of rPE were investigated by cyclic voltammetry. As illustrated in Fig. 9a, five reduced paper electrodes were taken and tested in PB (pH = 9) solution containing 0.5 mM amitrole at a scan rate of 50 mV s−1. Stable and reproducible current responses for amitrole oxidation were obtained, the average oxidation peak current is 10.43 × 10⁻⁴ A with a relative standard deviation (RSD) of 3.74%, indicating that the inter-electrode reproducibility55 of rPE is very good. To check the storage stability of rPE, it was stored in air at room temperature for 80 days. Fig. 9b shows the CVs and the oxidation peak current of 0.5 mM amitrole during this period. It was found that the current response for amitrole oxidation has reserved more than 95% of the initial value after 60 days. In addition, the CV curves in 0.5 mM amitrole solution for 5 consecutive days tested the repeatability of the electrocatalytic effect of the rPE. As shown in Fig. 9c, the RSD of the oxidation peak current was 4.68%, indicating that the measurement of the rPE can be used multiple times. These results demonstrate that the reduced paper electrode is an efficient and stable electrochemical sensor for amitrole analysis.5. Conclusion
This study shows that paper-based electrodes prepared from carbon fibers (CF), reduced graphene oxide (rGO) and cellulose exhibit excellent performance in electrochemical detection of amitrole. Compared with traditional electrodes, the reduced paper electrode has certain advantages, such as easy fabrication, good reproducibility, storage stability and excellent catalytic activity. The paper electrode has good electrocatalytic performance for the oxidation of amitrole, showing low peak potential, high sensitivity, wide linear range and low detection limit, which is expected to realize the electrochemical detection of pesticides with portable, disposable, patterned paper-based electrodes. The sensitive electrochemical method can detect amitrole at the micro molar level, which is promising as an amperometry-based sensor to determine amitrole content in the field of food safety inspection and agricultural wastewater monitoring.Conflicts of interest
There are no conflicts of interest to declare.Acknowledgements
This work was financially supported by the National Key Research and Development Program of China (2019YFE0114400).References
- V. Mani, R. Devasenathipathy, S. Chen, V. S. Vasantha, M. Ajmal Ali, S. Huang and F. M. A. Al-Hemaid, Analyst, 2015, 140, 5764–5771 RSC
.
- M. Siswana, K. I. Ozoemena and T. Nyokong, Talanta, 2006, 69, 1136–1142 CrossRef CAS PubMed
.
- J. M. Zen, A. Senthil Kumar and M. R. Chang, Electrochim. Acta, 2000, 45, 1691–1700 CrossRef CAS
.
- D. Ilager, N. P. Shetti, K. R. Reddy, S. M. Tuwar and T. M. Aminabhavi, Environ. Res., 2022, 204, 111856 CrossRef
.
- S. J. Malode, K. Keerthi Prabhu and N. P. Shetti, New J. Chem., 2020, 44, 19376–19384 RSC
.
- G. Liu, J. Ling and J. Li, ACS Sens., 2021, 6, 4185–4192 CrossRef
.
- Y. Sun, P. F. Liu, D. Wang, J. Q. Li and Y. S. Cao, J. Agric. Food Chem., 2009, 57, 4540–4544 CrossRef
.
- D. Ilager, H. Seo, N. P. Shetti, S. S. Kalanur and T. M. Aminabhavi, Sci. Total Environ., 2020, 743, 140691 CrossRef
.
- W. Li, Y. Xue, X. Fu, Z. Ma and J. Feng, Food Control, 2022, 133, 108587 CrossRef
.
- G. P. Danezis, C. J. Anagnostopoulos, K. Liapis and M. A. Koupparis, Anal. Chim. Acta, 2016, 942, 121–138 CrossRef CAS
.
- Y. Chu, Z. Tong, X. Dong, M. Sun, T. Gao, J. Duan and M. Wang, Microchem. J., 2020, 156, 104975 CrossRef CAS
.
- M. Chicharro, A. Zapardiel, E. Bermejo and M. Moreno, Talanta, 2003, 59, 37–45 CrossRef CAS
.
- M. Chicharro, M. Moreno, E. Bermejo, S. Ongay and A. Zapardiel, J. Chromatogr. A, 2005, 1099, 191–197 CrossRef CAS PubMed
.
- F. Arduini, S. Cinti, V. Caratelli, L. Amendola, G. Palleschi and D. Moscone, Biosens. Bioelectron., 2019, 126, 346–354 CrossRef CAS PubMed
.
- G. Han, J. Cai, C. Liu, J. Ren, X. Wang, J. Yang and X. Wang, Appl. Surf. Sci., 2021, 541, 148566 CrossRef CAS
.
- M. Siswana, K. Ozoemena and T. Nyokong, Sensors, 2008, 8, 5096–5105 CrossRef CAS PubMed
.
- T. Mugadza and T. Nyokong, Electrochim. Acta, 2010, 55, 2606–2613 CrossRef CAS
.
- Y. Liu, E. Kim, J. Li, M. Kang, W. E. Bentley and G. F. Payne, Nano Commun. Netw., 2017, 11, 76–89 CrossRef
.
- X. Zhu, L. Lin, R. Wu, Y. Zhu, Y. Sheng, P. Nie, P. Liu, L. Xu and Y. Wen, Biosens. Bioelectron., 2021, 179, 113062 CrossRef CAS PubMed
.
- T. E. Winkler, R. Dietrich, E. Kim, H. Ben-Yoav, D. L. Kelly, G. F. Payne and R. Ghodssi, Electrochem. Commun., 2017, 79, 33–36 CrossRef CAS PubMed
.
- N. Elgrishi, K. J. Rountree, B. D. McCarthy, E. S. Rountree, T. T. Eisenhart and J. L. Dempsey, J. Chem. Educ., 2018, 95, 197–206 CrossRef CAS
.
- D. Ilager, H. Seo, N. P. Shetti and S. S. Kalanur, J. Environ. Chem. Eng., 2020, 8, 104580 CrossRef CAS
.
- S. J. Malode, K. Keerthi Prabhu, N. P. Shetti and K. R. Reddy, Environ. Technol. Innovation, 2021, 21, 101222 CrossRef CAS
.
- A. A. Ensafi, M. Amini and B. Rezaei, Colloids Surf., B, 2013, 109, 45–51 CrossRef CAS PubMed
.
- R. Devasenathipathy, Int. J. Electrochem. Sci., 2017, 12, 5888–5897 CrossRef CAS
.
- S. Zhou, H. Xu, J. Liu, Y. Wei, X. Ma, Z. Han and H. Chen, Chem. Phys., 2021, 542, 111074 CrossRef
.
- A. W. Martinez, S. T. Phillips, M. J. Butte and G. M. Whitesides, Angew. Chem., Int. Ed., 2007, 46, 1318–1320 CrossRef
.
- C. Wang, R. Wu, H. Ling, Z. L. Zhao, W. J. Han, X. W. Shi, G. F. Payne and X. H. Wang, npj Flexible Electron., 2022, 6, 1–8 CrossRef
.
- D. Jemmeli, E. Marcoccio, D. Moscone, C. Dridi and F. Arduini, Talanta, 2020, 216, 120924 CrossRef PubMed
.
- J. Bhardwaj, S. Devarakonda, S. Kumar and J. Jang, Sens. Actuators, B, 2017, 253, 115–123 CrossRef
.
- W. Kit-Anan, A. Olarnwanich, C. Sriprachuabwong, C. Karuwan, A. Tuantranont, A. Wisitsoraat, W. Srituravanich and A. Pimpin, J. Electroanal. Chem., 2012, 685, 72–78 CrossRef
.
- T. Wang, R. C. Reid and S. D. Minteer, Electroanal, 2016, 28, 854–859 CrossRef CAS
.
- T. Li, C. Chen, A. H. Brozena, J. Y. Zhu, L. Xu, C. Driemeier, J. Dai, O. J. Rojas, A. Isogai, L. Wågberg and L. Hu, Nature, 2021, 590, 47–56 CrossRef CAS
.
- Y. Wang, J. Luo, J. Liu, S. Sun, Y. Xiong, Y. Ma, S. Yan, Y. Yang, H. Yin and X. Cai, Biosens. Bioelectron., 2019, 136, 84–90 CrossRef CAS
.
- M. Kang, E. Kim, T. E. Winkler, G. Banis, Y. Liu, C. A. Kitchen, D. L. Kelly, R. Ghodssi and G. F. Payne, Biosens. Bioelectron., 2017, 95, 55–59 CrossRef CAS
.
- K. Rahbar Shamskar, H. Heidari and A. Rashidi, Ind. Crop. Prod., 2016, 93, 203–211 CrossRef CAS
.
- P. Ren, D. Yan, X. Ji, T. Chen and Z. Li, Nanotechnology, 2011, 22, 55705 CrossRef
.
- X. Mei and J. Ouyang, Carbon, 2011, 49, 5389–5397 CrossRef CAS
.
- S. J. Dong and Z. Jin, Electrochim. Acta, 1989, 34, 963–968 CrossRef CAS
.
- J. J. Gooding, V. G. Praig and E. A. H. Hall, Anal. Chem., 1998, 70, 2396–2402 CrossRef CAS PubMed
.
- P. T. Mafuwe, M. Moyo, T. Mugadza, M. Shumba and S. Nyoni, J. Solid State Electrochem., 2019, 23, 285–294 CrossRef CAS
.
- A. Maringa, T. Mugadza, E. Antunes and T. Nyokong, J. Electroanal. Chem., 2013, 700, 86–92 CrossRef CAS
.
- P. K. Kalambate, B. J. Sanghavi, S. P. Karna and A. K. Srivastava, Sens. Actuators, B, 2015, 213, 285–294 CrossRef CAS
.
- U. S. Aithal and T. M. Aminabhavi, J. Chem. Educ., 1990, 67, 82–85 CrossRef CAS
.
- M. Chicharro, A. Arribas, M. Moreno, E. Bermejo and A. Zapardiel, Talanta, 2007, 74, 376–386 CrossRef CAS
.
- W. Zhu, H. Huang, X. Gao and H. Ma, Mater. Sci. Eng., C, 2014, 45, 21–28 CrossRef
.
- E. Laviron, J. Electroanal. Chem., 1979, 101, 19–28 CrossRef
.
- S. Corona-Avendaño, G. Alarcón-Angeles, M. T. Ramírez-Silva, G. Rosquete-Pina, M. Romero-Romo and M. Palomar-Pardavé, J. Electroanal. Chem., 2007, 609, 17–26 CrossRef
.
- M. Brycht, K. Kaczmarska, B. Uslu, S. A. Ozkan and S. Skrzypek, Diamond Relat. Mater., 2016, 68, 13–22 CrossRef
.
- A. Salimi and K. Abdi, Talanta, 2004, 63, 475–483 CrossRef PubMed
.
- S. G. Wang, Q. Zhang, R. Wang and S. F. Yoon, Biochem. Biophys. Res. Commun., 2003, 311, 572–576 CrossRef PubMed
.
- M. Gocyla, M. Pisarek, M. Holdynski and M. Opallo, Electrochem. Commun., 2018, 96, 77–82 CrossRef CAS
.
- Q. He, S. Wu, Z. Yin and H. Zhang, Chem. Sci., 2012, 3, 1764–1772 RSC
.
- W. Huang, Talanta, 2003, 61, 411–416 CrossRef CAS PubMed
.
- A. Salimi and R. Hallaj, J. Solid State Electrochem., 2012, 16, 1239–1246 CrossRef CAS
.
| This journal is © The Royal Society of Chemistry 2023 |

