 Open Access Article
Fabrication and catalytic properties of nanorod-shaped (Pt–Pd)/CeO2 composites†
Haiyang Wang‡
a,
Wenyuan Duan‡ a,
Ruiyin Zhanga,
Hao Maa,
Cheng Maa,
Miaomiao Liangb,
Yuzhen Zhaoa and
Zongcheng Miao
 *ac
*ac
aXi'an Key Laboratory of Advanced Photo-electronics Materials and Energy Conversion Device, Key Laboratory of Organic Polymer Photoelectric Materials, School of Electronic Information, Xijing University, Xi'an, 710123, P. R. China
bSchool of Materials Science and Engineering, Xi'an Polytechnic University, Xi'an, Shaanxi 710048, P. R. China
cSchool of Artificial Intelligence, Optics and Electronics (iOPEN), Northwestern Polytechnical University, Xi'an, Shaanxi 710072, P. R. China. E-mail: miaozongcheng@nwpu.edu.cn
First published on 18th January 2023
Abstract
Nanorod-supported (Pt–Pd)/CeO2 catalysts were synthesized by a simple method of dealloying Al91.7Ce8 PtXPd0.3−X (X = 0, 0.075, 0.1, 0.15, 0.2, 0.3) alloy ribbons. SEM and TEM characterization implied that after calcination treatment, the achieved resultants exhibited interspersed nanorod structures with a rich distribution of nanopores. Catalytic tests showed that the (Pt0.1–Pd0.2)/CeO2 catalyst calcined at 300 °C exhibited the highest catalyst activity for CO oxidation when compared with other catalysts prepared at different noble metal ratios or calcined at other temperatures, whose complete reaction temperature was as low as 100 °C. The outstanding catalytic performance is ascribed to the stable framework structure, rich gas pathways and collaborative effect between the noble Pt and Pd bimetals.
1. Introduction
Because of the flammability and easy-explosion feature of CO, which is generated in daily life and industrial production, it is important to eliminate CO.1 Even though the oxidation of CO to CO2 is a good method to eliminate CO pollution, it always requires large energy consumption and strict conditions during the process. Catalytic oxidation of CO is an efficient method to get rid of CO pollution at low/room temperatures.2–4 As the earliest proposed type of catalysts, noble metals such as Pd, Pt, Rh, and Au exhibit high activity for CO oxidation.5–7 Pt group metal-based catalysts play an important role in the catalytic field because of their strong activity and wide applications, but the high price and low efficiency of a single atom of Pt hinder its further development.8 Partial introduction of Pd, a cheaper noble metal into Pt can not only reduce the cost but can also enhance catalytic efficiency and avoid CO poisoning.9,10 Suzanne Giorgio et al. achieved partial institution of Pt to Pd and obtained core–shell structured Pt–Pd nanotubes.11 The Garcia's team synthesized bimetallic clusters by doping Pd into Au25 and demonstrated the strongly enhanced CO conversion of bimetallic catalysts.12Ceria (CeO2), a rare metal oxide with abundant reserves on the earth, is known to be a good supporting oxide for catalysis due to its outstanding store/release oxygen ability through a reversible and fast Ce4+/Ce3+ reaction.13–15 Moreover, the low energy for oxygen vacancy formation and oxygen diffusion as well as superior thermal stability makes CeO2 an ideal material for gas catalytic usage. CeO2-noble metal-based catalysts with rich morphologies and facets such as nanorods,16 nanocubes,17 particles,18 and octahedra,19 have been widely reported. The Neyman's group20 synthesized Pt/CeO2 catalyst with different Pt loading by a co-precipitation method and observed the CO oxidation activity at low temperatures. Xu and his collaborators21 loaded Au on ZIF-8 successfully through the solid grinding method, and the obtained Au@ZIF-8 catalyst showed good activity. However, the preparation conditions for these catalysts usually need high economic costs with low yield, and their practical and industrial production is still a challenge.
Recently, the dealloying method has generated wide attraction for the preparation of nanomaterials because of its simple and effective fabrication features.22,23 The morphology and size of materials can be controlled by changing corrosion or post-treatment conditions or by adjusting the composition and content of alloys. The CeO2-noble metal-based catalysts, such as Rh/CeO2,24 Au/CeO2,25 and CeO2-transition metal (oxide)-based catalysts such as baize-like NiO/CeO2,26 Cu/CeO2,27 have been successfully fabricated by a dealloying method and displayed outstanding catalytic activity for CO oxidation because of the large surface area and high porosity of the porous structured materials. However, the influence and mechanism of bimetal loading on CeO2 need further investigation.
Inspired by the above considerations, herein, the nanorod-supported (Pt–Pd)/CeO2 catalysts with varied Pt/Pd ratios were prepared by dealloying Al–Ce–Pt–Pd alloy ribbons followed by corrosion and calcination treatment for catalytic CO oxidation. Results show that the obtained samples exhibited stable framework structure and large amounts of pathways for gas entry/exit due to the interspersed nanorods and the joint effect of Pt/Pd as well as the formation of rich nanopores among nanorods. The (Pt0.1–Pd0.2)/CeO2 catalyst exhibited the best catalytic performance with 50% and 99% conversion at temperatures (T50, T99) as low as 75 °C and 100 °C, respectively.
2. Experimental section
2.1 Material preparation
The precursor alloy ingots of Al92Ce8, Al91.7Ce8PtX–Pd0.3−X (X = 0, 0.075, 0.1, 0.15, 0.2, 0.3) were fabricated from pure metal Al, Ce, Pt, Pd by arc-melting under high-purity Ar atmosphere. The obtained alloy ingots were then remelted in a quartz tube and blown onto a copper cooling roll to achieve an alloy ribbon with a width of 4–6 mm and a thickness of 40–70 μm. Next, the quenched ribbons were immersed into 20 wt% NaOH aqueous solution at room temperature for 2 hours until no bubbles generated and then further immersed at 353 K for 10 hours. Ultimately, the de-alloyed ribbons were dried and calcined at 473–773 K for 2 h in a pure O2 environment. The samples derived from Al–Ce–Pt–Pd precursors were denoted as (PtX–Pd0.3−X)/CeO2 (X = 0.075, 0.1, 0.15, 0.2). The subscript number of Pt and Pd in (PtX–Pd0.3−X)/CeO2 refers to their respective atomic proportion in the Al91.7Ce8PtXPd0.3−X precursor.2.2 Characterization
The phase composition was investigated by X-ray diffractometry (XRD, Bruker D8 Advance). The surface morphologies and microstructures of the fabricated catalysts were characterized by field emission scanning electron microscopy (FESEM, JEOL, JSM-7000F) and high-resolution transmission electron microscopy (HRTEM, JEOL, JEM-2100). EDS analysis and mapping were performed by scanning transmission electron microscopy (STEM, FEI-200) equipped with an Oxford Instrument's EDS spectrometer. The element composition and valence state were measured using an X-ray photoelectron spectrophotometer (XPS, ESCALAB Xi+). Nitrogen sorption isotherms and specific surface area were measured on a Micromeritics ASAP 2020 instrument at 77 K, and the pore size distributions were obtained from the desorption branch of the isotherm using the Barrett–Joyner–Halenda algorithm. Raman spectra were collected using an HR 800 fully automatic laser Raman spectrometer with a laser wavelength of 633 nm. Hydrogen temperature-programmed reduction (H2-TPR) measurements were performed on an Auto ChemTM II 2920 chemisorption analyzer.2.3 Catalytic evaluations
The catalytic performance of the fabricated catalysts was studied using a tube furnace with a fixed bed flow reactor under atmospheric pressure. A 100 mg tested sample was placed into the reactor and fixed with quartz wool. The feeding gas with a mixture of 1% CO, 10% O2, and 89% N2 (volume fraction) was injected into the test system at a flow rate of 100 mL min−1 and space velocity of 60![[thin space (1/6-em)]](https://www.rsc.org/images/entities/char_2009.gif) 000 h−1. The intake and outlet gases were analysed using an Anglit 7890B gas chromatograph equipped with a hydrogen flame detector (FID). The CO conversion can be calculated by eqn (1)
000 h−1. The intake and outlet gases were analysed using an Anglit 7890B gas chromatograph equipped with a hydrogen flame detector (FID). The CO conversion can be calculated by eqn (1)
 | (1) |
3. Results and discussion
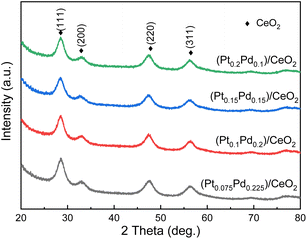
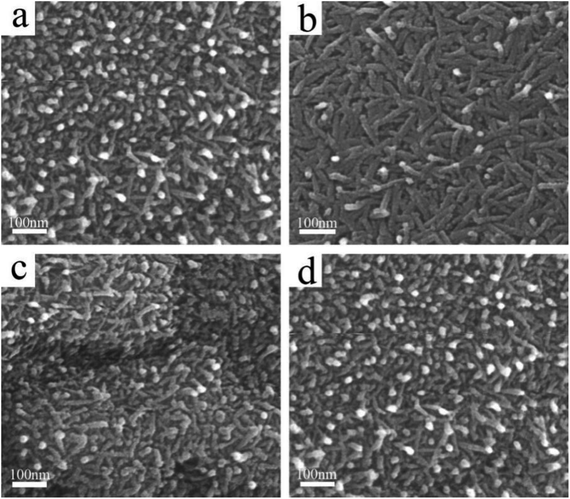
In this work, a facile combined dealloying and calcination method is proposed to fabricate a nanorod-supported bimetal/CeO2 framework structure (Fig. S1†). The XRD patterns of the melt-spun ribbon precursor and de-alloyed Al91.7Ce8Pt0.1Pd0.2 ribbons are shown in Fig. S2,† while the de-alloyed ribbons with varied Pt/Pd content after calcination treatment are displayed in Fig. 1. As observed in Fig. S2,† the melt-spun ribbons consist of α-Al, Al92Ce8, and Al4Ce phases; after the de-alloying treatment, the peaks representing α-Al, Al92Ce8 and Al4Ce disappeared, while the new diffraction peaks corresponding to CeO2 were detected, which may be due to the fact that the precursor ribbons decomposed during the de-alloying procedure. The XRD patterns of the four de-alloyed Al–Ce–Pt–Pd ribbons after calcination treatment are presented in Fig. 1; the diffraction peaks located at 28.64°, 33.06°, 47.56° 56.22° correspond to (111), (200), (220), (311) planes, respectively, of cubic CeO2 (PDF# 89-8436).28,29 No diffraction peaks corresponding to Al, Pt, and Pd were detected in the (PtX–Pd0.3−X)/CeO2 samples (Fig. 1), demonstrating that Al has been completely removed from the material system. What is more, Pt and Pd were also not detected, which could be due to the low content and high dispersity of the two noble elements in the material system as well as the poor crystallinity of the samples.The surface microstructures of the de-alloyed Al–Ce–Pt–Pd with varied Pt/Pd content calcined at 573 K were characterized by SEM (Fig. 2). The samples are composed of nanorods, which intersperse and stack each other to form a nanorod-supported framework structure with rich nanopores distributed among them. The diameter of nanorods is 5–10 nm. As the total content of Pt and Pd in Al–Ce–Pt–Pd alloy keeps 0.3 at%, and when the Pt content is increased to 0.075 at% (Fig. 2a), 0.1 at% (Fig. 2b), 0.15 at% (Fig. 2c) and 2 at% (Fig. 2d), respectively, the surface microstructure of the sample stayed similar and did not change significantly. However, the interspersed nanorods help stabilize the framework structure of samples; the existence of rich nanopores can provide more pathways for the gas to enter/exit, thus enhancing the catalytic oxidation rate.24 The SEM images of (Pt0.1–Pd0.2)/CeO2 calcined at different temperatures are shown in Fig. S3.† As observed, even though the nanorods of (Pt0.1–Pd0.2)/CeO2 are coarsened after calcining at 300 °C, and 500 °C, when compared with samples without the calcination treatment, their overall morphology remained unchanged, implying outstanding thermal stability.
TEM studies were conducted to obtain a more detailed microstructure information of (PtX–Pd0.3−X)/CeO2. As observed from the TEM images of (Pt0.075–Pd0.225)/CeO2 (Fig. 3a), (Pt0.1–Pd0.2)/CeO2 (Fig. 3c), (Pt0.15–Pd0.15)/CeO2 (Fig. 3e), (Pt0.2–Pd0.1)/CeO2 (Fig. 3g), the black nanoparticles with an average diameter of 3–5 nm are homogeneously loaded onto the surface of nanorod; the nanorod with an average diameter of 10 nm pile up on each other to form an interconnected structure, which is in line with SEM results. In the HRTEM images shown in Fig. 3b, d, f and h, the interplanar space of 0.32 nm corresponds to the (111) plane of the cubic structure of CeO2 nanorods; the lattice fringe widths of 0.229 nm and 0.264 nm for the black particles semi-inlaid onto nanorod corresponded to the (111) and (101) planes of Pt and PdO, respectively, demonstrating that Pt and PdO were successfully loaded onto the CeO2 nanorod surface. Noteworthy, the introduced Pt and PdO were close to each other, which helps the synergistic effect between them and promotes the respective adsorption and oxidation of CO during the catalytic process, thus contributing to the enhancement of the catalytic performance of (Pt–Pd)/CeO2 catalysts.
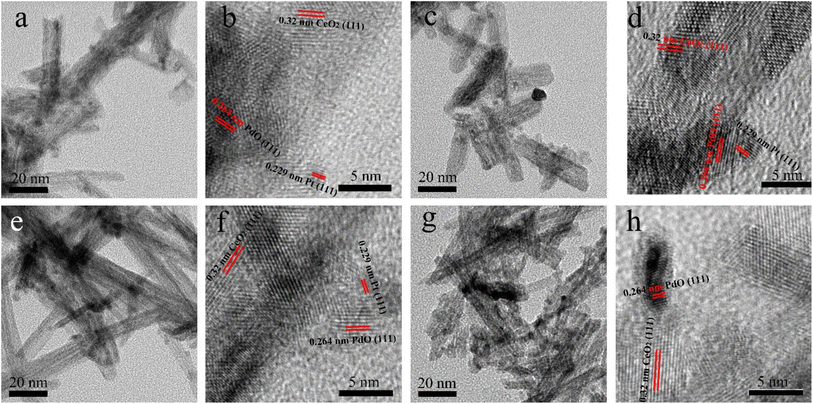 | ||
| Fig. 3 The TEM and HRTEM images of (a and b) (Pt0.075–Pd0.225)/CeO2, (c and d) (Pt0.1–Pd0.2)/CeO2, (e and f) (Pt0.15–Pd0.15)/CeO2, (g and h) (Pt0.2–Pd0.1)/CeO2. | ||
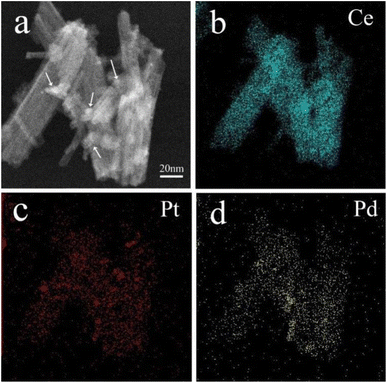
STEM mapping characterization was utilized to analyze the distribution of elements on the surface of CeO2 nanorods in (Pt0.1–Pd0.2)/CeO2 catalyst and the results are shown in Fig. 4. As clearly observed from Fig. 4a, Pt, and PdO are in situ loaded on the surface of CeO2 nanorods in the form of nanoparticles (indicated by white arrows). Fig. 4b–d further demonstrates that the sample consists of Ce, Pt, and Pd elements, and they are homogeneously distributed among nanorods.
The N2 adsorption–desorption studies were conducted to determine the surface area, pore size, and distribution in the samples. As shown from the nitrogen adsorption–desorption isotherms of four (Pt–Pd)/CeO2 catalysts shown in Fig. 5a, all of them exhibit type-IV isotherm with a type-H3 hysteresis loop at a relative pressure range of 0.65–1.0 P/P0, implying the existence of the mesoporous structure.30 The BET surface areas of (Pt0.075–Pd0.225)/CeO2, (Pt0.1–Pd0.2)/CeO2, (Pt0.15–Pd0.15)/CeO2, (Pt0.2–Pd0.1)/CeO2 are 122.50, 120.19, 136.43, 132.54 m2 g−1, respectively. What is more, the BHJ pore-size distribution curves in Fig. 5b present a uniform pore-size distribution located at 10–13 nm, further illustrating the mesoporous structure feature of the four samples.31 The pore volumes for (Pt0.075–Pd0.225)/CeO2, (Pt0.1–Pd0.2)/CeO2, (Pt0.15–Pd0.15)/CeO2, (Pt0.2–Pd0.1)/CeO2 are 0.33, 0.33, 0.44, 0.34 cm3 g−1. Obviously, all of the de-alloyed samples after the calcination treatment displayed higher specific surface area and lower pore diameter when compared with that of the pure CeO2 nanorod framework reported in the previous work.32 In addition, although the added proportion of Pt and Pd varies as the total content stays unchanged, the partial replacement of Pt with Pd did not affect the physical structure parameters of the material significantly, so the specific surface area and porosity of the four samples are quite similar.
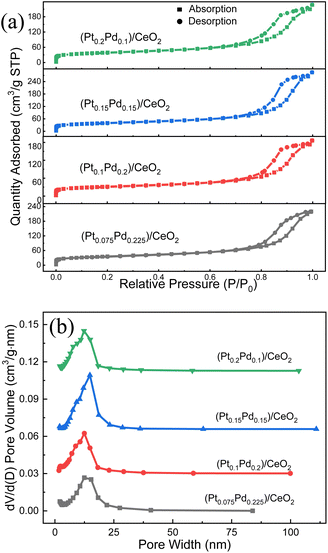 | ||
| Fig. 5 (a) Nitrogen adsorption–desorption isotherms and (b) the BHJ pore size distribution of the de-alloyed (Pt–Pd)/CeO2 nanorods. | ||
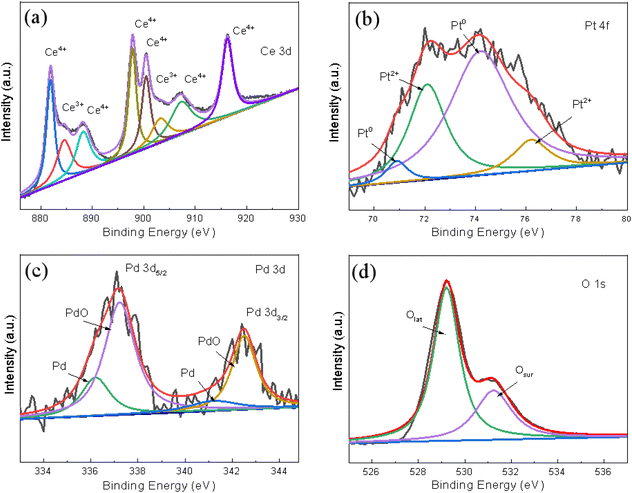
The chemical valence of the surface elements was confirmed using XPS and the typically fitted Ce 3d, Pt 4f, Pd 3d, O 1s XPS spectra of the (Pt0.1–Pd0.2)/CeO2 catalyst as obtained by the Gaussian fitting method, and presented in Fig. 6a–d, respectively. In Fig. 6a, the Ce 3d spectrum is fitted with six spin–orbit split doublets and two shake-up satellites. The binding energies at 881.9 eV, 888.2 eV, and 897.7 eV for Ce 3d5/2 and 900.4 eV, 907.3 eV, 916.2 eV for Ce 3d3/2 are characteristic of Ce4+, and the peaks located at 884.5 eV, 903.3 eV are assigned to Ce3+.30,33 Since the concentration of Ce3+ can be reflected from the integrated areas of peaks, the surface Ce3+ concentration of total Ce on the (Pt0.1–Pd0.2)/CeO2 nanorod framework is 18.26% (Fig. 6a). In Fig. 6b, the two peaks at 70.9 eV and 74.2 eV are assigned to Pt0,34 while the binding energies at 72.1 eV for Pt 4f7/2 and 76.1 eV for Pt 4f5/2 correspond to Pt2+.35 Similarly, the 63.3% percentage of Pt0 can be achieved by calculating the fitting areas of Pt0/(Pt0 + Pt2+). In the Pd 3d spectrum shown in Fig. 6c, both metallic Pd and ionic Pd2+ can be clearly detected in (Pt0.1–Pd0.2)/CeO2 catalyst. The peaks at 336.2 eV and 341.2 eV correspond to Pd 3d5/2 of Pd0; the binding energies at 337.2 eV for Pd 3d5/2 and 342.5 eV for Pd 3d5/2 belong to Pd2+.36 The Pd2+ concentration of total Pd is 71% and the ratio between Pd0 and Pd2+ is around 3![[thin space (1/6-em)]](https://www.rsc.org/images/entities/char_2009.gif) :
:![[thin space (1/6-em)]](https://www.rsc.org/images/entities/char_2009.gif) 7. For the O 1s spectrum in Fig. 6d, the peaks at 529.2 eV, 531.2 eV correspond to lattice oxygen (Olat), surface adsorbed oxygen (Osur), respectively.37 The calculation results show that the ratio of Osur can reach as high as 31%. Since Osur with better activity can stabilize the sample structure and promote the catalytic oxidation rate, the high ratio of Osur in (Pt0.1–Pd0.2)/CeO2 is beneficial for enhancing the catalytic property of (Pt–Pd)/CeO2.
7. For the O 1s spectrum in Fig. 6d, the peaks at 529.2 eV, 531.2 eV correspond to lattice oxygen (Olat), surface adsorbed oxygen (Osur), respectively.37 The calculation results show that the ratio of Osur can reach as high as 31%. Since Osur with better activity can stabilize the sample structure and promote the catalytic oxidation rate, the high ratio of Osur in (Pt0.1–Pd0.2)/CeO2 is beneficial for enhancing the catalytic property of (Pt–Pd)/CeO2.
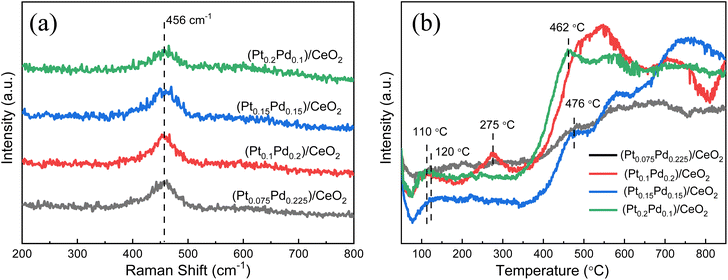
Raman studies were conducted to further illustrate the molecular structure of the samples. Four kinds of (Pt–Pd)/CeO2 catalysts with varied Pt/Pd ratios, an apparent peak located at 456 cm−1 can be observed (Fig. 7a), which is attributed to the F2g vibrational mode of CeO2 originating from the breathing mode of oxygen anions around Ce cations.38,39 Compared with the Raman result of pure CeO2 shown in Fig. S4,† the peak intensity of (Pt–Pd)/CeO2 catalysts is greatly decreased, and the diffraction location is shifted from 459 cm−1 to 456 cm−1, which is due to the generation of more grain boundaries brought from grain refinement after the addition of Pt and Pd nanoparticles into the material system. H2-TPR measurements were also adopted to investigate the reducibility of samples, as shown in Fig. 7b. For (Pt0.075–Pd0.225)/CeO2, (Pt0.1–Pd0.2)/CeO2, (Pt0.15–Pd0.15)/CeO2 and (Pt0.2–Pd0.1)/CeO2 catalysts, the H2 consumption peaks were located around 110–120 °C and are assigned to Pt and Pd nanoparticles; the strong peak at around 470 °C is related to active oxygen species of CeO2, whereas the reduction peaks at 700–800 °C are bonded to lattice oxygen of CeO2 that is not closely related to catalytic capacity.29,40 By contrast, the integrated peak area of active oxygen for (Pt0.1–Pd0.2)/CeO2 and (Pt0.15–Pd0.15)/CeO2 is significantly higher than that of the other two catalysts, revealing their higher reducibility and superior catalytic performance. Notably, only a reduction peak at 275 °C is observed for the (Pt0.1–Pd0.2)/CeO2 catalyst, which may be related to the ionic state of Pt.
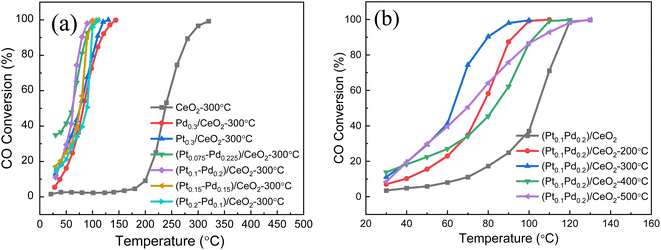
The catalytic performance of the (Pt–Pd)/CeO2 nanorod-supported framework catalysts with varied Pt/Pd content towards CO catalytic oxidation is displayed in Fig. 8. For Pt0.3/CeO2 prepared from de-alloyed Al91.7Ce8Pt0.3 calcined at 573 K, the 50% catalytic CO oxidation temperature (T50) and CO complete conversion temperature (T99) are 91 °C and 113 °C, respectively, which are much better than those for pure CeO2 calcined at 573 K (T50 = 235 °C, T99 = 320 °C). The percentage of Pd in the system was continuously increased and when Pt/Pd = 0.2![[thin space (1/6-em)]](https://www.rsc.org/images/entities/char_2009.gif) :
:![[thin space (1/6-em)]](https://www.rsc.org/images/entities/char_2009.gif) 0.1, the catalytic properties were further improved with T50 and T99 decreasing to 83 °C and 110 °C, respectively. The catalytic performance of the catalyst was the best when Pt/Pd = 0.1
0.1, the catalytic properties were further improved with T50 and T99 decreasing to 83 °C and 110 °C, respectively. The catalytic performance of the catalyst was the best when Pt/Pd = 0.1![[thin space (1/6-em)]](https://www.rsc.org/images/entities/char_2009.gif) :
:![[thin space (1/6-em)]](https://www.rsc.org/images/entities/char_2009.gif) 0.2, and corresponding 50% and 99% CO conversion temperatures reached as low as 75 °C and 100 °C, respectively. The three repeated catalytic performance tests demonstrate the reproducibility of the (Pt0.2–Pd0.1)/CeO2 catalyst (Fig. S5†). By further improving the ratio of Pd to Pt
0.2, and corresponding 50% and 99% CO conversion temperatures reached as low as 75 °C and 100 °C, respectively. The three repeated catalytic performance tests demonstrate the reproducibility of the (Pt0.2–Pd0.1)/CeO2 catalyst (Fig. S5†). By further improving the ratio of Pd to Pt![[thin space (1/6-em)]](https://www.rsc.org/images/entities/char_2009.gif) :
:![[thin space (1/6-em)]](https://www.rsc.org/images/entities/char_2009.gif) Pd = 1
Pd = 1![[thin space (1/6-em)]](https://www.rsc.org/images/entities/char_2009.gif) :
:![[thin space (1/6-em)]](https://www.rsc.org/images/entities/char_2009.gif) 3, the catalytic performance decreased (T50 = 83 °C, T99 = 130 °C). Noteworthily, for (Pt0.1–Pd0.2)/CeO2 catalyst, the temperature difference between T50 and T99 is 25 °C, which is smaller than that for catalysts at other Pt/Pd ratios and significantly better than that for pure CeO2 (80 °C), implying superior catalytic property of (Pt–Pd)/CeO2 (Fig. 8a). The influence of calcination temperature on the CO conversion rate is also discussed and the data are shown in Fig. 8b. The total CO conversion temperatures of (Pt0.1–Pd0.2)/CeO2 at calcination temperatures of 0 °C, 200 °C, 300 °C, 400 °C, 500 °C is 130 °C, 100 °C, 100 °C, 110 °C, 130 °C, respectively, revealed that the catalytic activity is premium at an annealing temperature of 300 °C. The catalytic activity of (Pt0.1–Pd0.2)/CeO2 also surpasses that of the state-of-the-art CeO2-based catalysts reported in the literature, as shown in Table S1.41–45 †
3, the catalytic performance decreased (T50 = 83 °C, T99 = 130 °C). Noteworthily, for (Pt0.1–Pd0.2)/CeO2 catalyst, the temperature difference between T50 and T99 is 25 °C, which is smaller than that for catalysts at other Pt/Pd ratios and significantly better than that for pure CeO2 (80 °C), implying superior catalytic property of (Pt–Pd)/CeO2 (Fig. 8a). The influence of calcination temperature on the CO conversion rate is also discussed and the data are shown in Fig. 8b. The total CO conversion temperatures of (Pt0.1–Pd0.2)/CeO2 at calcination temperatures of 0 °C, 200 °C, 300 °C, 400 °C, 500 °C is 130 °C, 100 °C, 100 °C, 110 °C, 130 °C, respectively, revealed that the catalytic activity is premium at an annealing temperature of 300 °C. The catalytic activity of (Pt0.1–Pd0.2)/CeO2 also surpasses that of the state-of-the-art CeO2-based catalysts reported in the literature, as shown in Table S1.41–45 †
Fig. 9a explores the influence of O2 concentration in the feed gas on the catalytic performance of (Pt0.1–Pd0.2)/CeO2. The test temperature was maintained at 373 K with a flow rate 100 mL min−1. When 10% O2 was initially infused into the system, the CO conversion rate could reach 99% because of the sufficient O2 environment; the CO conversion rate was reduced first and then kept stable at 7% when the O2 supply was suddenly decreased to zero, which may be ascribed to the existence of surface lattice oxygen that can migrate to active sites and combine with adsorbed CO to form oxygen vacancies. However, the CO conversion rate increases in poor oxygen conditions (0.5–1% O2) and then recovers to the initial 99% value and remained unchanged when O2 was resupplied into the feed gas, implying the superior catalytic CO oxidation property of (Pt0.1–Pd0.2)/CeO2. The long-term stability and anti-CO2/H2O poisoning ability were also investigated and the data are displayed in Fig. 9b. The (Pt0.1–Pd0.2)/CeO2 catalyst possesses a 98% conversion rate under the mixed atmosphere of 1% CO, 10% O2, 89% N2, 10% H2O and remained stable without degradation after 70 h of successive reaction; when 5% CO2 was injected into the infused gas, the adsorption of CO per unit time can be reduced due to the existence of CO competitive adsorption on the surface of (Pt0.1–Pd0.2)/CeO2 nanorods, but the CO conversion rate was still maintained around 90% after 60 h, further demonstrating the superior stable catalytic performance and water resistance of the (Pt0.1–Pd0.2)/CeO2 catalyst.
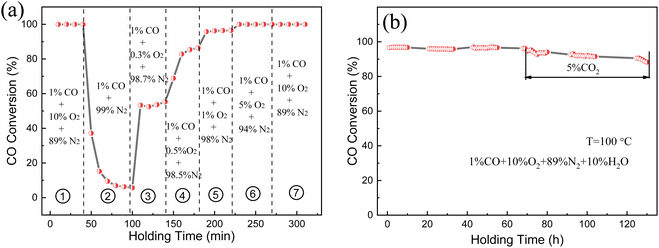 | ||
| Fig. 9 (a) Catalytic performance under varied oxygen concentrations and (b) long-term stability of the (Pt0.1–Pd0.2)/CeO2-573 K catalyst. | ||
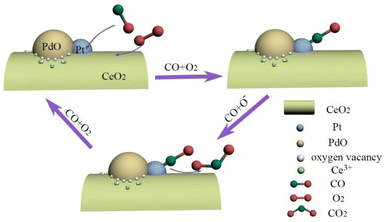
A possible mechanism for catalytic CO oxidation on (Pt–Pd)/CeO2 catalyst is proposed and presented in Scheme 1. Mesoporous structured (Pt–Pd)/CeO2 catalysts with a high specific surface area can be obtained by introducing Pt and Pd in various proportions. High specific surface area can bring more active sites and provide sufficient reaction paths for catalysis. The (Pt–Pd)/CeO2 catalyst contains a high concentration of Ce3+ ions and active oxygen atoms; the highly concentrated Ce3+ can adsorb the required active oxygen on the catalytic interface, which is conducive for the formation of the active centres at the interface. The catalytic performance of the catalyst reached optimum when the same amounts of Pt and Pd were introduced into Al–Ce precursor alloys, which is attributed to the synergetic effect among Pt and PdO nanoparticles, as well as Pt/PdO and CeO2 nanorods. In the catalytic process, CO is adsorbed onto the surface of Pt and PdO and reacts with oxygen species, which contributes to the formation of CO2 and oxygen vacancies. The addition of Pt and PdO can accelerate the migration rate of oxygen species, and produce active oxygen species that can combine with activated CO quickly, then the catalytic rate and catalytic performance are enhanced.
4. Conclusions
In summary, the nanorod-supported nanoporous (Pt–Pd)/CeO2 catalysts were prepared through a novel dealloying method and calcination treatment. The obtained (Pt–Pd)/CeO2 prepared from Al91.7Ce8PtX–Pd0.3−X (X = 0, 0.075, 0.1, 0.15, 0.2, 0.3) exhibits an interspersed nanorod structure with rich nanopores distributed among them. The catalytic performance reaches best with a T50 temperature of 75 °C and total reaction temperature as low as 100 °C when the Pt/Pd ratio is 0.1![[thin space (1/6-em)]](https://www.rsc.org/images/entities/char_2009.gif) :
:![[thin space (1/6-em)]](https://www.rsc.org/images/entities/char_2009.gif) 0.2. It is believed that the robust framework structure and the synergistic effect of Pt, Pd as well as rich nanopores among nanorods contribute to the high catalytic activity of (Pt–Pd)/CeO2. These results provide new ideas for the fabrication of catalysts with high catalytic activity by combining earth metal oxides with noble bimetal materials.
0.2. It is believed that the robust framework structure and the synergistic effect of Pt, Pd as well as rich nanopores among nanorods contribute to the high catalytic activity of (Pt–Pd)/CeO2. These results provide new ideas for the fabrication of catalysts with high catalytic activity by combining earth metal oxides with noble bimetal materials.
Author contributions
Haiyang Wang and Zongcheng Miao conceived the idea and directed the experiments. Wenyuan Duan fabricated all the samples. Ruiyin Zhang, Hao Ma, and Cheng Ma conducted the characterizations. Miaomiao Liang and Yuzhen Zhao analyzed the data. Haiyang Wang and Wenyuan Duan drafted the manuscript. All the authors discussed the results and reviewed the manuscript.Conflicts of interest
The authors declare that they have no known competing financial interests or personal relationships that could have appeared to influence the work reported in this work.Acknowledgements
This work was supported by the National Natural Science Foundation of China (Grant No. 52173263), the Regional Innovation Capability Guidance Program of Shaanxi (No. 2022QFY03-02), the Natural Science Foundation of Anhui Province, China (No. 2108085J11), Natural Science Basic Research Plan in Shaanxi Province of China (Program No. 2022JQ-533), the Scientific Research Program Funded by Shaanxi Provincial Education Department (No. 22JK0595, 22JK0590, 22JK0592, 22JP100), the Fundamental Research Funds for the Central Universities, Northwestern Polytechnical University (No. D5000210825), the Scientific research fund for high-level talents of Xijing University (No. XJ21B17) and the Youth Innovation Team of Shaanxi Universities.References
- H. Akimoto, Global air quality and pollution, Science, 2003, 302, 1716–1719 CrossRef CAS PubMed.
- H. Falsig, B. Hvolbaek, I. S. Kristensen, T. Jiang, T. Bligaard, C. H. Christensen and J. K. Norskov, Trends in the catalytic CO oxidation activity of nanoparticles, Angew. Chem., Int. Ed. Engl., 2008, 47, 4835–4839 CrossRef CAS PubMed.
- H. Zhang, S. Fang and Y. H. Hu, Recent advances in single-atom catalysts for CO oxidation, Catal. Rev., 2020, 64, 491–532 CrossRef.
- L. N. Wang, X. N. Li and S. G. He, Recent research progress in the study of catalytic CO oxidation by gas phase atomic clusters, Sci. China Mater., 2019, 63, 892–902 CrossRef.
- C. Feng, X. Liu, T. Zhu and M. Tian, Catalytic oxidation of CO on noble metal-based catalysts, Environ. Sci. Pollut. Res. Int., 2021, 28, 24847–24871 CrossRef CAS PubMed.
- S. W. Chee, J. M. Arce-Ramos, W. Li, A. Genest and U. Mirsaidov, Structural changes in noble metal nanoparticles during CO oxidation and their impact on catalyst activity, Nat. Commun., 2020, 11, 2133 CrossRef CAS PubMed.
- H. Ha, S. Yoon, K. An and H. Kim, Catalytic CO oxidation over Au nanoparticles supported on CeO2 nanocrystals: Effect of the Au-CeO interface, ACS Catal., 2018, 8, 11491–11501 CrossRef CAS.
- J. Waikar, H. Pawar and P. More, Review on CO oxidation by noble and non-noble metal based catalyst, Catal. Green Chem. Eng., 2019, 2, 11–24 CrossRef CAS.
- M. A. van Spronsen, J. W. M. Frenkenb and I. M. N. Groot, Surface science under reaction conditions: CO oxidation on Pt and Pd model catalysts, Chem. Soc. Rev., 2017, 46, 4347–4374 RSC.
- A. Parinyaswan, S. Pongstabodee and A. Luengnaruemitchai, Catalytic performances of Pt-Pd/CeO2 catalysts for selective CO oxidation, Int. J. Hydrogen Energy, 2006, 31, 1942–1949 CrossRef CAS.
- A. De Clercq, O. Margeat, G. Sitja, C. R. Henry and S. Giorgio, Core-shell Pd–Pt nanocubes for the CO oxidation, J. Catal., 2016, 336, 33–40 CrossRef CAS.
- C. Garcia, V. Truttmann, I. Lopez, T. Haunold, C. Marini, C. Rameshan, E. Pittenauer, P. Kregsamer, K. Dobrezberger, M. Stoger-Pollach, N. Barrabes and G. Rupprechter, Dynamics of Pd dopant atoms inside Au nanoclusters during catalytic CO oxidation, J. Phys. Chem. C, 2020, 124, 23626–23636 CrossRef CAS PubMed.
- H. J. Kim, M. G. Jang, D. Shin and J. W. Han, Design of Ceria catalysts for low-temperature CO Oxidation, ChemCatChem, 2019, 12, 11–26 CrossRef.
- F. Maurer, A. Beck, J. Jelic, W. Wang, S. Mangold, M. Stehle, D. Wang, P. Dolcet, A. M. Gänzler, C. Kübel, F. Studt, M. Casapu and J.-D. Grunwaldt, Surface noble metal concentration on Ceria as a key descriptor for efficient catalytic CO oxidation, ACS Catal., 2022, 12, 2473–2486 CrossRef CAS.
- K. Polychronopoulou, A. A. AlKhoori, A. M. Efstathiou, M. A. Jaoude, C. M. Damaskinos, M. A. Baker, A. Almutawa, D. H. Anjum, M. A. Vasiliades, A. Belabbes, L. F. Vega, A. F. Zedan and S. J. Hinder, Design aspects of doped CeO2 for low-temperature catalytic CO oxidation: Transient Kinetics and DFT Approach, ACS Appl. Mater. Interfaces, 2021, 13, 22391–22415 CrossRef CAS PubMed.
- J. Li, Z. Liu, D. A. Cullen, W. Hu, J. Huang, L. Yao, Z. Peng, P. Liao and R. Wang, Distribution and valence state of Ru species on CeO2 supports: support shape effect and its influence on CO oxidation, ACS Catal., 2019, 9, 11088–11103 CrossRef CAS.
- G. Spezzati, A. D. Benavidez, A. T. DeLaRiva, Y. Su, J. P. Hofmann, S. Asahina, E. J. Olivier, J. H. Neethling, J. T. Miller, A. K. Datye and E. J. M. Hensen, CO oxidation by Pd supported on CeO2(100) and CeO2(111) facets, Appl. Catal., B, 2019, 243, 36–46 CrossRef CAS.
- F. Dong, Y. Meng, W. Han, H. Zhao and Z. Tang, Morphology effects on surface chemical properties and lattice defects of Cu/CeO2 catalysts applied for low-temperature CO oxidation, Sci. Rep., 2019, 9, 12056 CrossRef PubMed.
- H. Ha, S. Yoon, K. An and H. Kim, Catalytic CO oxidation over Au nanoparticles supported on CeO2 nanocrystals: Effect of the Au-CeO interface, ACS Catal., 2019, 9, 12056 Search PubMed.
- A. I. Boronin, E. M. Slavinskaya, A. Figueroba, A. I. Stadnichenko, T. Y. Kardash, O. A. Stonkus, E. A. Fedorova, V. V. Muravev, V. A. Svetlichnyi, A. Bruix and K. M. Neyman, CO oxidation activity of Pt/CeO2 catalysts below 0 °C: platinum loading effects, Appl. Catal., B, 2021, 286, 119931 CrossRef CAS.
- H. Jiang, B. Liu, T. Akita, M. Haruta, H. Sakurai and Q. Xu, Au@ZIF-8: CO oxidation over gold nanoparticles deposited to metal-organic framework, J. Am. Chem. Soc., 2009, 131, 11302–11303 CrossRef CAS PubMed.
- I. McCue, E. Benn, B. Gaskey and J. Erlebacher, Dealloying and de-alloyed materials, Annu. Rev. Mater. Res., 2016, 46(1), 263–286 CrossRef CAS.
- Z. Qi and J. Weissmuller, Hierarchical nested-network nanostructure by dealloying, ACS Nano, 2013, 7, 5948–5954 CrossRef CAS PubMed.
- D. Duan, C. Hao, G. He, Y. Wen and Z. Sun, Rh/CeO2 composites prepared by combining dealloying with calcination as an efficient catalyst for CO oxidation and CH4 combustion, J. Rare Earths, 2022, 40, 636–644 CrossRef CAS.
- X. Zhang, D. Duan, G. Li, W. Feng, S. Yang and Z. Sun, Monolithic Au/CeO2 nanorod framework catalyst prepared by dealloying for low-temperature CO oxidation, Nanotechnology, 2018, 29, 095606 CrossRef PubMed.
- X. Zhang, K. Li, W. Shi, C. Wei, X. Song, S. Yang and Z. Sun, Baize-like CeO2 and NiO/CeO2 nanorod catalysts prepared by dealloying for CO oxidation, Nanotechnology, 2017, 28, 045602 CrossRef PubMed.
- T. Kou, C. Si, J. Pinto, C. Ma and Z. Zhang, Dealloying assisted high-yield growth of surfactant-free <110> highly active Cu-doped CeO2 nanowires for low-temperature CO oxidation, Nanoscale, 2017, 9, 8007–8014 RSC.
- Y. Xiao, H. Li and K. Xie, Activating Lattice Oxygen at the Twisted Surface in a Mesoporous CeO2 Single Crystal for Efficient and Durable Catalytic CO Oxidation, Angew. Chem., Int. Ed. Engl., 2021, 60(10), 5240–5244 CrossRef CAS PubMed.
- C. Wang, D. Ren, J. Du, Q. Qin, A. Zhang, L. Chen, H. Cui, J. Chen and Y. Zhao, In Situ Investigations on the Facile Synthesis and Catalytic Performance of CeO2-Pt/Al2O3 Catalyst, Catalysts, 2020, 10(2), 143 CrossRef CAS.
- X. Zeng, M. Fang, T. Lv, J. Tian, Z. Xia, J. Cen and Q. Wang, Hydrogen-rich gas production by catalytic steam gasification of rice husk using CeO2-modified Ni-CaO sorption bifunctional catalysts, Chem. Eng. J., 2022, 441, 136023 CrossRef CAS.
- Y. Lv, Z. Han, R. Jia, L. Shi and S. Yuan, Porous interface for fast charging silicon anode, Battery Energy, 2022, 1(3) CrossRef.
- H. Wang, M. Liang, X. Zhang, D. Duan, W. Shi, Y. Song and Z. Sun, Novel CeO2 nanorod framework prepared by dealloying for supercapacitors applications, Ionics, 2018, 24, 2063–2072 CrossRef CAS.
- H. Wang, B. Liao, T. Lu, Y. Ai and G. Liu, Enhanced visible-light photocatalytic degradation of tetracycline by a novel hollow BiOCl@CeO2 heterostructured microspheres: Structural characterization and reaction mechanism, J. Hazard. Mater., 2020, 385, 121552 CrossRef CAS PubMed.
- L. Yu, T. Zhou, S. Cao, X. Tai, L. Liu and Y. Wang, Suppressing the surface passivation of Pt-Mo nanowires via constructing Mo-Se coordination for boosting HER performance, Nano Res., 2020, 14, 2659–2665 CrossRef.
- J. Li, H. Huang, Y. Li, Y. Tang, D. Mei and C. Zhong, Stable and size-controllable ultrafine Pt nanoparticles derived from a MOF-based single metal ion trap for efficient electrocatalytic hydrogen evolution, J. Mater. Chem. A, 2019, 7, 20239–20246 RSC.
- X. Li, J. Feng, M. Perdjon, R. Oh, W. Zhao, X. Huang and S. Liu, Investigations of supported Au-Pd nanoparticles on synthesized CeO2 with different morphologies and application in solvent-free benzyl alcohol oxidation, Appl. Surf. Sci., 2020, 505, 144473 CrossRef CAS.
- K. Chen, X. Zhao, X.-J. Zhang, W.-S. Zhang, Z.-F. Wu, H.-Y. Wang, D.-X. Han and L. Niu, Enhanced photocatalytic CO2 reduction by constructing an In2O3-CuO heterojunction with CuO as a cocatalyst, Catal. Sci. Technol., 2021, 11, 2713–2717 RSC.
- S. T. Hossain, Y. Almesned, K. Zhang, E. T. Zell, D. T. Bernard, S. Balaz and R. Wang, Support structure effect on CO oxidation: A comparative study on SiO2 nanospheres and CeO2 nanorods supported CuOx catalysts, Appl. Surf. Sci., 2018, 428, 598–608 CrossRef CAS.
- B. Han, H. Li, L. Li, Y. Wang, Y. Zhang and G. Li, Kinetic control of CeO2 nanoparticles for catalytic CO oxidation, J. Mater. Res., 2019, 34, 2201–2208 CrossRef CAS.
- J. Wang, J. Zhong, M. Gong, Z. Liu, M. Zhao and Y. Chen, Remove cooking fume using catalytic combustion over Pt/La-Al2O3, J. Environ. Sci., 2007, 19, 644–646 CrossRef PubMed.
- Y. Deng, P. Tian, S. Liu, H. He, Y. Wang, L. Ouyang and S. Yuan, Enhanced catalytic performance of atomically dispersed Pd on Pr-doped CeO2 nanorod in CO oxidation, J. Hazard. Mater., 2022, 426, 127793 CrossRef CAS PubMed.
- C. Zong, C. Wang, L. Hu, R. Zhang, P. Jiang, J. Chen, L. Wei and Q. Chen, The Enhancement of the Catalytic Oxidation of CO on Ir/CeO(2) Nanojunctions, Inorg. Chem., 2019, 58, 14238–14243 CrossRef CAS PubMed.
- H. Li, M. Shen, J. Wang, H. Wang and J. Wang, Effect of Support on CO Oxidation Performance over the Pd/CeO2 and Pd/CeO2-ZrO2 Catalyst, Ind. Eng. Chem. Res., 2020, 59, 1477–1486 CrossRef CAS.
- J. Zhen, X. Wang, D. Liu, Z. Wang, J. Li, F. Wang, Y. Wang and H. Zhang, Mass production of Co3O4@CeO2 core@shell nanowires for catalytic CO oxidation, Nano Res., 2015, 8, 1944–1955 CrossRef CAS.
- Y. Wang, C. Pei, Z. Zhao and J. Gong, Kinetically rate-determining step modulation by metal-support interactions for CO oxidation on Pt/CeO2, Sci. China: Chem., 2022, 65, 2038–2044 CrossRef CAS.
Footnotes |
| † Electronic supplementary information (ESI) available. See DOI: https://doi.org/10.1039/d2ra07395a |
| ‡ These authors contributed equally to this work. |
| This journal is © The Royal Society of Chemistry 2023 |

