DOI:
10.1039/D2RA07230K
(Paper)
RSC Adv., 2023,
13, 5970-5982
The effective removal of Ni2+, Cd2+, and Pb2+ from aqueous solution by adenine-based nano-adsorbent
Received
14th November 2022
, Accepted 2nd February 2023
First published on 17th February 2023
Abstract
The presence of heavy metal ions in drinking and wastewater generates environmental and human health concerns as they are known as cumulative poisons. Therefore, the purification of contaminated waters is an important ecological issue. Various techniques have been developed to address this issue, where adsorption has received widespread attention. The facile synthesis of effective adenine-based nano-adsorbents is reported and adsorptive removal of Ni2+, Cd2+, and Pb2+ from aqueous media was investigated by inductively-coupled plasma analyses, adsorption isotherms, kinetics, and thermodynamic studies. The effects of pH, adsorbent dose, contact time, and temperature were optimized. The maximum adsorption capacity was achieved at pH = 7, an adsorbent dose of 25 mg, and an initial concentration of 50 mg L−1 at 25 °C. A thermodynamic study showed that adsorption is an endothermic process, and the Langmuir model fitted well to the ion adsorption data to reveal that the maximum adsorption capacities for Ni2+, Cd2+, and Pb2+ were 273.7, 252.4, and 249.8 mg g−1, respectively.
1. Introduction
Access to safe and hygienic water is crucial globally,1 particularly in developing countries.2 Multitudinous industrial activities, including mining, plating, use of agricultural chemicals, paper and battery production, and urban sprawl,3–5 spread different kinds of environmental contaminants, such as organic dyes and inorganic heavy metal ions into clean water sources, especially rivers.6 Among all pollutants, heavy metal ions from industrial effluents are a concern due to crucial and hazardous environmental drawbacks.7,8 These metals are nonbiodegradable pollutants that persist in nature and cannot be digested or disposed off by the human body. Although these metal ions are stored in living tissues and supply essential minerals to the body, they can affect living organisms' health severely as well and impose crucial risks to human health.9,10 Based on different classifications of heavy metals, arsenic (As), cadmium (Cd), mercury (Hg), lead (Pb), nickel (Ni), and chromium (Cr) are highly toxic.11,12 Their penetration into the soil, as well as surface and groundwaters, could lead to health and environmental challenges.13 The World Health Organization (WHO) recommends that the permissible limits of Pb, Cd, and Ni in potable water are 0.01, 0.005, and 0.005 mg L−1, respectively.14,15 For instance, accumulation of Pb2+ in the body leads to difficulties, such as a reduction in male sperm generation and neurological effects, especially in children. It also has a crucial impact on gastrointestinal and hematopoietic systems and causes renal abnormalities.16–18 Up till now, several purification methods have provided helpful remedies, such as precipitation,19 membrane filtration,20 activated sludge,21 ion exchange,22 and adsorption.23 Among these techniques, adsorption has been widely applied as it is simple, low-toxicity, cost-effective, biocompatible, and recyclable.24–26 Various organic and inorganic adsorbents with porous surfaces have been synthesized.
In recent decades, magnetic nano-particles formed by modification with organic ligands have specifically been regarded as efficient adsorbents.27–30 Therefore, an adenine-based nano-adsorbent was prepared here (Scheme 1). Its adsorption capability and capacity for the removal of Ni(II), Cd(II), and Pb(II) ions from contaminated water was evaluated by the Langmuir and Freundlich isotherms. Also, several operational parameters, such as pH, temperature, contact time, and adsorbent dosage, were optimized as well.
 |
| | Scheme 1 Removal of Ni2+, Cd2+, and Pb2+ from water by the adenine-based nano-adsorbent manufactured in this study. | |
2. Experimental
2.1. Materials and methods
All chemicals and reagents were purchased from the Merck Chemical Company and used without further purification.
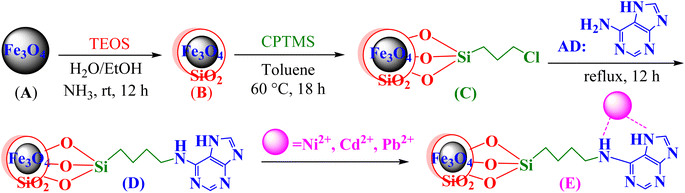
2.2. Preparation of the adenine-based nano-adsorbent
Co-precipitation is a convenient and cost-effective technique that was chosen for the preparation of the magnetite adenine-based nano-adsorbent.31 Briefly:
• FeCl3·6H2O (11.44 g) and FeCl2·4H2O (4.3 g) were dissolved in distilled water (100 mL) and heated at 80 °C for 40 minutes. Aqueous ammonia (about 17 mL; 37%) was added dropwise, and the mixture was heated for 30 minutes at 80 °C. Fe3O4 MNPs (A) were separated by a super magnet, washed with water, and air-dried.
• A (0.1 g) was added to a mixture of ethanol/distilled water (80 mL, 4![[thin space (1/6-em)]](https://www.rsc.org/images/entities/char_2009.gif) :1 by volume) and aqueous ammonia (2 mL); the mixture was dispersed by ultrasonication for 10 minutes. Tetraethyl orthosilicate (2 mL) was then slowly added, and the mixture was stirred for 6 h. Fe3O4@SiO2 (B) was separated by an external super magnet, washed with water, and air-dried.
:1 by volume) and aqueous ammonia (2 mL); the mixture was dispersed by ultrasonication for 10 minutes. Tetraethyl orthosilicate (2 mL) was then slowly added, and the mixture was stirred for 6 h. Fe3O4@SiO2 (B) was separated by an external super magnet, washed with water, and air-dried.
• B (0.1 g) was added to the mixture of (3-chloropropyl)trimethoxysilane (CPTMS, MW = 198, D = 1.09 g mL−1, 1 mL, 5.5 mmol) and dry toluene (80 mL), and the mixture was stirred for 18 h at 60 °C. Fe3O4@SiO2@CPTMS (C) were separated by a super-magnet, washed with water, and air-dried.
• C (0.1 g) was added to the mixture of adenine (0.81 g, MW = 135, about 6 mmol), K2CO3 (0.83 g, MW = 138, about 6 mmol), and toluene (50 mL). The mixture was refluxed for 12 h. The adenine-based nano-adsorbent (D = Fe3O4@SiO2@CPTMS@AD) was separated with a super-magnet, washed with toluene and water, and vacuum dried.
3. Results and discussions
3.1. Characteristics of D
The structure of the nano-adsorbent was verified by the following techniques.
3.1.1 Characterization of D by FT-IR spectroscopy. The preparation of D was verified by FT-IR spectra in four steps (Fig. 1). First, a peak of ∼576 cm−1 is related to the stretching vibrations of the Fe–O bond, showing the formation of A. Afterward, the presence of a broad peak at ∼1086 cm−1 shows the stretching vibration of Si–OH and confirms the silica coating of MNPs (B). Indication of a new peak at ∼634 cm−1 shows the existence of the C–Cl bond and formation of C. Finally, additional peaks at 1623 and 3443 cm−1 correspond to the C![[double bond, length as m-dash]](https://www.rsc.org/images/entities/char_e001.gif) N and the N–H bonds, confirming the formation of D.
N and the N–H bonds, confirming the formation of D.
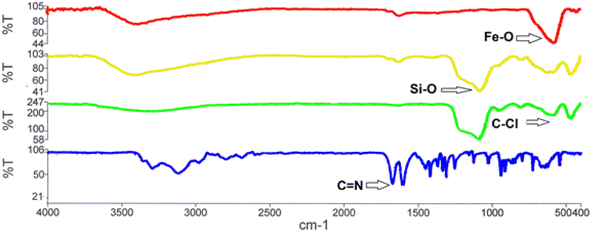 |
| | Fig. 1 The FT-IR spectra of A (red), B (yellow), C (green), and D (blue). | |
3.1.2 Characterization by EDX. Assessment of the chemical composition of D was approved by EDX analysis, which showed the presence of the anticipated elements in the structure of the nano-adsorbent, namely C, N, O, Si, and Fe.It should also be noted that to determine the elemental composition of a compound based on an existing standard, the sample is usually coated with a very thin layer of gold; hence the Au peak also appeared in the EDX graph (Fig. 2).
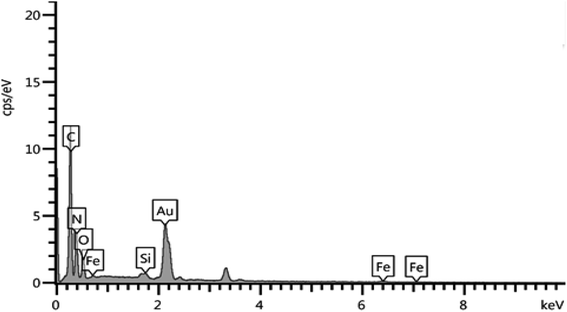 |
| | Fig. 2 The EDX analysis of D. | |
3.1.3 Characterization of D by SEM elemental mapping. Fig. 3 shows the SEM-mapping images of D indicating the uniformly dispersed characters and homogenous distribution of C (red), Fe (brown), N (green), O (blue), and Si (light green).
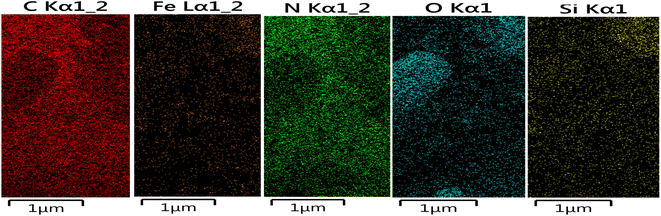 |
| | Fig. 3 The elemental mappings of D. | |
3.1.4 Characterization by XRD analyses. The XRD patterns of B, C, and D are depicted in Fig. 4. The diffraction peaks at 2θ = 10, 30, 35, 45, 53, 57, and 63 represent the cubic spinel crystal structure of B (silica-coated A, blue). A comparison of these three XRD patterns shows that the corresponding peaks in B exist in the XRD patterns of C (red) and to some extent in D (green) as well, indicating that the structure of B was maintained even after functionalization.
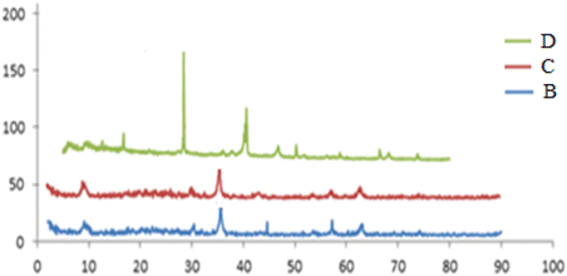 |
| | Fig. 4 The XRD patterns of B, C, and D. | |
3.1.5 Characterization by SEM. The SEM analysis was used to confirm the morphology of the surface structure of D. The SEM images clearly show that the nano-adsorbent has a spherical shape; the homogenous particle distribution indicates that the average sizes of the nano-adsorbent range between 24–54 nm (Fig. 5).
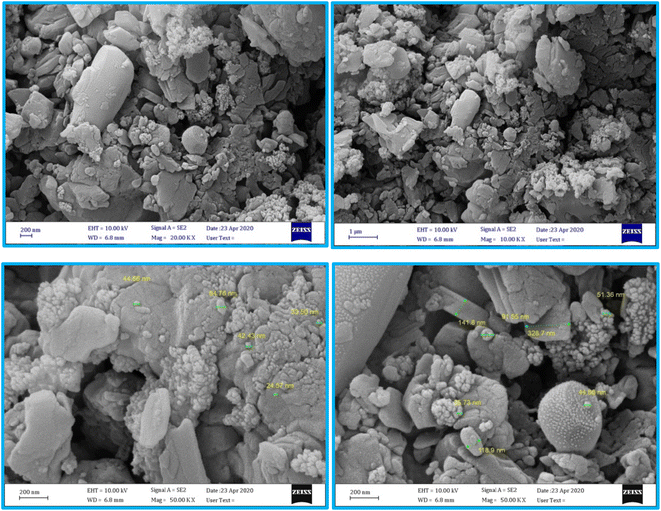 |
| | Fig. 5 The SEM images of D. | |
3.1.6 Characterization by TEM. The TEM images also confirmed that the sizes of the nano-adsorbent particles were in the nanometer range (Fig. 6). Moreover, the TEM images showed the core–shell structure of the nano-adsorbent as well.
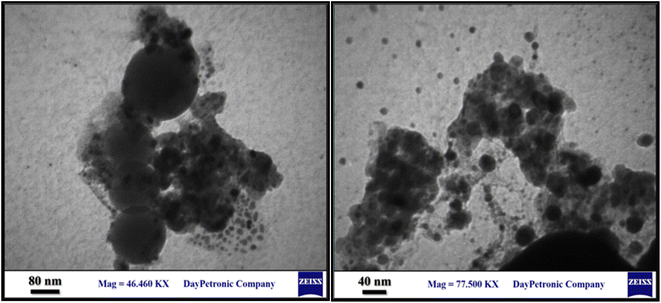 |
| | Fig. 6 The TEM images of D. | |
3.1.7 Characterization by VSM. A comparison of the magnetic properties of four compounds, namely A, B, C, and D was performed by the VSM technique (Fig. 7). As can be observed, the magnetic properties of all four compounds showed a decrease from A to D (65, 35, 30, and 8.65 emu g−1, respectively). The reduction in the magnetic property is probably due to the decrease in dipolar–dipolar interactions between the coated layers.
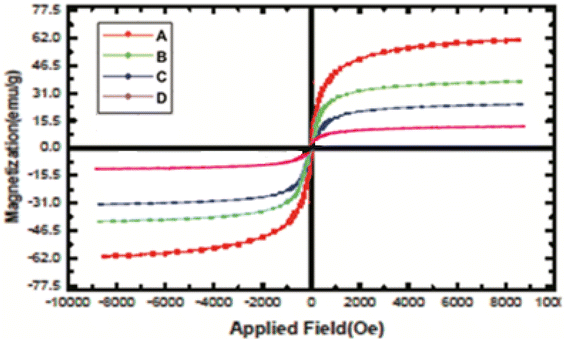 |
| | Fig. 7 The VSM analysis of A, B, C, and D. | |
3.1.8 Characterizations by BET. The BET method was used to determine the specific surface area of D, which was calculated based on the amount of the adsorbed N2 gas and the size distribution of the cavities determined by the adsorption isotherm (Fig. 8).
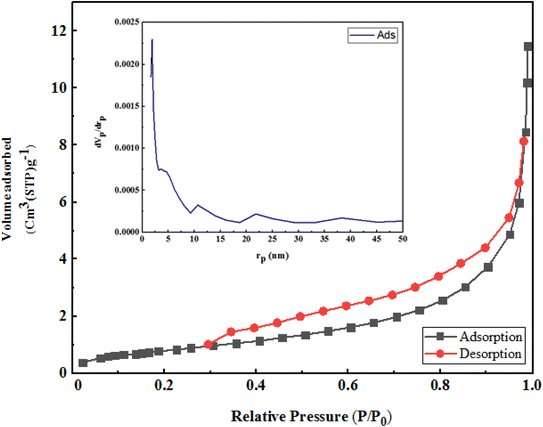 |
| | Fig. 8 The N2 gas adsorption–desorption isotherm and BJH pore size distribution. | |
Nitrogen adsorption in micropores occurred at low partial pressures and was continued by adsorption in mesopores at higher pressures (the relative pressure ranged between 0.1 to 1).
According to the IUPAC classification, the adsorption and desorption isotherms were type 4. Fig. 8 exhibits a type III curve indicating the absence of hysteresis.
The specific surface area and volume of D according to Langmuir and BET are given below (Table 1).
Table 1 Results of the Langmuir and BET measurements of D
| Parameter |
Langmuir |
BET |
| as (m2 g−1) |
4.18 |
2.88 |
| Vm (cm3 (STP) per g) |
0.96 |
0.017 |
To obtain the pore size distribution of D, the BJH method was used. As can be seen, the maximum frequency of cavities with a radius of 1.32 nm was obtained; the average size of cavities was 23.79 nm, which lay in the range of meso cavities (Table 2).
Table 2 Results of volume and radii of cavities using different experimental isothermsa
| Methods |
Pore volume (cm3 g−1) |
Pore size (nm) |
ap (m2 g−1) |
| BJH: Barrett–Joyner–Halenda method, DH: Dollimore–Heal method, αs: alpha-S method. |
| BJH method adsorption |
0.017 |
1.66 |
3.67 |
| BJH desorption |
0.016 |
1.88 |
3.98 |
| DH |
0.017 |
1.66 |
3.79 |
| αs |
0.016 |
— |
2.58 |
| Total pore volume |
0.017 cm3 g−1 |
| Mean pore diameter |
23.79 nm |
3.2. Batch experiments
For adsorption experiments, solutions of Ni2+, Cd2+, and Pb2+ with concentrations of 50 to 200 ppm were prepared. Twenty-five milligrams of D were added to each of them at neutral pH and stirred for 2 h at room temperature; the adsorbent was then filtered. Finally, the ICP analysis was taken from the sub-filtrate to measure the amount of the metal ions. To obtain optimal conditions, various factors, such as pH, contact time, amount of adsorbent, and temperature were optimized, which are described in the following results. A concentration of 50 mg L−1 was selected for the experiments in this study.
3.3. Effect of pH
The pH of a solution is one of the most important factors influencing the adsorption process and the mechanism behind electrostatic forces. The drift method was used to determine the charge in the surface of D. At the pH below the pHzpc (zero point of the adsorbent charge), the charge on the adsorbent surface was positive, and at the pH above the pHzpc, it was negative. Fig. 9 shows the maximum removal of Ni, Cd, and Pb from the solution with pH = 7. At lower pH, H+ ions overcome the adsorption sites, and the access of cations to these sites is limited due to repulsive forces and adsorption percentage decreases. As the pH increases, the adsorption also increases, and at neutral or weakly acidic pH levels, most metals are available as soluble and free cations for adsorption.
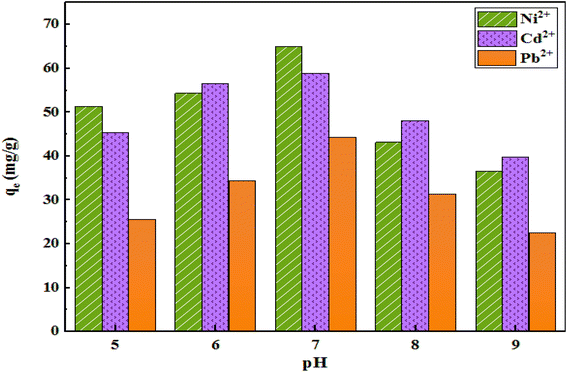 |
| | Fig. 9 The effect of pH on the adsorption capacity (initial concentration of ions = 50 mg L−1, weight of adsorbent = 25 mg, solution volume = 35 mL, r.t., contact time = 120 min). | |
According to the obtained data, pH 7 was selected as the optimal pH for the next experiments due to the maximum adsorption capacity of all three pollutants.
3.4. Effect of adsorbent dosage
To optimize the amount of the adsorbent, different amounts of the adsorbent (25, 50, 100, 125, and 150 mg) in 35 mL of solution (initial concentration of 50 mg L−1), at pH 7 in 120 min were examined. As shown in Fig. 10, with increasing adsorbent dose, the adsorption of metal ions per unit mass of the adsorbent decreased. There may be two reasons for the reduction in adsorption capacity:
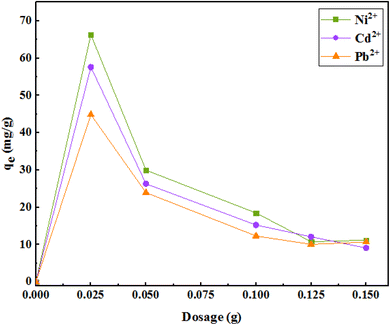 |
| | Fig. 10 The effect of the amount of adsorbent on the removal of metal ions (initial concentration of ions = 50 mg L−1, pH = 7, solution volume = 35 mL, r.t., contact time = 120 min). | |
(1) Increasing the amount of adsorbent in the constant volume and concentration causes saturation of adsorption sites during the adsorption process, and
(2) Decreased adsorption capacity may be due to the particle interactions through particle accumulation due to the high adsorbent concentrations. Therefore, 25 mg of adsorbent in 50 mL of the aqueous solution was selected as an optimal amount of the adsorbent in subsequent experiments.
3.5. Effect of temperature
The results of the study of adsorption with temperature changes indicated an increase in adsorption with increasing temperature. The data indicate that the process is endothermic, which can also be due to the high mobility of metal ions due to increasing temperature that leads to improved interactions between adsorbent and ions or the creation of new active sites on the adsorbent. Based on the insignificant increase in adsorption capacity at any temperature and low energy consumption, a temperature of 25 °C was selected for further experiments (Fig. 11).
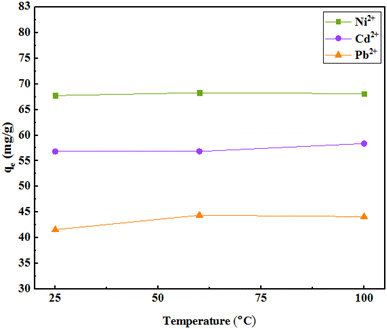 |
| | Fig. 11 The effect of temperature on the adsorption (initial concentration of ions = 50 mg L−1, weight of adsorbent = 25 mg, pH = 7, solution volume = 35 mL, r.t., contact time = 120 min). | |
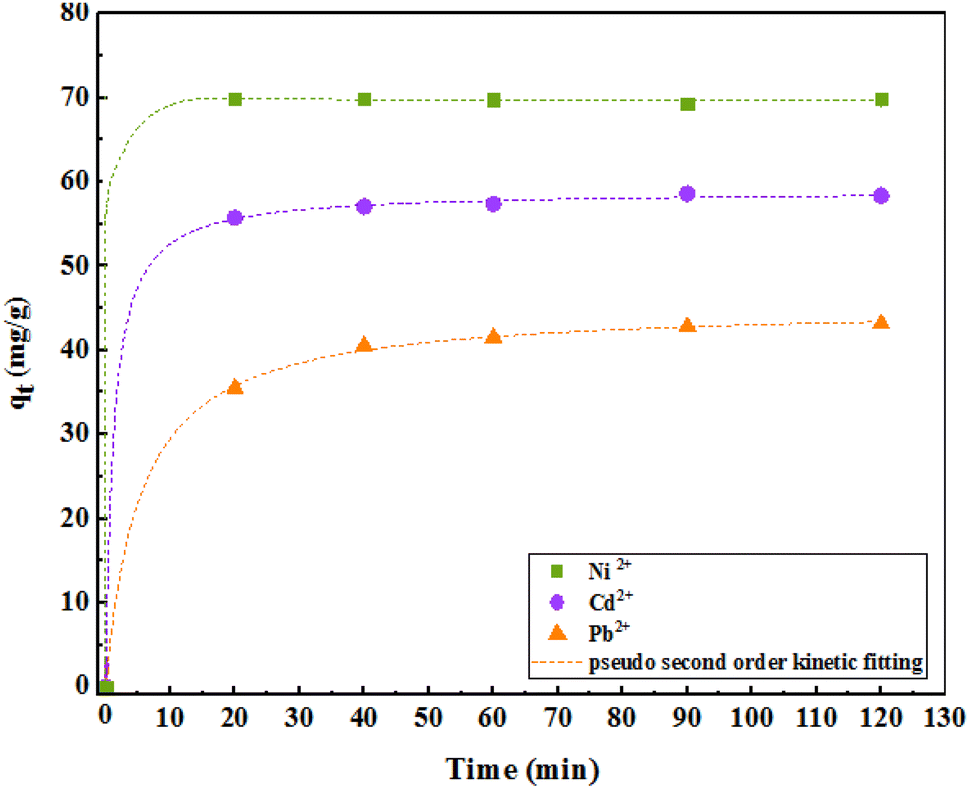
3.6. Effect of contact time and kinetics
Adsorption kinetics were investigated to better evaluate the adsorption dynamics of the metal ions on the adsorbent to provide a predictive model that helps us estimate the amount of adsorbed ions over time. Therefore, first- and second-order quasi-linear kinetics were calculated and investigated for different concentrations of pollutants. The constant values of the adsorption rate are shown in Table 3. Based on these values and the correlation coefficient (R2 = 0.99), it can be concluded that a nonlinear fit can acceptably describe the experimental data obtained. However, at all different concentrations of ions, the amount of the practical adsorption capacity (qe) was close to the calculated values. For all ion adsorption values, the second-order quasi-linear kinetic model covered the results well. In the quasi-second-order kinetic equation, k2 is a quasi-second-order velocity constant in grams per milligram per minute, whose values were 0.64, 0.14, and 0.41 for Ni, Cd, and Pb ions, respectively. The value of C in the particle penetration model indicates the thickness of the boundary layer; larger values indicate the magnitude of the boundary layer thickness. Furthermore, a larger value of C shows the presence of both the adsorption species and the intracellular diffusion mechanism.
Table 3 Constants and coefficients related to adsorption kinetic models
| Model |
Parameter |
Ni2+ |
Cd2+ |
Pb2+ |
| First-order quasi-linear |
qe (mg g−1) |
69.78 |
57.43 |
42.43 |
| K1 (min−1) |
9.92 |
1.22 |
0.08 |
| R2 |
0.98 |
0.98 |
0.98 |
| Second-order quasi-linear |
qe (mg g−1) |
69.76 |
58.94 |
45.3 |
| K2/10−2 (g mg−1 min−1) |
0.64 |
0.14 |
0.41 |
| R2 |
0.99 |
0.99 |
0.99 |
| Intraparticle penetration |
C (mg g−1) |
19.8 |
15.31 |
9.07 |
| kipd (mg min−0.5 g−1) |
0.64 |
5.00 |
3.82 |
| R2 |
0.65 |
0.68 |
0.79 |
As shown in Fig. 12, the adsorption kinetics consists of two phases. The initial phase of adsorption is performed rapidly; in the second phase, the adsorption is slower and finally reaches equilibrium after about 30 min. However, to be sure, the study was continued for 2 h.
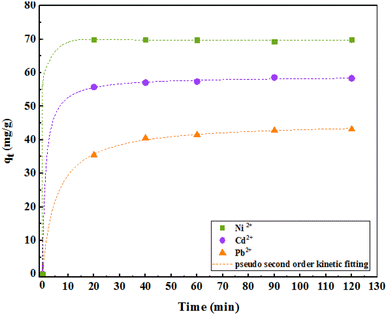 |
| | Fig. 12 Process of the second-order quasi-linear kinetic model for Ni2+, Cd2+, and Pb2+. | |
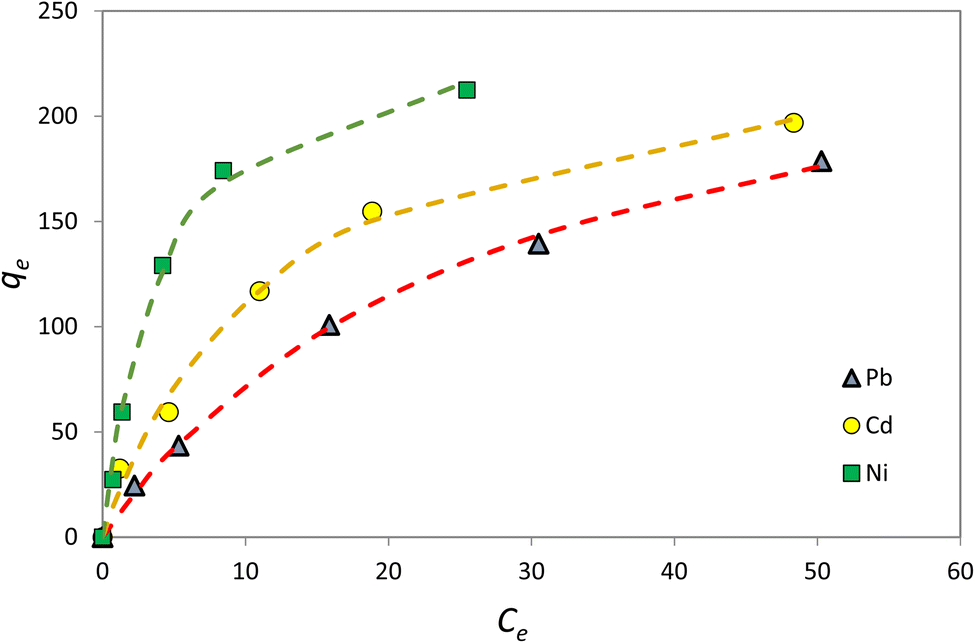
3.7. Adsorption isotherms
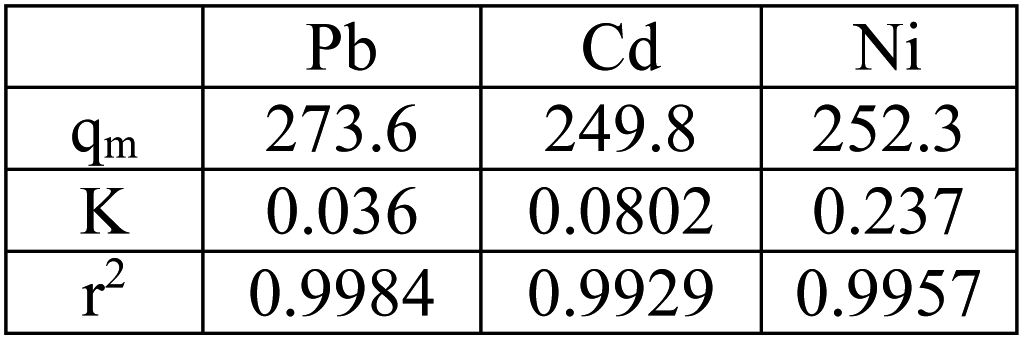
Adsorption isotherm is one of the most important factors consulted in designing adsorption systems. The adsorption isotherm describes how the adsorbent interacts with pollutants. In this study, the Langmuir, Freundlich, and Temkin isotherm models, as well as the Redlich–Patterson three-parameter model, were used to study adsorption. Adsorption isotherm constants were determined to express the surface properties and their affinity for the adsorption process. The maximum adsorption capacity (qmax) and Langmuir constant (KL) were obtained by nonlinear fitting (Table 4). Based on the R2 coefficient (0.99), the mathematical fitting was perfect, which might be due to the homogeneous distribution of the adsorption sites on the adsorbent surface, considering that the Langmuir isotherm assumes that the adsorbent surface is homogeneous. In the Langmuir model, the qmax for Ni, Cd, and Pb ions was 273.7, 252.4, and 249.8 mg g−1, respectively. Although the Langmuir single-layer adsorption model is suitable for describing the experimental data from the adsorption test, the adsorption process was also evaluated by other models. The Freundlich isotherm explained that the concentration of metal ions on the adsorbent increased with an increase in the ion concentration of the solution. In this isotherm, the adsorption rate was assumed to be equal to the total adsorption on all active adsorbent sites.
Table 4 Constants and coefficients of adsorption isotherm models for the Ni2+, Cd2+, and Pb2+
| Model |
Parameter |
Ni2+ |
Cd2+ |
Pb2+ |
| Langmuir isotherm |
qmax (mg g−1) |
273.7 |
252.4 |
249.8 |
| KL (L mg−1) |
0.036 |
0.080 |
0.23 |
| R2 |
0.99 |
0.99 |
0.99 |
| Freundlich isotherm |
KF (mg1−n Ln g−1) |
18.39 |
37.73 |
62.95 |
| n |
1.7 |
2.28 |
2.15 |
| R2 |
0.97 |
0.97 |
0.93 |
| Temkin isotherm |
BT (kJ mol−1) |
49.78 |
46.79 |
53.92 |
| AT (L mg−1) |
0.57 |
1.23 |
2.40 |
| R2 |
0.96 |
0.95 |
0.97 |
| Redlich–Patterson isotherm |
KRP (L mg−1) |
12.11 |
18.15 |
48.49 |
| RPα (L mg−1) |
0.10 |
0.05 |
0.11 |
| RPβ |
0.80 |
1.07 |
1.16 |
| R2 |
0.99 |
0.99 |
0.99 |
According to Table 4, the R2 coefficients were 0.97, 0.97, and 0.93 for Ni, Cd, and Pb ions, respectively, which is lower than R2 observed with the Langmuir isotherm. KF was set at 18.39, 37.73, and 62.95, respectively. The Freundlich isotherm power (n) was optimal for values between 0 and 10. In the Temkin model, BT is the Temkin constant and is expressed in joules per mole and is related to the heat of adsorption. In this model, it is assumed that the adsorption process is determined by a uniform distribution of the coherence energy. Low BT indicates weak bonds between the pollutant and adsorbent molecules. The Redlich–Patterson model is a combination of the two previous models, namely the Langmuir and the Freundlich models. The advantage of this equation is that the value of β is between 0 and 1; when its value is 1, the above equation becomes the Langmuir isotherm, and when its value is 0, it becomes the Henri equation. As can be seen, the value of R2 for all experimental results in the Langmuir and the Redlich–Patterson equations is 0.99; the Langmuir isotherm is a more appropriate model to describe the experimental data in all cases, even when β ≠ 1 in the Redlich–Patterson model. Therefore, it can be concluded that the active sites on the adsorbent surface are uniformly distributed with the same adsorption energy, as these are a part of the hypotheses of the Langmuir equation (Fig. 13).
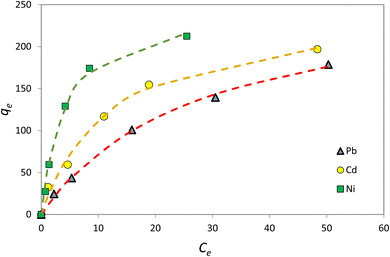 |
| | Fig. 13 The Langmuir isotherm model for Ni2+, Cd2+, and Pb2+ adsorption (initial concentration of ions = 50–200 mg L−1, the weight of adsorbent = 25 mg, solution volume = 35 mL, contact time = 120 min, pH = 7, r.t.). | |
According to the Langmuir model, at low concentrations, Ni absorption is greater, while at high concentrations, which is the saturation level, Pb absorption is greater. In addition, the following table was derived from nonlinear fitting:
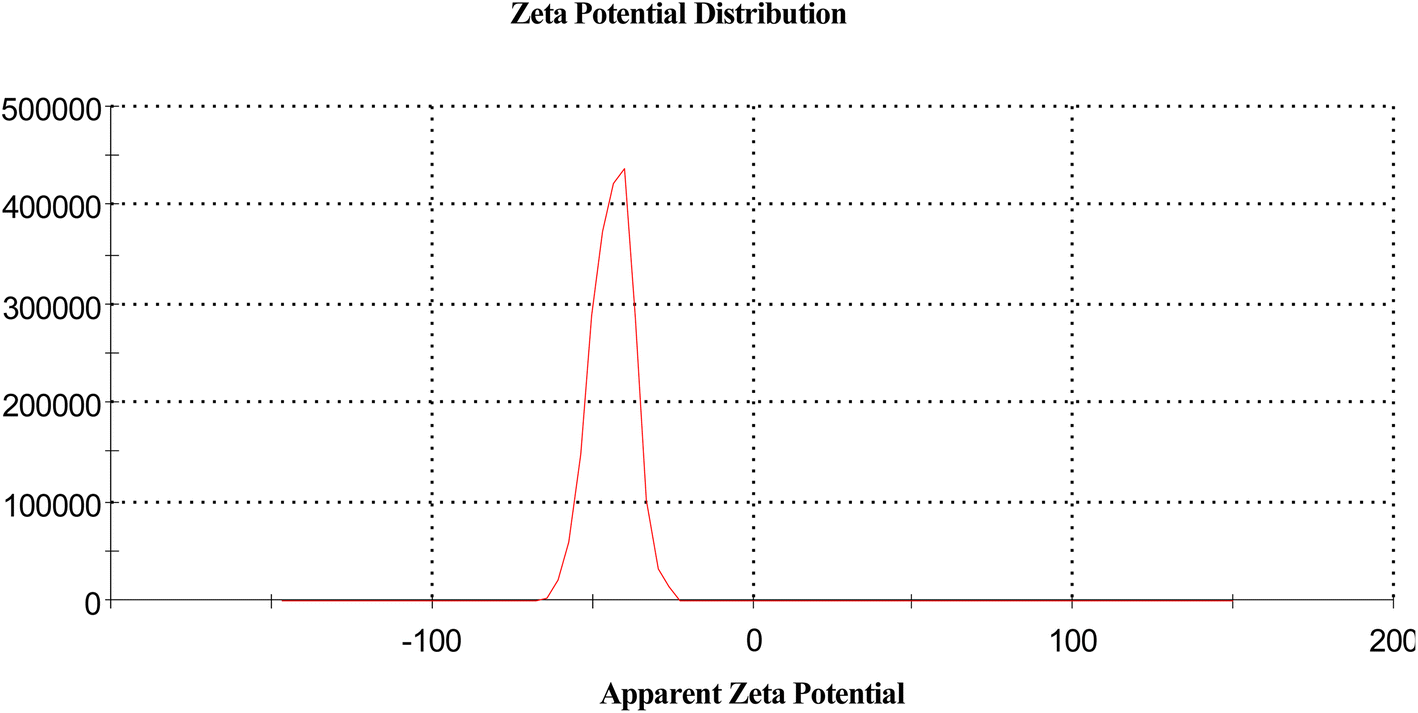
3.8. The zeta calculation32
The magnitude of the zeta potential gives an indication of the potential stability of the system. As the particles have negative zeta potentials, they tend to repel each other, and there is no tendency for them to come together (Table 5 and Fig. 14).
Table 5 The zeta calculation of D
| |
Mean (mV) |
Area (%) |
St. dev. (mV) |
| Zeta potential (mV) |
−43.8 |
Peak 1 |
−43.8 |
100.0 |
6.50 |
| Zeta deviation (mV) |
6.50 |
Peak 2 |
0.00 |
0.0 |
0.00 |
| Conductivity (mS cm−1) |
0.0686 |
Peak 3 |
0.00 |
0.0 |
0.00 |
| Result quality |
Good |
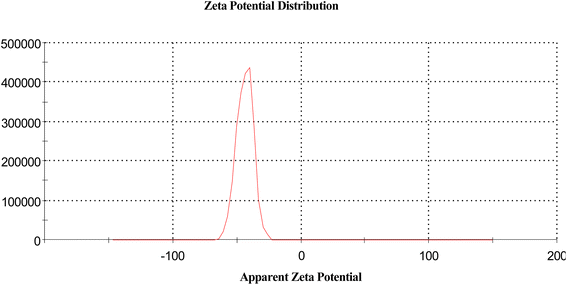 |
| | Fig. 14 The zeta calculation of D. | |
3.9. Adsorption thermodynamics
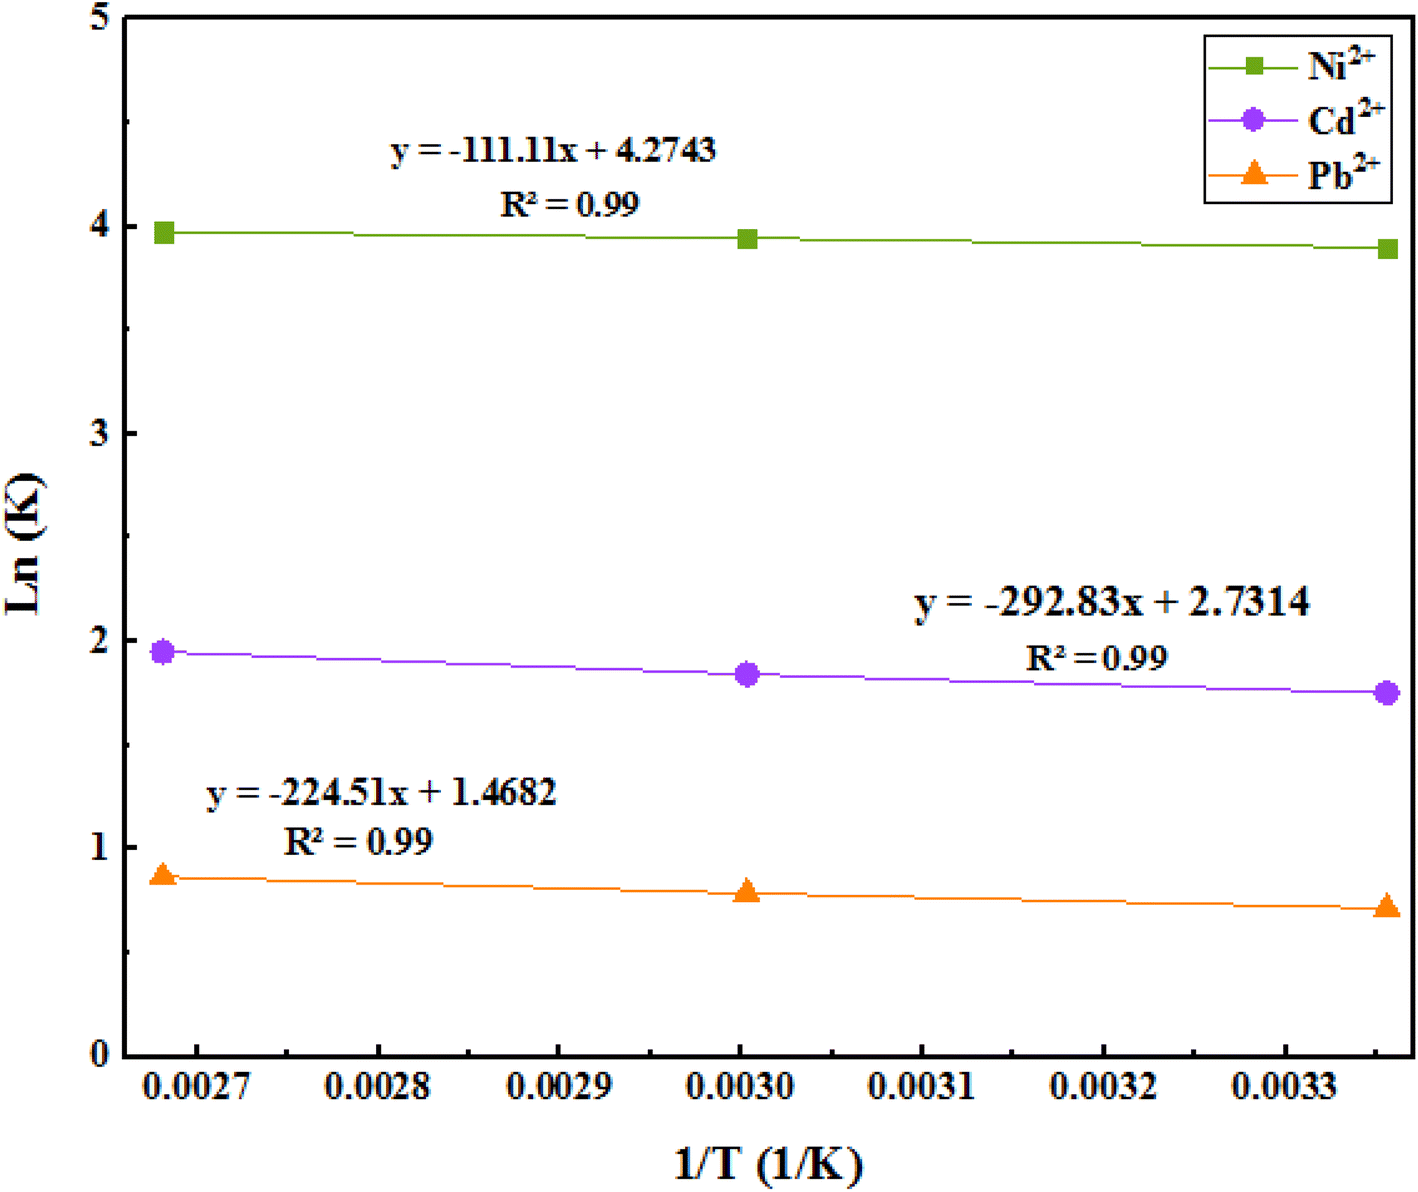
We can reveal the nature of the reaction (whether it is endothermic or exothermic) through the evaluation of changes in the amount of adsorption in terms of temperature. By studying the effects of temperature, the optimum temperature required to achieve maximum adsorption and recovery can be obtained. Enthalpy and entropy can then be calculated from the Van't Hoff curve (Fig. 15).
 |
| | Fig. 15 The Van't Hoff equation plot. | |
The related obtained results are shown in Table 6. The negative free energy changes of the Gibbs standard show that the adsorption process is spontaneous, and the positive standard enthalpy changes of the reaction show that the adsorption process is endothermic. On the other hand, the positive standard entropy changes of the system indicate an increase in irregularities in the solid/solution adsorption interface, but it is traced. Also, the range of these free energies is −20 kJ mol−1, and it can be concluded that these adsorptions are physical, and there are no strong bonds between the metal ions and the adsorbent.
Table 6 Thermodynamic parameters of the adsorption process
| Thermodynamic parameter |
| ΔG (kJ mol−1), Temperature (K) |
ΔH (kJ mol−1) |
ΔS (J mol−1 K−1) |
Pollutants |
| 298 |
333 |
373 |
| −9.66 |
−10.92 |
−12.32 |
13.36 |
0.51 |
Ni2+ |
| −4.3 |
−5.10 |
−6.04 |
35.22 |
0.32 |
Cd2+ |
| −1.77 |
−2.18 |
−2.69 |
27.00 |
0.17 |
Pb2+ |
3.10. Adsorption mechanism
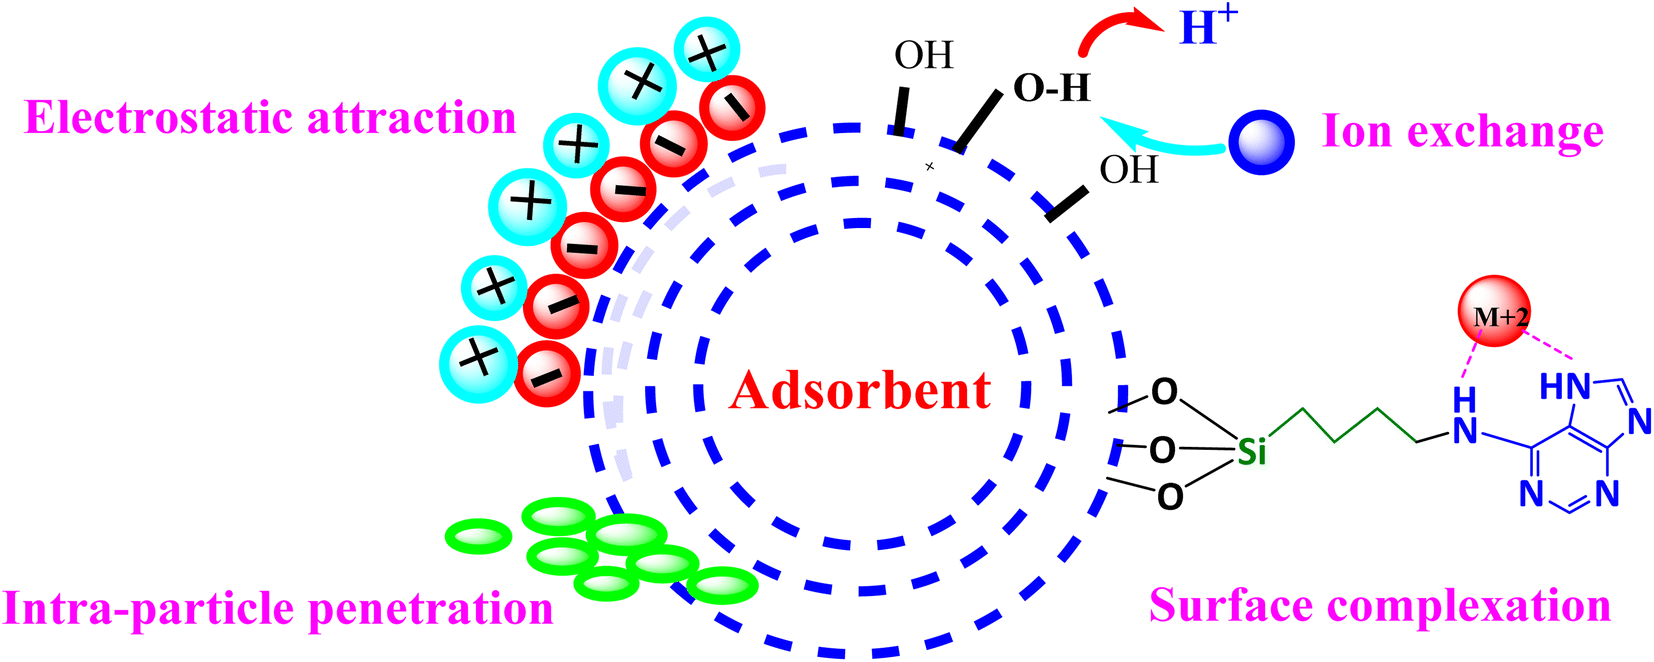
By using the model of isotherms and kinetics data, the mechanism of adsorption could be suggested via ion exchange, formation of the complex, and the electrostatic attractions formed by physical adsorption resulting from intra-particle penetration due to the size of cavities and the special surface area (BET analysis results and pore size) for small amounts of pollutants on the external surface (Fig. 16).
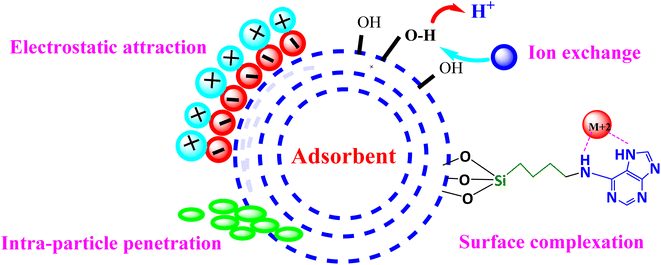 |
| | Fig. 16 A proposed mechanism for metal ion adsorption onto D. | |
3.11. Activity comparison of D
Generally, due to the core–shell structure of the adsorbent, the specific surface area is not big enough as compared to the area of other types of adsorbents, but has an acceptable adsorption capacity based on the different interactions as compared to the reference adsorbents (Table 7). It can be said that the pollutants adsorb physically in a single layer.
Table 7 The comparative adsorption capacity of select adsorbents for Pb2+
| Method |
Adsorption capacity (mg g−1) |
Ref. |
| Fe3O4–SO3H MNPs |
108.93 |
33 |
| MNPs–NH2 |
40.10 |
34 |
| Cs–Fe2O3 |
204.318 |
35 |
| T-Fe3O4 |
101.20 |
36 |
| Fe3O4@SiO2–NH2 MNPs |
100.0 |
37 |
| Fe3O4 MNPs |
34.9 |
38 |
| Fe3O4@SiO2/Schiff base |
142.86 |
39 |
| Mt@MH |
38.15 |
40 |
| MgFe2O4–NH2 NPs |
135.1 |
41 |
| Cs–FeO |
3.13 |
42 |
| TETA-chitosan |
370.63 |
43 |
| (AAA–NH2–Si@MNPs) |
392.2 |
44 |
| Fe3O4@SiO2@CPTMS@AD |
273.7 |
Present work |
3.12. Selectivity of D
Selective evaluation of D was carried on by the Water & Wastewater Co. of the Khorasan Razavi Province (Khorasan, Iran) in two types of standard solutions containing fifty cations in ppb (part per billion) concentration. The results obtained are presented below (Table 8). The adsorption percentages in the presence of different ions illustrate that D can be used as a cost-effective non-toxic material for industrial wastewater.
Table 8 Adsorption percentage of ions in two standard solutions with D
| Entry |
Ions |
Standard 1 (RTC) |
Standard 2 (MOO8) |
Entry |
Ions |
Standard 1 (RTC) |
Standard 2 (MOO8) |
| 1 |
Li |
46.08 |
— |
26 |
Pb |
50.34 |
75 |
| 2 |
B |
— |
— |
27 |
Nb |
— |
— |
| 3 |
Be |
56.56 |
— |
28 |
Te |
— |
— |
| 4 |
Na |
— |
— |
29 |
Se |
— |
— |
| 5 |
Mg |
98.2 |
— |
30 |
La |
— |
— |
| 6 |
Al |
— |
37.25 |
31 |
Ge |
— |
— |
| 7 |
K |
— |
— |
32 |
Ce |
— |
— |
| 8 |
Ca |
99 |
97.53 |
33 |
Pr |
— |
— |
| 9 |
Ti |
93.1 |
— |
34 |
Nd |
— |
— |
| 10 |
V |
63.35 |
— |
35 |
Sm |
— |
— |
| 11 |
Cr |
63.32 |
47.85 |
36 |
Tb |
— |
— |
| 12 |
Mn |
25.67 |
35.45 |
37 |
Th |
— |
— |
| 13 |
Co |
21.11 |
52.33 |
38 |
U |
— |
— |
| 14 |
Ni |
71 |
81.8 |
39 |
Bi |
— |
— |
| 15 |
Cu |
33.14 |
52.72 |
40 |
Ir |
— |
— |
| 16 |
Zn |
— |
40 |
41 |
Os |
— |
— |
| 17 |
As |
57.1 |
16.43 |
42 |
Re |
— |
— |
| 18 |
Se |
79.26 |
80 |
43 |
Hg |
— |
— |
| 19 |
Sr |
96.5 |
99 |
44 |
Ag |
— |
— |
| 20 |
Mo |
95.4 |
81 |
45 |
W |
— |
— |
| 21 |
Ag |
85.81 |
— |
46 |
Yb |
— |
— |
| 22 |
Cd |
9.8 |
— |
47 |
Pt |
— |
— |
| 23 |
Sb |
17.58 |
25.40 |
48 |
Th |
— |
— |
| 24 |
Tl |
27.1 |
|
49 |
Hf |
|
|
| 25 |
Ba |
70.29 |
— |
50 |
Sn |
|
|
3.13. Reusability of D
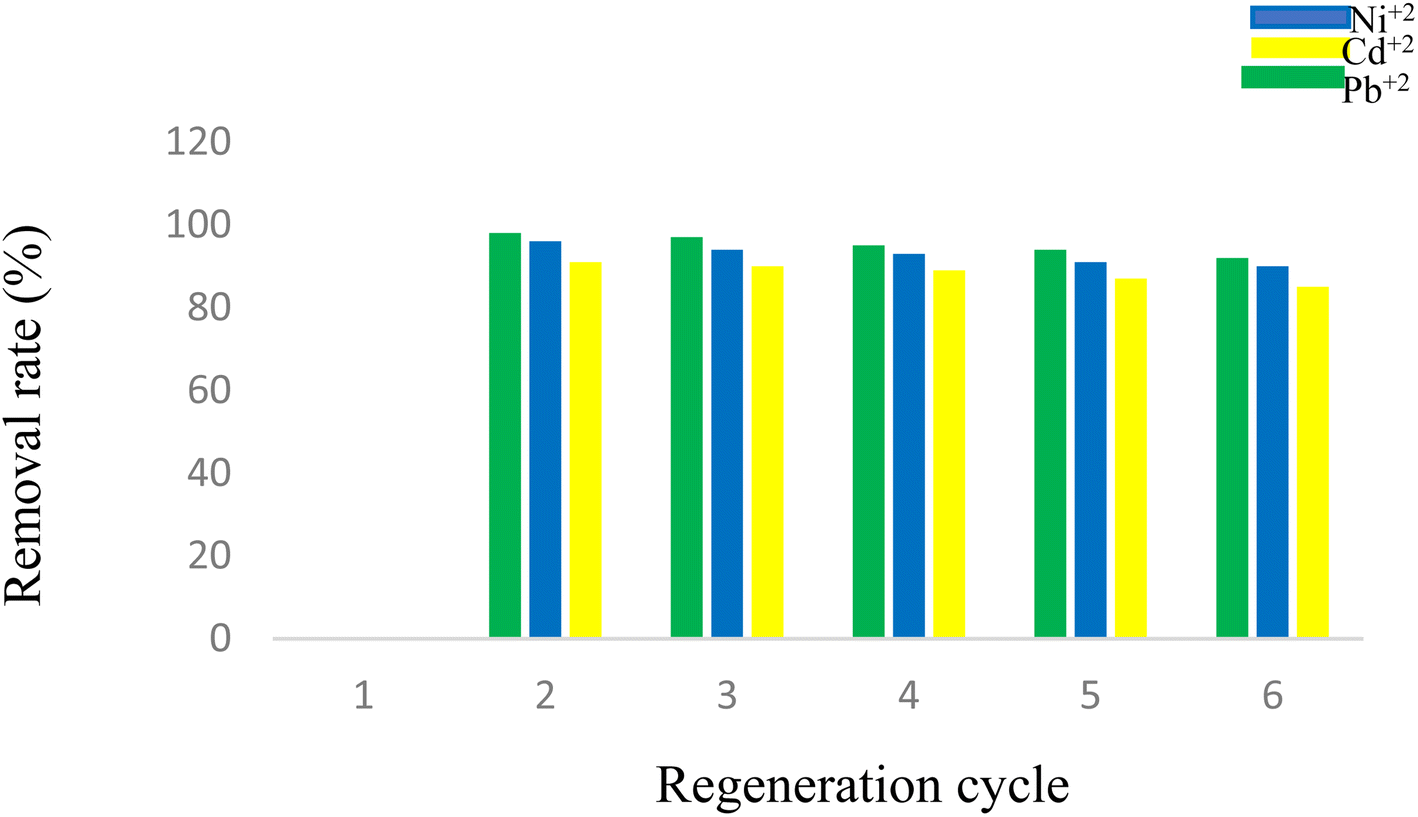
In order to evaluate the reusability of D containing Pb2+, it was washed with HNO3 solution (0.01 M), and the pH value was adjusted between 2 and 3 until no Pb2+ was detected in the wash water with ICP tests. Then, D was washed with deionized water until the pH range of the wash water reached ∼5.0–6.5. The washed D was then dried at 80 °C for 24 h and reused at least 4 times for the next removal processes, where it showed no significant loss in the adsorption performance (98%, 97%, 95%, 94%, and 92%, respectively). For the Ni2+ and Cd2+, the experiments were repeated in the same way (Fig. 17).
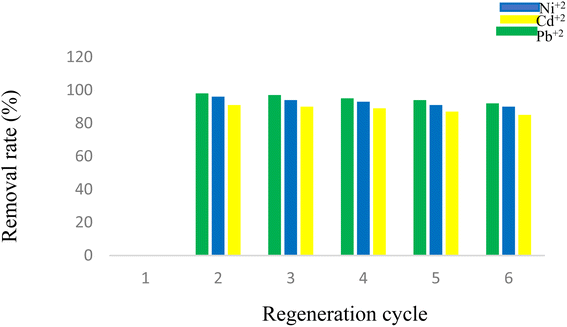 |
| | Fig. 17 Reusability of D for removal of Ni2+, Cd2+, and Pb2+. | |
4. Conclusions
This work presents the efficiency of D, an adenine-based nano-adsorbent, for the removal of Ni, Cd, and Pb ions from contaminated water as a treatment method for wastewater. To achieve the best results, the adsorption process was determined under optimized conditions for Pb2+, Ni2+, and Cd2+ solutions. The Freundlich, Langmuir, Temkin, and Redlich–Patterson isotherms were studied to evaluate the adsorption behavior. The high connection items of the Langmuir model (R2+ > 0.9) revealed that the Langmuir model has an acceptable fitting with experimental data, and thus, the adsorption of Ni, Cd, and Pb ions on D is more compatible with the Langmuir model. In this case, the maximum adsorption capacities noted for Ni, Cd, and Pb ions were 273.7, 252.4, and 249.8 mg g−1, respectively. Therefore, based on the Langmuir hypothesis, it can be concluded that active sites are uniformly distributed on the adsorbent surface with the same adsorption energy. Overall, we present a cost-effective recyclable modified magnetic nano-adsorbent prepared with organic ligands to treat contaminated water by removing inorganic pollutants.
Author contributions
Vahideh Khorram Abadi: PhD student, researcher, writing the manuscript. Davood Habibi: project administrator, supervisor, checking, correcting, and approving the final version of the manuscript. Somayyeh Heydari: advisor, writing the manuscript. Maryam Ariannezhad: methodology, writing the manuscript.
Conflicts of interest
The authors declare that they have no known competing financial interests or personal relationships that could have appeared to influence the work reported in this paper.
Acknowledgements
We would like to thank the Bu-Ali Sina University Authorities, Hamedan, Iran, for the support of this work.
References
- X. Zhao, X. Yu, X. Wang, S. Lai, Y. Sun and D. Yang, Recent advances in metal-organic frameworks for the removal of heavy metal oxoanions from water, Chem. Eng. J., 2020, 5, 127221 Search PubMed.
- G. De Angelis, L. Medeghini, A. M. Conte and S. Mignardi, Recycling of eggshell waste into low-cost adsorbent for Ni removal from wastewater, J. Cleaner Prod., 2017, 164, 1497–1506 CrossRef CAS.
- M. S. Mansour, M. E. Ossman and H. A. Farag, Removal of Cd(II) ion from waste water by adsorption onto polyaniline coated on sawdust, Desalination, 2011, 272, 301–305 CrossRef CAS.
- W. A. Wattigney, E. Irvin-Barnwell, Z. Li, S. I. Davis, S. Manente, J. Maqsood, D. Scher, R. Messing, N. Schuldt, S. A. Hwang and K. M. Aldous, Biomonitoring programs in Michigan, Minnesota, and New York to assess human exposure to Great Lakes contaminants, Int. J. Hyg. Environ. Health, 2019, 222, 125–135 CrossRef CAS PubMed.
- M. A. Wattigney and T. Mohammadi, Adsorption of divalent heavy metal ions from water using carbon nanotube sheets, J. Hazard. Mater., 2011, 185, 140–147 CrossRef PubMed.
- M. A. Tofighy and T. Mohammadi, Divalent heavy metal ions removal from contaminated water using positively charged membrane prepared from a new carbon nanomaterial and HPEI, Chem. Eng. Sci., 2020, 388, 124192 CrossRef CAS.
- K. Vijayaraghavan, S. Rangabhashiyam, T. Ashokkumar and J. Arockiaraj, Mono and multi-component biosorption of Pb(II), Cd(II), Cu(II) and Ni(II) ions onto coco-peat biomass, Sep. Sci. Technol., 2016, 51, 2725–2733 CrossRef CAS.
- H. Tian, L. Jiao and D. Dong, Rapid determination of trace cadmium in drinking water using laser-induced breakdown spectroscopy coupled with chelating resin enrichment, Sci. Rep., 2019, 9, 10443 CrossRef PubMed.
- W. Tang, B. Shan, H. Zhang, W. Zhang, Y. Zhao, Y. Ding, N. Rong and X. Zhu, Heavy metal contamination in the surface sediments of representative limnetic ecosystems in eastern China, Sci. Rep., 2014, 4, 7152 CrossRef CAS PubMed.
- S. Mahiya, G. Lofrano and S. K. Sharma, Heavy metals in water, their adverse health effects and biosorptive removal: a review, Int. J. Chem., 2014, 3, 132–149 CAS.
- R. Baby, B. Saifullah and M. Z. Hussein, Carbon nanomaterials for the treatment of heavy metal-contaminated water and environmental remediation, Nanoscale Res. Lett., 2019, 14, 1–7 CrossRef CAS PubMed.
- M. A. M. Munir, G. Liu, B. Yousaf, M. U. Ali, A. I. Cheema, M. S. Rashid and A. Rehman, Bamboo-biochar and hydrothermally treated-coal mediated geochemical speciation, transformation and uptake of Cd, Cr, and Pb in a polymetal(iod)s-contaminated mine soil, Environ. Pollut., 2020, 265, 114816 CrossRef PubMed.
- M. Naushad, T. Ahamad and K. M. Al-Sheetan, Development of a polymeric nano-composite as a high-performance adsorbent for Pb(II) removal from water medium: equilibrium, kinetic and antimicrobial activity, J. Hazard. Mater., 2021, 407, 124816 CrossRef CAS PubMed.
- N. Efecan, T. Shahwan, A. E. Eroğlu and I. Lieberwirth, Characterization of the uptake of aqueous Ni(II) ions on nanoparticles of zero-valent iron (nZVI), Desalination, 2009, 249, 1048–1054 CrossRef CAS.
- N. Moraci and P. S. Calabrò, Heavy metals removal and hydraulic performance in zero-valent iron/pumice permeable reactive barriers, J. Environ. Manage., 2010, 91, 2336–2341 CrossRef CAS PubMed.
- Z. Li, H. Dong, Y. Zhang, J. Li and Y. Li, Enhanced removal of Ni(II) by nanoscale zero valent iron supported on Na-saturated bentonite, J. Colloid Interface Sci., 2017, 497, 43–49 CrossRef CAS PubMed.
- L. Jarup, Cadmium overload and toxicity, Nephrol., Dial., Transplant., 2002, 17, 35–39 CrossRef CAS PubMed.
- M. Chabicovsky, W. Klepal and R. Dallinger, Mechanisms of cadmium toxicity in terrestrial pulmonates: programmed cell death and metallothionein overload, Environ. Toxicol. Chem., 2004, 23, 648–655 CrossRef CAS PubMed.
- Y. Xi, Y. T. Luo, J. M. Luo and X. B. Luo, Removal of Cd(II) from wastewater using novel cadmium ion-imprinted polymers, J. Chem. Eng. Data, 2015, 60, 3253–3261 CrossRef CAS.
- G. Bhanjana, N. Dilbaghi, K. H. Kim and S. Kumar, Carbon nanotubes as sorbent material for removal of cadmium, J. Mol. Liq., 2017, 242, 966–970 CrossRef CAS.
- S. A. Nabi, M. Shahadat, A. H. Shalla and A. M. Khan, Removal of heavy metals from synthetic mixture as well as pharmaceutical sample via cation exchange resin modified with rhodamine B: its thermodynamic and kinetic studies, Clean: Soil, Air, Water, 2011, 39, 1120–1128 CAS.
- Z. Xu, S. Gu, D. Rana, T. Matsuura and C. Q. Lan, Chemical precipitation enabled UF and MF filtration for lead removal, J. Water Process Eng., 2021, 4, 101987 CrossRef.
- Y. Cui, Q. Ge, X. Y. Liu and T. S. Chung, Novel forward osmosis process to effectively remove heavy metal ions, J. Membr. Sci., 2014, 467, 188–194 CrossRef CAS.
- M. D. Yahya, K. S. Obayomi, M. B. Abdulkadir, Y. A. Iyaka and A. G. Olugbenga, Characterization of cobalt ferrite-supported activated carbon for removal of chromium and lead ions from tannery wastewater via adsorption equilibrium, Water Sci. Eng., 2020, 13, 202–213 CrossRef.
- J. Jung, M. Sibag, B. Shind and J. Cho, Experimental investigation of organic fouling mitigation in membrane filtration and removal by magnetic iron oxide particles, Membr. Water Treat., 2020, 11, 223–229 Search PubMed.
- D. Huang, B. Li, J. Ou, W. Xue, J. Li, Z. Li, T. Li, S. Chen, R. Deng and X. Guo, Megamerger of bio-sorbents and catalytic technologies for the removal of heavy metals from wastewater: preparation, final disposal, mechanism and influencing factors, J. Environ. Manage., 2020, 261, 109879 CrossRef CAS PubMed.
- T. Panigrahi and A. U. S. Kumar, Adsorption process for reducing heavy metals in textile industrial effluent with low-cost adsorbents, Prog. Chem. Biochem. Res., 2020, 3, 135–139 CrossRef CAS.
- S. Bolisetty, M. Peydayesh and R. Mezzenga, Sustainable technologies for water purification from heavy metals: review and analysis, Chem. Soc. Rev., 2019, 48, 463–478 RSC.
- Y. Bulut, Removal of heavy metals from aqueous solution by sawdust adsorption, J. Environ. Sci., 2007, 19, 160–166 CrossRef CAS PubMed.
- S. Tamjidi and A. Ameri, A review of the application of sea material shells as low cost and effective bio-adsorbent for removal of heavy metals from wastewater, Sci. Pollut. Res., 2020, 27, 31105–31119 CrossRef CAS PubMed.
- M. Ariannezhad, D. Habibi and S. Heydari, Synthesis of tetrazoles from amines mediated by new copper nanocatalyst, Russ. J. Org. Chem., 2019, 55, 1591–1597 CrossRef CAS.
- Z. Lin, Z. Pan, Y. Zhao, L. Qian, J. Shen, K. Xia, Y. Guo and Z. Qu, Removal of Hg2+ with polypyrrole-functionalized Fe3O4/kaolin: synthesis, performance and optimization with response surface methodology, Nanomaterials, 2020, 10, 1370 CrossRef CAS PubMed.
- K. Chen, J. He, Y. Li, X. Cai, K. Zhang, T. Liu, Y. Hu, D. Lin, L. Kong and J. Liu, Removal of cadmium and lead ions from water by sulfonated magnetic nanoparticle adsorbents, J. Colloid Interface Sci., 2017, 494, 307–316 CrossRef CAS PubMed.
- Y. Tan, M. Chen and Y. Hao, High efficient removal of Pb(II) by amino-functionalized Fe3O4 magnetic nano-particles, Chem. Eng. Sci., 2012, 191, 104–111 CrossRef CAS.
- A. Rais and M. Anam, Facile one pot green synthesis of chitosan-iron oxide (CS-Fe2O3) nanocomposite: removal of Pb(II) and Cd(II) from synthetic and industrial wastewater, J. Cleaner Prod., 2018, 186, 342–352 CrossRef.
- L. P. Lingamdinne and J. R. Koduru, Green synthesis of iron oxide nanoparticles for lead removal from
aqueous solutions, Key Eng. Mater., 2019, 805, 122–127 Search PubMed.
- M. Emadi and E. Shams, Preconcentration of Pb2+ by iron oxide/amino-functionalized silica core–shell magnetic NPs as a novel solid-phase extraction adsorbent and its determination by flame atomic adsorption spectrometry, J. Iran. Chem. Soc., 2013, 10, 325–332 CrossRef CAS.
- R. Shalini, C. U. Pittman Jr and M. Dinesh, Magnetic magnetite (Fe3O4) nanoparticle synthesis and applications for Pb2+ and Cr6+ removal from water, J. Colloid Interface Sci., 2016, 468, 334–346 CrossRef PubMed.
- M. Setoodehkhah and S. Momeni, Water soluble Schiff base functionalized Fe3O4 magnetic nano-particles as a novel adsorbent for the removal of Pb(II) and Cu(II) metal ions from aqueous solutions, J. Inorg. Organomet. Polym. Mater., 2018, 28, 1098–1106 CrossRef CAS.
- C. Irawan, I. F. Nata and C. K. Lee, Removal of Pb(II) and As(V) using magnetic nanoparticles coated montmorillonite via one-pot solvothermal reaction as adsorbent, J. Environ. Chem. Eng., 2019, 7, 103000 CrossRef CAS.
- J. Nonkumwong, S. Ananta and L. Srisombat, Effective removal of lead(II) from waste-water by amine-functionalized MgFe2O4 nanoparticles, RSC Adv., 2016, 6, 47382–47393 RSC.
- M. Keshvardoost Chokami, L. Babaei, A. A. Parizanganeh and F. Piri, Synthesized chitosan/iron oxide nanocomposite and shrimp shell in removal of Ni, Cd, and Sn from aqueous solution, Global J. Environ. Sci. Manage., 2017, 3, 267–278 CAS.
- S. P. Kuang, Z. Z. Wang, J. Liu and Z. C. Wu, Preparation of triethylene-tetramine grafted magnetic chitosan for adsorption of Pb(II) ion from aqueous solutions, J. Hazard. Mater., 2013, 260, 210–219 CrossRef CAS PubMed.
- R. K. Sharma, A. Puri, Y. Monga and A. Adholeya, Acetoacetanilide-functionalized Fe3O4 nanoparticles for selective and cyclic removal of Pb2+ ions from different charged waste-waters, J. Mater. Chem. A, 2014, 2, 12888–12898 RSC.
|
| This journal is © The Royal Society of Chemistry 2023 |
Click here to see how this site uses Cookies. View our privacy policy here. 
 Open Access Article
 This Open Access Article is licensed under a Creative Commons Attribution-Non Commercial 3.0 Unported Licence
 *a,
Somayyeh Heydarib and
Maryam Ariannezhada
*a,
Somayyeh Heydarib and
Maryam Ariannezhada