
 Open Access Article
 This Open Access Article is licensed under a Creative Commons Attribution-Non Commercial 3.0 Unported Licence
Explication of mechanism governing atmospheric degradation of 3D-printed poly(lactic acid) (PLA) with different in-fill pattern and varying in-fill density
Swamini Chopra *a,
Kavita Pande*b,
Priadarshni Puranamc,
Abhay D. Deshmukhd,
Avinash Bhonea,
Rameshwar Kalea,
Abhishek Galandea,
Balaji Mehtrea,
Jaydeep Tagada and
Shrikant Tidakea
*a,
Kavita Pande*b,
Priadarshni Puranamc,
Abhay D. Deshmukhd,
Avinash Bhonea,
Rameshwar Kalea,
Abhishek Galandea,
Balaji Mehtrea,
Jaydeep Tagada and
Shrikant Tidakea
aCentre of Excellence in Materials and Metallurgy, Mechanical Engineering Department, Maharashtra Institute of Technology, Aurangabad, India. E-mail: chopra.swamini@gmail.com
bDirector, Matverse Vision Pvt. Ltd., Nagpur, India. E-mail: kavita19pande@gmail.com
cDepartment of Mechanical Engineering, Marathwada Institute of Technology, Aurangabad, India
dDepartment of Physics, Rashtrasant Tukdoji Maharaj Nagpur University, Nagpur, India
First published on 3rd March 2023
Abstract
With the popularity of 3D-printing technology, poly(lactic acid) (PLA) has become a very good option for layer by layer printing as it is easy to handle, environment friendly, has low costs and most importantly, it is highly adaptable to different materials including carbon, nylon and some other fibres. PLA is an aliphatic poly-ester that is 100% bio-based and is bio-degradable as well. It is one of the rare bio-polymers to compete with traditional polymers in terms of performance and environmental impact. However, PLA is sensitive to water and susceptible to degradation under natural conditions of ultra-violet rays (UV), humidity, fumes, etc. There are many reports on the bio-degradation and photo-degradation of PLA which deal with the accelerated weathering test. However, the accelerated weathering test instruments lack the ability to correlate the stabilities maintained by the test with the actual occurrences during natural exposure. Thus, an attempt has been made in the present work to expose the 3D-printed PLA samples to actual atmospheric conditions of Aurangabad city (M.S.) in India. The degradation of PLA after the exposure is studied and a mechanism is elucidated. Additionally, the tensile properties of the PLA samples are evaluated to correlate the extent of degradation and the material performance. It was found that though the performance of PLA deteriorates with the exposure time, the combination of in-fill pattern and volume plays an important role on the tensile properties and the extent of degradation. It is concluded herein that with natural exposure, the degradation of PLA occurs in two stages, supported by a side reaction. Thus, this study offers a new perspective towards the life of components in actual application by exposing PLA to the natural atmosphere and evaluating its strength and structure.
1. Introduction
With the advent of plastic and polymer technology, the scenario in every household has changed. The light-weight, slightly cheaper and convenient plastic started replacing the heavy and comparatively costlier metal utensils, storage boxes, etc. very rapidly. Simultaneously, the use of plastic pots for plants over earthen pots has gained popularity in the last few decades, due to the variety of designs and colours available. The increase in the use of plastic commodities in daily life has eventually increased the issues of disposal. Synthetic petroleum-based polymers pose this threat on a larger scale. Thus, driven by the environmental concerns, awareness of waste disposal techniques and the hopes of developing a sustainable society, bio-based and bio-degradable polymers have attracted substantial interest over the past few years.1–11Bio-based polymers are those which are derived from non-petroleum resources or produced from the raw materials of the agricultural production chain, like sugarcane, cassava, corn, etc.9,12,13 Some bio-based polymers may not be bio-degradable. Bio-based only refers to the start material used to make the polymer and it does not imply anything about how it will degrade at the end of its life. On the other hand, bio-degradable polymers are those that can undergo a chemical process where certain enzymes or micro-organisms in the environment break-down the macromolecule back into a natural substance like carbon di-oxide (CO2), biomass and water. Some bio-degradable polymers may not be bio-based and in fact are fossil-based. The degradation of fossil-based polymers is somewhat slow and they are termed controversial due to their possible interference with recycling efforts.14–18 Though these two types of polymers are market-lucrative, it would be of great economic importance to have a bio-polymer with the benefit of both (Fig. 1). A bio-polymer made from bio-based raw material outweighs the ever increasing demand for fossil-based raw materials and its bio-degradable nature can contribute towards a healthier environment.19,20
 | ||
| Fig. 1 Schematic representation of bio-polymer, bio-based polymer and bio-degradable polymer.21 | ||
Aliphatic poly(esters) have been used in a wide range of applications due to their capability to bio-degrade in natural environments,9,22,23 including packaging materials and agricultural mulch films. Poly(lactic acid) (PLA) is one such polymer that is 100% bio-based and bio-degradable. It is made of agricultural resource such as corn starch or sugarcane. PLA is basically polymerized from a monomer called lactide, which is obtained from a compound lactic acid obtained by fermenting sugar or starch. It is one of the rare bio-polymers to compete with traditional polymers in terms of performance and environmental impact.24 Due to its properties such as low density, easy manufacturing, corrosion resistance, less CO2 emissions on degrading, non-toxic to humans; PLA displays a huge potential for unexplored applications.25–27 As compared to common polymers like poly(styrene) (PS) and poly(ethylene-terephthalate) (PET), PLA is superior in terms of some properties, like, flexural modulus of PLA is superior to that of PS. The resistance of PLA to fatty foods and dairy products is equivalent to that of PET, as reported by many.14,28–31 PLA is safe to use with food and it is most commonly found in this sector for commodities like bags, pots, capsules, packaging, tea bags, etc. It is further expanding to an increasing variety of applications, such as: in the home (floor and wall coatings, curtains, protections, textiles, bin bags, vacuum cleaner bags, toys, electronic appliances, wipes, nappies, etc.), electronics (smartphone protection, computers), various types of packaging, hygiene (wipes, nappies), agriculture (pots, films, strain, clips, etc.), cars (dashboards, trims), and industry (poly bags, blisters, bubble wrap, etc.).30–32
3D-printing [also known as Additive Manufacturing (AM)] is the process of building objects with complicated structures in three dimensions. This technique has become very popular over the past decade and is successfully applied in various fields of construction, engineering, aerospace, prosthesis, etc.33–36 The conventional manufacturing techniques demand a higher cost and requires a longer cycle time to design and fabricate a mould/prototype before actual production can began. It is also difficult to achieve the conditions of mass customization in conventional processes. AM overcomes this drawback by building complex shapes layer by layer, which creates a lightweight structure, resulting in low material costs.33,37 Fused Deposition Modelling (FDM) is one such AM building methods that extrudes thermoplastic materials layer-by-layer into desired shape. It is the most commonly used AM technique as it is simple to use, is economical, has a high processing speed and can be used for a variety of materials.38,39 Therefore, with the popularity of 3D-printing technology, PLA has become a very good option for printing as it is easy to handle, bio-degradable, environment friendly, has low cost and most importantly, it is highly adaptable to different materials including carbon, nylon and some other fibres.40,41
Irrespective of the method of fabrication, PLA is still susceptible to degradation under operating conditions. 3D-printing of PLA may give benefits in terms of component performance, but the inherent degradation of PLA material itself under natural conditions like ultra-violet rays (UV), humidity, water, fumes, etc. is unavoidable. There are many reports on the bio-degradation and photo-degradation of PLA.9,12,13,26,27,42–50 However, the physical and chemical structure of the PLA are the basic factors affecting the degradation rate and type of degradation mechanisms. PLA can form highly crystalline structures that are known to be more difficult to hydrolyze than amorphous parts of the polymer.51–56 The degradation mechanism of PLA under the effects of UV and Relative Humidity (RH) has been widely studied.9,12,14,47,50,54,55,57 The cause of PLA degradation is majorly summarized by two mechanisms reported frequently. First, a photolysis reaction in the presence of UV breaks the PLA backbone C–O bond. Second, with further exposure to UV and ambient conditions, the photo-degradation of PLA accelerates and results in the formation of a hydroperoxide radical. With the progression of exposure, a subsequent degradation of this radical leads into the formation of compounds with carboxyl end groups. Some even report that when bio-polymers from poly(ester) group are exposed to the environment-like conditions, hydrolytic degradation can also occur in addition to bio-degradation and photo-degradation.9,12,27,58
In many of these reports, accelerated weathering test is used to study the degradation behaviour of polymers and its component life by simulating service-like conditions. However, the accelerated weathering test instruments lack to correlate the stabilities maintained by the test with the actual occurrence during natural exposure.26,59–61 The xenon lamps used commonly in the weathering test instruments have a spectrum comparable to the UV spectrum of the sun. But with prolonged test duration, the temperatures of the operating conditions increases, thereby, changing the spectrum by the time it reaches the surface of interest.26,62,63 Even though the use of weathering test instruments can achieve UV light with wavelength above 300 nm (matching with that of the sun), it is not possible to accurately predict the events in terms of RH%, water content, exposure to other fumes or gases, etc. Thus, in order to understand the actual degradation behaviour of PLA, the tests must be conducted in real time with real application environment, for example like packaging materials, agricultural mulch films, etc. Thus, an attempt has been made in present work to expose the 3D-printed PLA samples to actual atmospheric conditions of the Aurangabad city (M.S.), India. The degradation of PLA after the exposure is studied and a mechanism is elucidated. Additionally, the tensile properties of the PLA samples are evaluated to correlate the extent of degradation on the material performance.
2. Experimental details
2.1 Poly(lactic acid) (PLA) filament and 3D-printing (FDM)
The PLA filament (Make: Augment 3Di) was procured from Coimbatore (T.N.), India in varying colours, having diameter 1.75 ± 0.02 mm with printing temperature between 200 °C to 220 °C. The FDM based 3D-printer (Make: Creality, Model: Ender-3 Pro) was used to fabricate the samples at printing speed 4 mm s−1, slice thickness 0.4 mm, nozzle diameter 0.4 mm, nozzle temperature 200 °C and bed temperature 60 °C. The samples were designed in Autodesk Fusion 360 software according to ASTM standard D638 Type I, as shown in Fig. 2. The design was imported as an STL format file and Ultimaker Cura software was used to integrate the 3D-printer. The aim of present study is to explore the effect of various in-fill pattern and densities on the tensile properties of the PLA structure. Thus, six different types of in-fill patterns were selected with varying in-fill densities. The details of the samples and their codes for easy understanding are given in Table 1. The 3D-printed PLA samples with different in-fill patterns are illustrated from Fig. 3(a) to (l).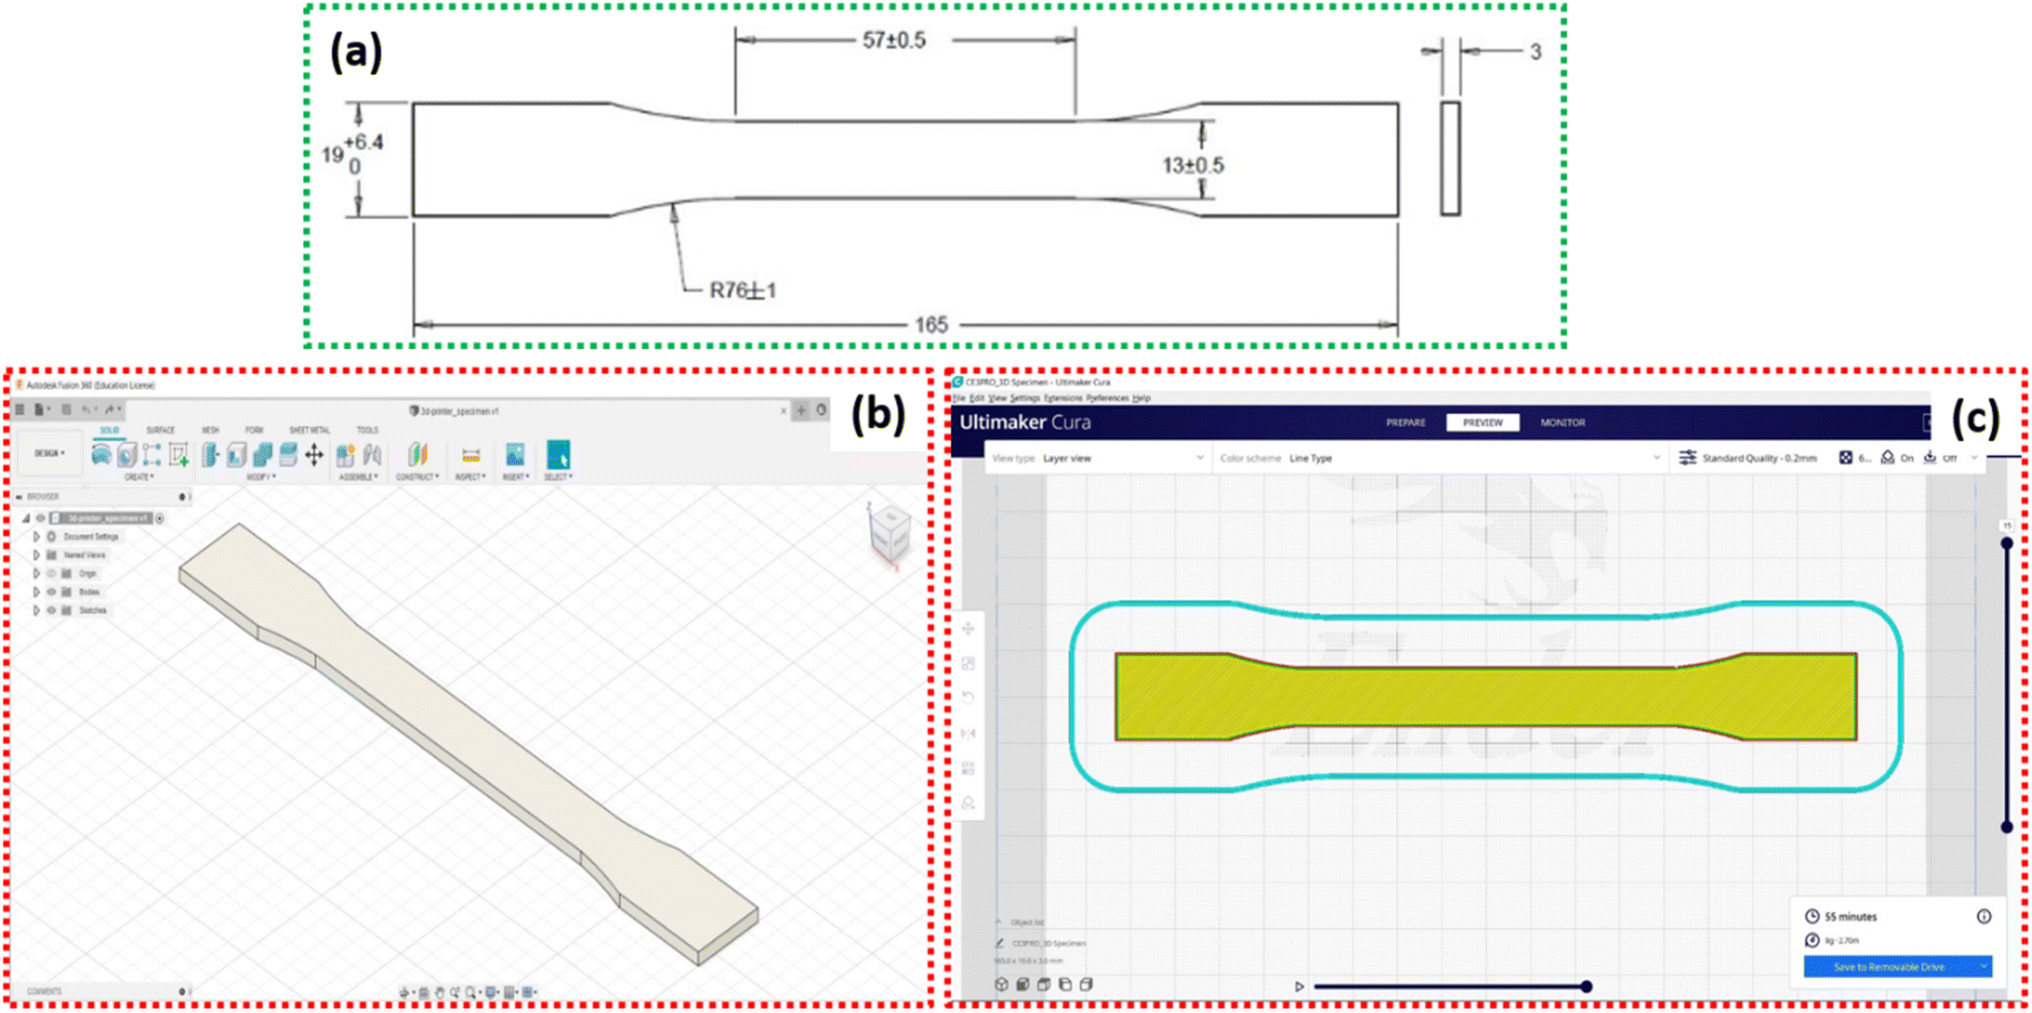 | ||
| Fig. 2 (a) Tensile test sample (Type I) according to ASTM standard D638, (b) sample design in Autodesk Fusion 360 software, (c) sample design as imported in Ultimaker Cura software. | ||
| In-fill density | In-fill pattern | |||||
|---|---|---|---|---|---|---|
| Concentric | Grid | Tri-hexagon | Triangular | Square (rectilinear) | Octet | |
| 20% | C20 | G20 | TH20 | T20 | S20 | O20 |
| 40% | C40 | G40 | TH40 | T40 | S40 | O40 |
| 60% | C60 | G60 | TH60 | T60 | S60 | O60 |
| 80% | C80 | G80 | TH80 | T80 | S80 | O80 |
| 100% | C100 | G100 | TH100 | T100 | S100 | O100 |
![[thin space (1/6-em)]](https://www.rsc.org/images/entities/char_2009.gif) |
||||||
| Degradation state | ||||||
| No degradation (immediate testing) | PLA-0 | |||||
| Degradation of 30 days | PLA-30 | |||||
| Degradation of 45 days | PLA-45 | |||||
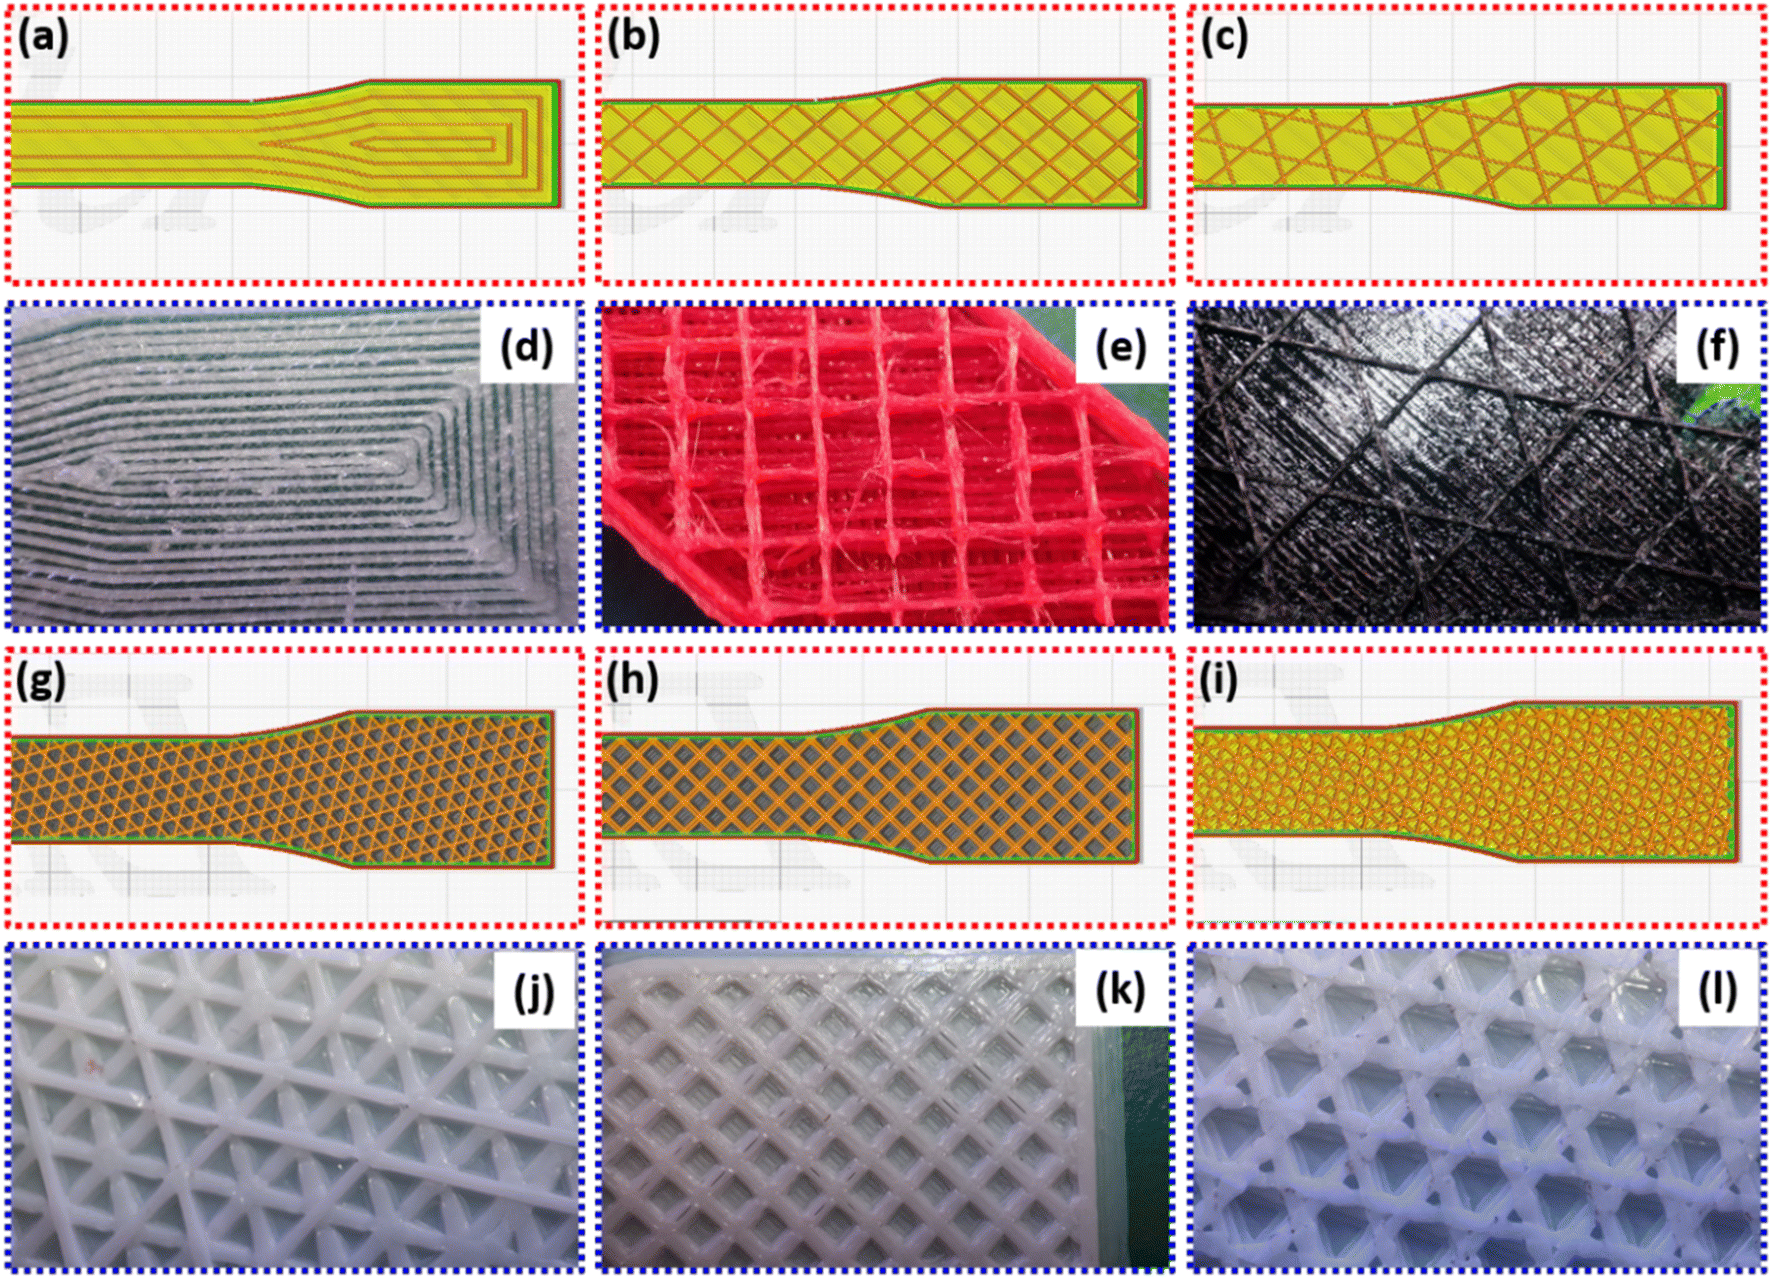 | ||
| Fig. 3 Sample in-fill patterns as imported in Ultimaker Cura software. (a) Concentric, (b) grid, (c) tri-hexagon, (g) triangular, (h) square (rectilinear), (i) octet and 3D-printed PLA samples with in-fill patterns (d) concentric, (e) grid, (f) tri-hexagon, (j) triangular, (k) square (rectilinear), (l) octet. | ||
2.2 Atmospheric degradation process
The PLA samples 3D-printed with different in-fill patterns and densities were exposed to the actual atmospheric conditions of UV rays from the sun, occasional rain, an average high and low temperatures of ∼34 °C and ∼25 °C and a relative humidity (RH) of ∼56% for 30 days (720 hours) and 45 days (1080 hours). The average temperature and RH for the stipulated duration is as per the report of the local whether department.64 The changes in the rainfall parameters throughout the duration of exposure are assumed to be uniform, as the total duration of rain was negligible (∼10 hours). The reason to expose the samples to such conditions is because of the many PLA applications like packaging materials, agricultural mulch films, flower pots, gardening structures, decorative items, etc. The weather (RH, rainfall, etc.) is one parameter that is out of control of the humans, thus, using natural environment to test degradation and tensile properties of PLA is more realistic.2.3 Tensile testing
The PLA samples, before and after degradation, were tensile tested on a Universal Testing Machine (UTM) (Make: International Equipments) at cross-head speed of 5 mm min−1 at ambient conditions. The gauge length for type-I tensile sample according to ASTM standard D638 is 57 mm and the cross section area is 13 mm × 3 mm. An average of five samples tested are reported for the values of tensile strength and tensile modulus.2.4 Fourier transform infra-red (FTIR) analysis
The structure of the PLA was determined using FTIR spectrometer (Make: Shimadzu, Model: FTIR 1-S Affinity) for wavenumber range 400–4000 cm−1. The changes in the intensity and position of structural peaks of PLA material is compared before degradation and after degradation of 30 and 45 days, respectively. The samples were scanned with an attenuated total reflection (ATR) unit using single crystal Diamond probe with 45 runs.2.5 Differential scanning calorimetry (DSC) analysis
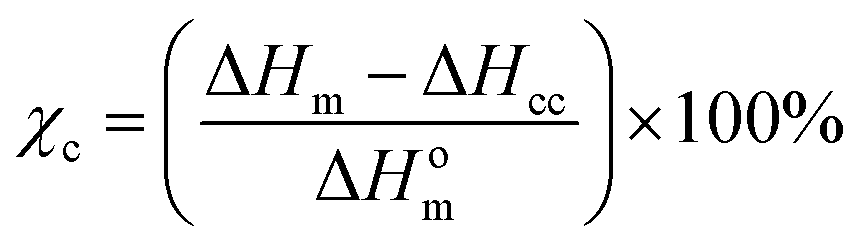
The changes in the crystallinity of PLA was determined using DSC (Make: Shimadzu, Model: DSC-60 Plus) using the following cycle: (i) ∼10 mg. sample was sealed in a standard 40 μl aluminium pan and heated at the rate of 10 °C min−1 up to 300 °C, (ii) holding at 200 °C for 10 min, (iii) cooling at the rate of 10 °C min−1 up to ambient temperature and (iv) holding at ambient temperature for 10 min. The degree of crystallization (χc) for PLA before and after degradation was determined using the following equation:
 | (1) |
2.6 Molecular weight analysis
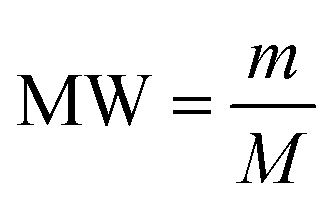
The change in the molecular weight of PLA after degradation was determined by End Group Analysis technique. The test was performed dissolving 1 g of PLA sample in 10 ml of ethyl acetate and titrating the solution with 10 molar sodium hydroxide (NaOH) solution. The molarity of the solution was determined after titration and by using the following equation, molecular weight was determined:
 | (2) |
3. Results and discussion
3.1 Mechanical properties
The tensile strength and tensile modulus of the PLA samples 3D-printed with different in-fill pattern and densities along with the state of degradation are shown in Fig. 4. It can be seen from Fig. 4(a) that with increasing in-fill density the tensile strength of PLA before degradation (PLA-0) follows a same trend irrespective of the pattern. The tensile strength increases with in-fill density. Similar trends are reported by many.66–72 It can be seen that though the tensile strength is increasing with in-fill density, however the percentage increase varies with the in-fill pattern. The highest tensile strength at 20% in-fill density for degradation state PLA-0 is exhibited by both concentric and square patterns at ∼29 MPa. This can be attributed to the fact that in concentric pattern the volume of layers in the direction of tensile loading is more.66,68,69 The type-I tensile sample is usually loaded in the direction of its longest dimension. As the concentric pattern tends to follow the outline of the sample shape, the printed layers are inherently in a direction parallel to the tensile loading direction. This gives advantage in terms of load bearing capacity of the material. On the other hand, though the grid and the square pattern look similar, the difference in the cavity size is obvious. The grid pattern uses a larger cavity, while the square pattern uses a relatively smaller cavity. The in-fill density in both the patterns are maintained similar by adjusting the number of layer deposited and thickness of layer. As the cavities in between two adjacent layers is larger for grid pattern, there are two factors causing lower strength as compared to square pattern. | ||
| Fig. 4 Tensile strength and tensile modulus of PLA samples with different in-fill patterns and densities for degradation state (a and d) PLA-0, (b and e) PLA-30 and (c and f) PLA-45. | ||
As the cavity size increases, the volume of material required for grid pattern is less than that required for square pattern having same in-fill density and same printing speed. For the samples under study, G20 uses 6 g of PLA filament, while S20 uses 19 g. In addition, the square pattern has more number of layers which makes this pattern structurally strong. A similar phenomenon is reported by Milovanović et al.,73 Derise et al.74 and Khan et al.75 They mention that the increase in the number of layers or a decrease in the cavity size means more number of mechanical and/or physical bonds are forming between the adjacent layers. This bond is resulted from the adhesion of the melted layer with the previously printed adjacent layer and consecutive relative solidification. The better the bonding, more load can be supported by the structure.76,77 These two factors contribute towards the fact that the tensile strength of S20 sample is more than that of G20, even with the similarities. The tensile strength of G20 is ∼25 MPa and for T20 is ∼26 MPa. However, it is important to note here that the tri-hexagonal sample exhibits the lowest strength at all in-fill densities. For TH20, the tensile strength is ∼4 MPa. This is again exhibited by73,74 that as compared to other patterns, the tri-hexagon or hexagon pattern (aka honeycomb) pattern demonstrated the lowest tensile strength owing to a higher volume of cavities. This is visible from Fig. 3(c) and (f) as well. The PLA samples under present study having tri-hexagon in-fill pattern has maximum cavities at all in-fill densities. This ultimately leads to less tensile strength due to less volume of materials present to take up the load and weaker bonding between adjacent layers. Thus, concentric and square patterns prove to be strongest under present study for 20% in-fill density.
As the in-fill density increases to 40%, the highest tensile strength is exhibited by square pattern, which is ∼31 MPa. The strengths of the concentric and triangular patterns are not far off, both exhibiting ∼30 MPa, while grid and octet patterns following closely at ∼28 and ∼27 MPa, respectively. However, similar to TH20, the tri-hexagon pattern with 40% in-fill density has lowest tensile strength at ∼6 MPa. Further, with 60% in-fill density, concentric once again has highest tensile strength of ∼34 MPa, the triangle pattern follows at ∼31 MPa and the tensile strength of square pattern remains at ∼31 MPa. Additionally, the strength of grid and octet patterns increase marginally to ∼30 MPa and ∼28 MPa, respectively. Simultaneously, while tri-hexagon pattern shows improvement in tensile strength (∼9–10 MPa), it still remains the weakest pattern. With 80% in-fill density, the tensile strength of the PLA has increased significantly, irrespective of the in-fill pattern. The concentric pattern with 80% in-fill density has a tensile strength of ∼42 MPa, 8 units more than C60, while, the octet pattern reaches ∼38 MPa, which is 10 units higher than O60. In a similar trend, the tensile strength of S80 is increasing by 6 units to ∼37 MPa, while for G80 it is increasing by 5 units to ∼35 MPa. And the tri-hexagon pattern still shows marginal increment in tensile strength to ∼12 MPa. Finally, at 100% in-fill density, though the samples are completely solid with no cavities, the in-fill pattern is still significant. Thus, it can be seen from Fig. 4(a) that the tensile strength for all the patterns in PLA-0 condition is the highest. This can be attributed to the absence of cavities in the structure. The concentric, square, octet and triangle patterns exhibit equal and highest tensile strength at ∼51–52 MPa, while the grid pattern has a tensile strength of ∼47 MPa. This can be credited to the inherent pattern shape that results in reduced volume of cavities. It is evident from Fig. 3 that the cavities are larger and more in volume as seen in the tri-hexagonal pattern. This does not help the PLA material to sustain more loads even at 100% in-fill density, thus giving a strength of mere ∼13 MPa.
For 100% in-fill density, apart from the fact that there are no cavities in the pattern design, it can be elucidated here that though similar to bulk material, the pattern will govern the material properties. For different patterns, the layout of layers is different and their orientation with respect to the tensile loading direction will surely affect the tensile strength. In case of samples C100, S100, O100 and T100; Fig. 3 clearly indicates this fact. For concentric pattern, the maximum amount of layers are perfectly parallel to the tensile loading direction, while for square pattern one can say that the layers are at 45° inclination to the loading direction, which still provide more resistance than layers oriented at any other angle.33,77–80 Various extensive studies mention that for low layer orientation angle like 30° or less (tri-hexagon pattern under study) the action of tensile pull is similar to a shearing force across its length. The uneven distribution of load in horizontal and vertical components of the inclined layer breaks apart the layer easily, resulting in inter-layer fracture. Whereas for a layer orientation angle of 45° (square or grid pattern under study), the distribution of load in horizontal and vertical for the layer is equivalent thereby reducing the chances of inter-layer fracture.
Some studies report that in-layer fracture mode for 3D-printed objects is preferred as it allows the material to sustain more load before an individual layer can fail.81–83 On the other hand, for high layer orientation angle like 90°, the layer is subjected to linear force across its diameter,81 which may result in peeling of layer along the length.82 This mode is still preferred over inter-layer fracture as the load bearing capacity of the sample increases until a significant volume of individual layers have failed. In inter-layer fracture, the mechanical and/or physical bonding that occurs between adjacent layers during 3D-printing and consecutive solidification is weakened. Here, the layer may still have load bearing capacity individually, but the separation of layers from each other weakens the material and may lead to an early fracture. This phenomenon is illustrated in Fig. 5 along with an example of effect of layer orientation from the in-fill pattern on the mode of fracture. Such difference in the response of a single 3D-printed layer with different orientation changes the load bearing capacity of the PLA sample as a whole. As octet and triangular patterns have layers at a smaller orientation angle with respect to the tensile loading direction, these patterns fail at loads less than that for square and grid patterns, while concentric pattern gives strongest structure. In addition to the effect of 3D-printed layer orientation and volume of cavities, the in-fill density indirectly supports the fact that more the material available across same cross-sectional area, more will be the load carrying capacity. Hence, as in-fill density increases, the volume of material present to take up the tensile load increases, irrespective of the in-fill pattern, as explained above. Also, few studies report the effect of in-fill pattern on the localised strain rate when loaded.37,70,84,85 These studies conclude that though the in-fill density of the 3D-printed polymer can cause the shift of high localised strain points from edge to centre, thereby improving fracture behaviour. However, the use of a particular pattern, like concentric or gyroid, distributes the number of localised strain concentration points, thereby improving the strain rate and the fracture behaviour.
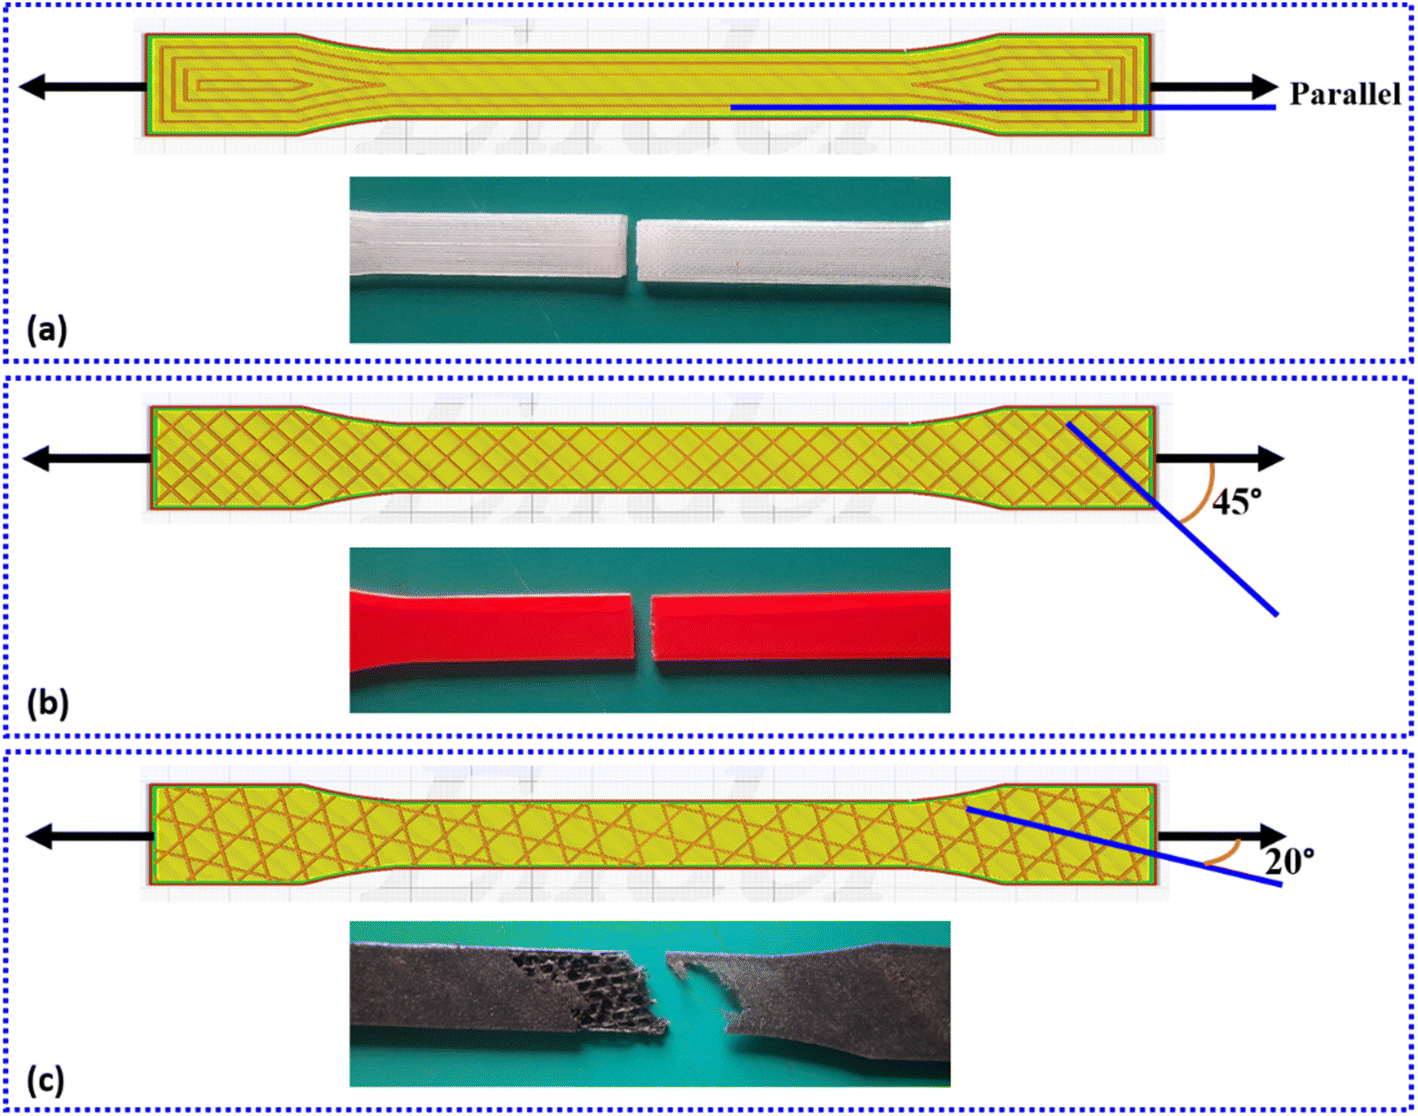 | ||
| Fig. 5 Schematic showing the effect of in-fill pattern layer orientation on the mode of fracture. | ||
Thus, after careful examination, it can be said here that in addition to the strength of PLA material itself, the in-fill pattern plays a decisive role on the load bearing capacity of the sample as whole, followed by in-fill density.
The tensile modulus of PLA with different in-fill patterns and densities before degradation (PLA-0) is shown in Fig. 4(d). It is the measure of the stiffness of material or indication of its behaviour when the material is stressed, deformed and its recovery to original shape after removal of load.74,79 In order to evaluate the effect of in-fill pattern and density on the ability of PLA component to resist deformation, the tensile modulus is studied herein. The response of tensile modulus to in-fill pattern and density is slightly different from that of the tensile strength. It is described above in detail that irrespective of the in-fill density, the concentric pattern has highest strength as compared to any other pattern. The reason for this is illustrated in Fig. 5 where the orientation of 3D-printed layer of the pattern with the direction of tensile load applied has a major effect on the load bearing capacity of the sample. However, looking at Fig. 4(d) it is evident that the in-fill density plays a major role on the tensile modulus of PLA, instead of in-fill patterns. For concentric pattern as the in-fill density increases, the tensile modulus increases approx. 1.8 times (from ∼1659 MPa for C20 to ∼4797 MPa for C100). However, at 20% in-fill density, the grid pattern exhibits highest modulus of ∼1954 MPa. The grid pattern maintains a higher modulus than concentric pattern up to 80% in-fill density. After that for 100% in-fill density samples, the tensile modulus of C100 drastically increases to ∼4797 MPA, while G100 exhibits ∼2953 MPa. A similar trend is shown by triangular pattern also, where the tensile modulus increases drastically from ∼1316 MPa for T20 to ∼3267 MPa for T100. The tensile modulus of square pattern demonstrates a growth similar to Grid pattern, albeit with a smaller value. The S20 pattern exhibits ∼1124 MPa of modulus which increases gradually to ∼1852 MPa for 100% in-fill density. However, contrary to tensile strength, the tri-hexagon pattern has excellent tensile modulus. The modulus for 20% in-fill density is very less at ∼636 MPa, however it increases to ∼2424 MPa for TH100. Also, the octet pattern having very good tensile strength comparable with concentric and square, has very low modulus of ∼647 MPa for 20% in-fill density, which increase to ∼1869 MPa for O100 sample. Thus, it is clear that the tensile modulus of the PLA under study is dependant more on the in-fill density than the in-fill pattern.
There are many similar findings37,70,73,74,84–89 which report in a general sense that as more material is present in the sample, it offers more resistance to deformation. The increase in the in-fill density ultimately increases the number of filament contact points. This improves the mechanical and/or physical bonding between the adjacent layers and thus, the capability of the layer to withstand deformation also increases.78,79 In addition, the reduced volume of cavities also improves the inter-layer bonding strength.37 During continuous loading, as the sample reaches the maximum load bearing limit a crack will initiate. Depending on the orientation of printed layer with the direction of loading (Fig. 5) and the volume of material present, the point of crack initiation and the direction of crack propagation changes.86 This improves the ability of the material to deform and absorb more load before the bonding between adjacent layers break,78 thereby increasing the tensile modulus. Thus, it can be said here that, the in-fill density has a greater influence over the tensile modulus of PLA. The different patterns may have different effect on the mechanical resistance values, however, the maximum force that the PLA sample can withstand depends on in-fill density.
Before degradation, it is clear that sample C100 offers best tensile strength and tensile modulus. However, from Fig. 4(b), (c), (e) and (f) it can be seen that after degradation, the response of PLA to tensile testing changes with respect to in-fill pattern, density and degradation time. Fig. 4(b) illustrates the tensile strength of PLA after 30 days of degradation. It is evident that the tensile strength of all the samples have deteriorated consistently irrespective of in-fill pattern and density, as compared to PLA-0. The graph shows that the tensile strength value is more for higher in-fill density. This can again be credited to the presence of more material through same cross-sectional area and reduction of cavities which improves the load bearing capacity of the sample. But it is imperative to note here that the strength values are less as compared to PLA-0. For example, PLA-30 C20 sample has strength ∼18 MPa while PLA-0 C20 sample exhibits ∼29 MPa. Similarly, PLA-30 C100 sample has tensile strength of ∼43 MPa and PLA-0 C100 has ∼52 MPa. Thus, it can be concluded here that the in-fill density does not play a significant role on the strength of PLA after 30 days of degradation, as the trend exhibited is same as that of PLA-0. The increasing strength with in-fill density is the virtue of the material itself, albeit the effect of deterioration reducing the strength. However, it can be seen that the extent of deterioration is different for different patterns. The trend considered for explanation is limited to 100% in-fill density samples of all patterns as they exhibit highest tensile strength in PLA-0 condition. Similar trend is followed by remaining in-fill density samples when compared across all the patterns studied herein. The reduction in the strength of C100, G100, TH100, T100, S100 and O100 is approx. 17%, 21%, 17%, 4% 2% and 5%. respectively. The strength of tri-hexagon pattern which was already the lowest (∼13 MPa) at PLA-0 condition, further reduces after degradation of 30 days. The strength of concentric, square, triangular and octet samples with 100% in-fill density are similar before degradation at ∼51–52 MPa, but after a degradation period of 30 days the maximum reduction is observed for concentric pattern, followed by octet and triangular. The square pattern has retained its strength with hardly ∼2% reduction. Similarly, the grid pattern has experienced highest reduction in tensile strength by 21%. This confirms the claim that the tensile strength of PLA after degradation depends largely on the in-fill pattern.
A similar trend is exhibited by PLA samples after a degradation period of 45 days as well, as seen from Fig. 4(c). The tensile strength is further decreasing after 45 days, however, identical to PLA-30 condition, the strength is more for samples with 100% in-fill density. Thus, the effect of in-fill pattern is still dominant after 45 days of degradation. The reduction in the tensile strength for samples of all the patterns with 100% in-fill density at PLA-45 condition is compared with both PLA-0 and PLA-30 conditions as shown in Table 2. It can be seen here that as the degradation duration increases to 45 days, the extent of degradation is noticeable as compared to PLA-0 condition, as expected. With more exposure time, the attack of UV rays and moisture on the chemical structure of PLA polymer increases and the material becomes weaker. This ultimately reduces the tensile strength. It is evident from Table 2 that the reduction in strength become severe after 45 days of degradation. The grid pattern and tri-hexagon pattern suffer maximum damage, closely followed by square pattern. The strength of concentric pattern reduces by ∼17%, while that of triangular by ∼11%. However, the octet pattern undergoes a minimum reduction of ∼7%. On the other hand, as the degradation progresses from 30 days to 45 days, the extent of damage is less than PLA-30 condition, but it is not helpful. When compared with PLA-0 condition, the duration of exposure to atmospheric conditions proves detrimental for PLA as reported by many.9,12,14,26,53,54,61
| PLA-45 sample | Tensile strength | |
|---|---|---|
| % Reduction against PLA-0 | % Reduction against PLA-30 | |
| C100 | 17% | 7% |
| G100 | 32% | 13% |
| TH100 | 30% | 18% |
| T100 | 11% | 8% |
| S100 | 25% | 23% |
| O100 | 7% | 2% |
On the contrary, it can be seen from Fig. 4(e) and (f) that the tensile modulus of PLA after degradation increases linearly with respect to degradation time and similar to PLA-0 condition, it is more dependent on in-fill density. It is explained above that the tensile modulus of 3D-printed PLA is increase with in-fill density, irrespective of in-fill pattern. Similarly, for PLA-30 and PLA-45 conditions, the modulus is increasing with in-fill density. After degradation of 30 days, the modulus of concentric pattern remains the highest at ∼5207 MPa, followed by grid, triangular and square patterns all around ∼3300–3400 MPa. The tri-hexagon pattern has a modulus of ∼2764 MPa, while octet pattern exhibits minimum modulus value at ∼2234 MPa. For the patterns concentric, grid, tri-hexagon and triangular having 100% in-fill density, the increase in the tensile modulus after 45 days of degradation is marginal. This increment in modulus as degradation time increase to 45 days is approx. 2%, 1%, 5% and 2%, respectively. However, the modulus of square and octet patterns increases by ∼23% and 16% after 45 days of degradation. The probable reason for such behaviour of PLA after degradation, where the tensile strength reduces and tensile modulus increases is explained further in detail.
For PLA polymer under present study, it is clear that the in-fill pattern, density and exposure to atmospheric conditions has different effects on the tensile properties. It is understandable that when exposing to atmosphere, the interaction of material with UV rays of the sun will be far greater than interaction with relative humidity or rain water. It is well known fact that UV radiation causes some chemical modification in PLA which adversely affects the mechanical properties. It is reported in ref. 12 that the UV exposure significantly affects the EVA/PLA blend due to photo degradation mechanism thereby decreasing the mechanical properties. There are many studies consistent with such behaviour.12,14,26,46,47,49,54,61,63,70,84,85 When PLA is exposed to UV rays, the top layer of the material degrades. This surface layer can degrade by photo degradation, bio degradation or even hydrolytic degradation mechanism, depending on the conditions of exposure. When this layer deteriorates, the conditions of exposure can now come in contact with the layers underneath it.26,47,63,66,74,78 The action of UV, moisture and water will be similar again and the inner layer will also start degrading. In case of low in-fill density samples, once the top layer deteriorates, the penetration of these conditions to the layers underneath is rapid due to the more number of cavities present. As the in-fill density increases, the number of layers in the 3D-printed sample increase and the volume of cavities decrease. The availability of more volume of material will essentially require more amount of energy to degrade the 100% in-fill density sample similar to say, 20% density sample. The degradation of any form will eventually reduce the strength of the material, as seen for PLA under study. However, with varying in-fill density, when the exposure time is same, the extent of degradation will be different. Thus, taking example of PLA with concentric pattern at PLA-30 condition, the reduction in the tensile strength of C20 is more than C100 sample (Fig. 4). Thus, it can be said here that the effect of degradation on PLA exposed to atmospheric conditions is dependent more on in-fill density. The more volume of material present, the extent of degradation reduces for same exposure time.
However, the same phenomenon does not act on the tensile modulus of 3D-printed PLA samples under study. Contradictory to few reports,12,33,37 the modulus of PLA is increasing after the exposure. Few studies report that this behaviour can be a result of increasing crystallinity of the material with degradation.1 The probable reason for this increase in crystallinity can be described as follows. The degradation of PLA is usually caused by chain scission. The open ends thus created will increase the content of amorphous segments in the polymer structure. However, when water sensitive polymer like PLA comes in contact with water molecules (both in droplet form and in latent vapour form), the hydrolysis of these amorphous segments will take place. As the broken chains have greater freedom to form more highly organized structures, they will further try to crosslink to stabilise the structure.90,91 This will ultimately increase the crystallinity of the polymer. The increase in crystallinity and the volume of crystalline segments for a limiting amount of crosslinking will enhance the progression of load through the material, thereby increasing the tensile modulus of PLA to some extent.92–95 This phenomenon is explained in detail with the help of DSC analysis and molecular weight analysis in further sections. However, it can be said here that as the material is deteriorating by chain scission, it is more detrimental than any further crosslinking, thereby reducing the tensile strength.1,93,94 Thus, it can be predicted here that the mechanical properties of 3D-printed PLA under study and the effect of degradation is co-dependant on the conditions of exposure as well as in-fill pattern and density. In order to back-up this assumption, the PLA material was characterized for changes in structure by FTIR, DSC and molecular weight analysis.
3.2 FTIR analysis
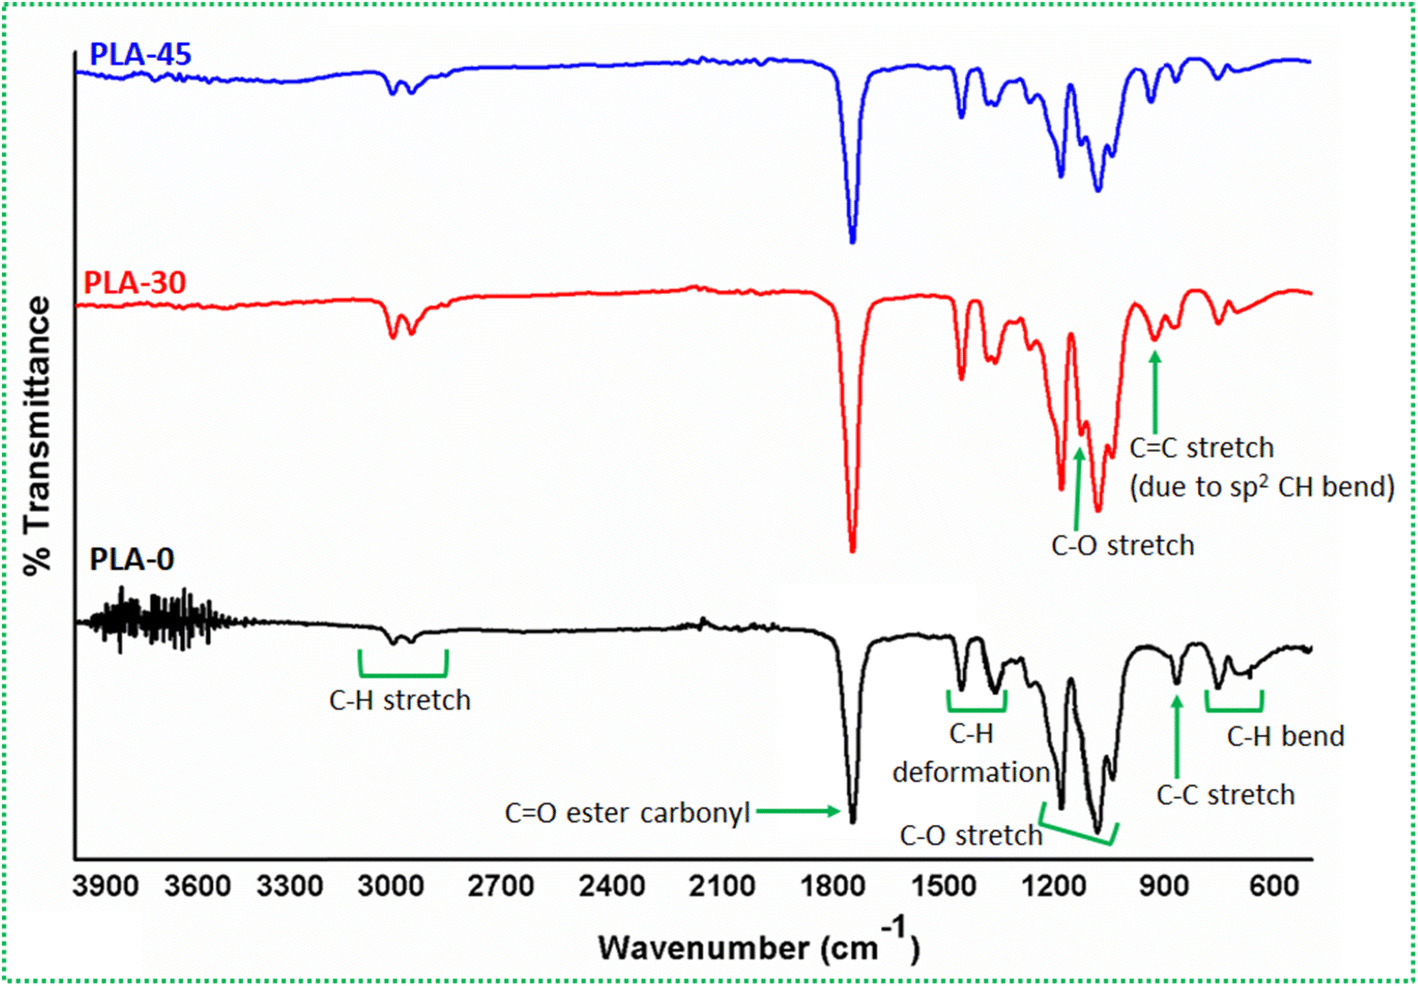
The FTIR graph of PLA before and after degradation is shown in Fig. 6 and the peak values are compared in Table 3. It was observed from FTIR that there are significant changes in the PLA structure after degradation in natural atmosphere for 30 and 45 days. As mentioned above, the effect of UV is dominant for PLA-30 and PLA-45, as compared to moisture and/or rain. The characteristic peaks reflected for PLA-0 are:12,14,26,96,97 –OH group stretch through 3874 to 3655 cm−1, sp3 C–H asymmetric and symmetric stretch at 2947 and 2899 cm−1, C![[double bond, length as m-dash]](https://www.rsc.org/images/entities/char_e001.gif) O ester carbonyl stretch at 1747 cm−1, C–H asymmetric and symmetric bend at 1452 and 1373 cm−1, C–O stretch through 1263 to 1043 cm−1, C–C stretch at 867 cm−1 and C–H rocking at 754 and 700 cm−1. After degradation, all of the PLA signature peaks are retained, however, with following changes: disappearance of –OH group peaks, appearance of a new –OH stretch peak at 3741 cm−1 (only for PLA-45), shifting of C–H asymmetric and symmetric stretch to 3004 and 2987 cm−1 (sp3 to sp2 hybridization), splitting of C–H symmetric bend previously at 1373 cm−1 to 1381 and 1361 cm−1, splitting of C–O stretch previously at 1083 cm−1 to 1080 and 1126 cm−1 and appearance of CC stretch (due to sp2 C–H group) at 954 cm−1. All of these changes are labelled in Fig. 6 and highlighted in Table 3 as well.
O ester carbonyl stretch at 1747 cm−1, C–H asymmetric and symmetric bend at 1452 and 1373 cm−1, C–O stretch through 1263 to 1043 cm−1, C–C stretch at 867 cm−1 and C–H rocking at 754 and 700 cm−1. After degradation, all of the PLA signature peaks are retained, however, with following changes: disappearance of –OH group peaks, appearance of a new –OH stretch peak at 3741 cm−1 (only for PLA-45), shifting of C–H asymmetric and symmetric stretch to 3004 and 2987 cm−1 (sp3 to sp2 hybridization), splitting of C–H symmetric bend previously at 1373 cm−1 to 1381 and 1361 cm−1, splitting of C–O stretch previously at 1083 cm−1 to 1080 and 1126 cm−1 and appearance of CC stretch (due to sp2 C–H group) at 954 cm−1. All of these changes are labelled in Fig. 6 and highlighted in Table 3 as well.
 | ||
| Fig. 6 FTIR graphs of PLA before and after degradation of 30 and 45 days. | ||
| PLA-0 | Bond | Vibration | PLA-30 | PLA-45 |
|---|---|---|---|---|
| 3874 | –OH group (hydroxyl and water) | Stretch | — | — |
| 3770 | –OH group (hydroxyl and water) | Stretch | — | — |
| — | –OH group | Stretch | — | 3741 |
| 3691 | –OH group (hydroxyl and water) | Stretch | — | — |
| 3655 | –OH group (hydroxyl and water) | Stretch | — | — |
| 2947 | sp3 C–H | Asym. Stretch | 3004 | 3005 |
| 2899 | sp3 C–H | Sym. stretch | 2987 | 2987 |
| 1747 | CO ester carbonyl |
Stretch | 1749 | 1747 |
| 1452 | C–H deformation | Asym. bend | 1452 | 1452 |
| 1373 | C–H deformation | Sym. bend | 1381 | 1381 |
| — | C–H deformation | Bend | 1361 | 1361 |
| 1263 | C–O | Stretch | 1267 | 1267 |
| 1184 | C–O | Stretch | 1180 | 1182 |
| — | C–O | Stretch | 1126 | 1128 |
| 1083 | C–O | Stretch | 1082 | 1082 |
| 1043 | C–O | Stretch | 1043 | 1043 |
| — | CC |
Stretch | 954 | 954 |
| 867 | C–C | Stretch | 867 | 867 |
| 754 | C–H | Rocking | 754 | 754 |
| 700 | C–H | Rocking | 704 | 702 |
The disappearance of –OH group peaks is an indication that the exposure to sun's UV rays tends to evaporate the moisture and/or water molecules from the PLA. As the moisture and/or water molecules disappear, the extent of UV and heat becomes severe for PLA. A further exposure will start changing the structure of PLA by photo degradation mechanism. The changes that are observed from FTIR confirms the claim that the deterioration of tensile strength of PLA after exposure is due to some structural changes in the material. It is previously elaborated by few studies1,12,61,93 that when exposed to UV rays, the bio-degradable polymers like PLA, PHBV, etc. degrade by Norrish reaction. The bio-degradable polymers can undergo degradation either by Norrish Type I or Type II or both. The Norrish Type I reaction involves photo chemical cleavage or homolysis of aldehydes and ketones into 2 free radical intermediates (α-scission). The carbonyl group present in the structure accepts a photon and is excited to a photo chemical singlet state.98,99 While, the Norrish Type II reaction involves photo chemical intra-molecular abstraction of a γ-hydrogen (CH3) by the excited carbonyl compound from Type I reaction to produce a 1,4-biradical as a primary photoproduct.100,101 Taking this into account, a probable degradation mechanism for PLA under present study is suggested on the basis of FTIR findings. The suggested mechanism is illustrated in Fig. 7.
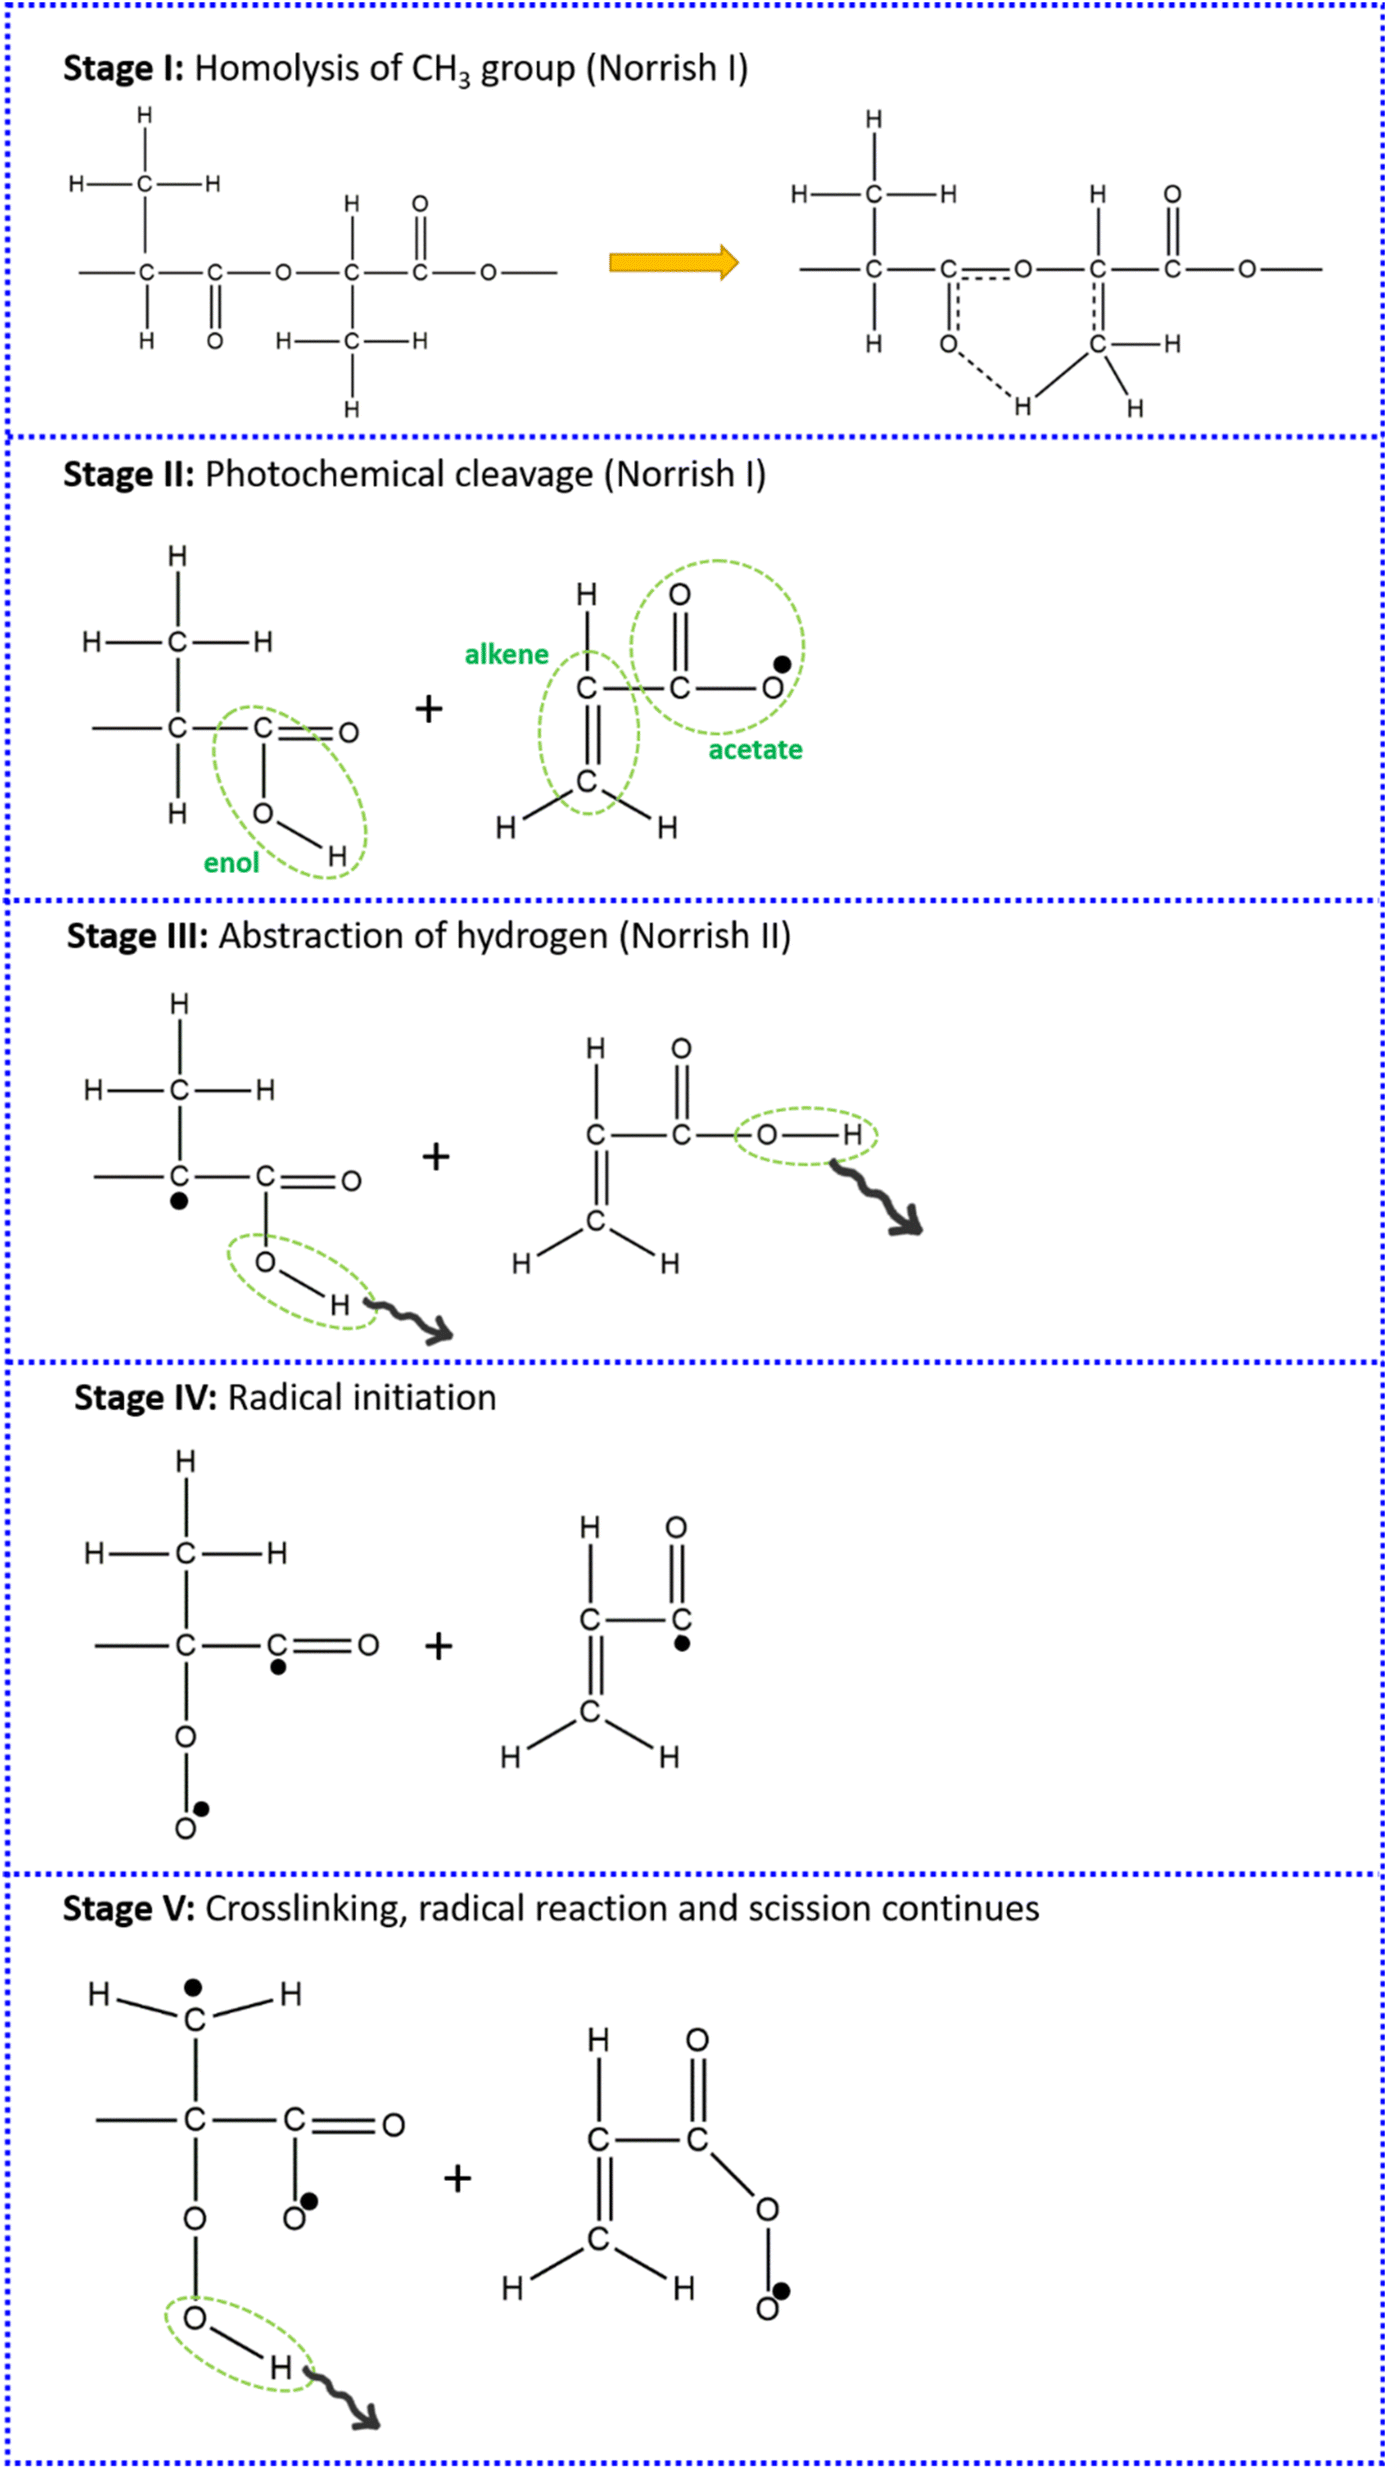 | ||
| Fig. 7 Suggested PLA degradation mechanism under present study. | ||
It is speculated here that prior to Norrish reaction, the degradation of PLA molecules is initiated by homolysis of CH3 group. Here, the bonding changes as shown in Fig. 7 stage I, wherein one of the H atom tries to bond with the O atom of the branching CO unit. To accommodate the O–H bond, the branching CO unit will become C–O. A further exposure to UV will result in photochemical cleavage at the backbone O–C bond and the H atom in the CH3 group, as shown in Fig. 7 stage II. The PLA macromolecule is now split into two smaller amorphous segments. Such scission (as per Norrish Type I reaction) will result in one of the segment to end with an enol group, wherein the C–O in the PLA backbone becomes CO to form a closed end. The other segment with a split CH3 group will resemble a mono-substituted alkene, albeit with an acetate group at the end. This will result in the formation of one O radical (O˙). A further exposure results in two phenomenon acting simultaneously, as represented in Fig. 7 stage III. The O radical (O˙) formed will lead to an abstraction of H atom from the vicinity leaving behind a C radical (C˙). At the same time, the UV will result in photolysis of hydro-peroxide (OH) moieties, generating more C radicals (C˙, shown 2 in present schematic for representation) analogous to Norrish Type II reaction. The C radicals (C˙), thus, generated will react with atmospheric oxygen to form peroxide radical (O–O˙). These peroxide radicals will further cause abstraction of H atom from the vicinity which can lead to homolysis of another CH3 group. This stage is called as radical initiation as shown in Fig. 7 stage IV, wherein the fulfilment of one radical will lead to the formation of another type of radical. This process of radical formation, crosslinking and scission will continue with exposure and break down the PLA chain into smaller amorphous segments. The changes in the FTIR of PLA-30 and PLA-45 samples also confirm this.
As explained above and as illustrated in Fig. 7, the photochemical cleavage (Norrish Type I) and abstraction of H atom (Norrish Type II) at two different stages of PLA degradation results in sp3 to sp2 hybridization of C–H bonds, thus, reducing the number of CH3 groups in the PLA structure. This can be confirmed from the upward shift of asymmetric C–H stretch peak previously at 2947 cm−1. The shift to a higher value in both PLA-30 and PLA-45 samples represent an increase in the concentration of sp2 CH group. Also, the disappearance of –OH group peaks explain the heating effect of the sun's rays that evaporates the moisture and/or water molecules from the PLA structure. Furthermore, there are hydro-peroxide (OH) moieties forming at different stages of PLA degradation (as represented in Fig. 7). It is well known that for different moieties of same structure, the IR response will be different. Thus, the appearance of a peak at 3741 cm−1 can be credited to the stretching vibrations of –OH group that are different to moisture and/or water molecules and this peak has been assigned to the formed hydro-peroxide (OH) moieties dangling at the chain end of the amorphous segments. As the intensity of degradation is more for PLA-45 sample as compared to PLA-30, the concentration of hydro-peroxide (OH) moieties should be more. However, due to UV exposure, the radical initiation process is dominating and the photolysis of hydro-peroxide (OH) moieties is unavoidable. Thus, this peak is barely visible in PLA-30 sample and is very small for PLA-45 sample as well. It is explained above how the reflections of C–H stretch vibration changes as it undergoes sp3 to sp2 hybridization. This hybridization is by the virtue of both homolysis of CH3 group as well as the process of photochemical cleavage at the backbone O–C bond. The simultaneous action of these two process are creating two C atoms with one dangling bond each that are already sharing a bond. Thus, their immediate affinity towards each other results in the formation of CC giving an amorphous segment with mono-substituted alkene like structure, albeit having an acetate group at the mono-substitution site. Even with further abstraction of H atoms and radical initiation, the CC still remains in the degraded PLA structure and thus, a peak appears at 954 cm−1 for CC stretch due to sp2 CH group.
In addition to these changes, there are two peaks that are splitting in two different ways. The C–H symmetric bend peak at 1373 cm−1 splits into two smaller peaks at 1381 and 1361 cm−1. While the C–O stretch peak at 1083 cm−1 develops a small shoulder at 1126 cm−1. This splitting of peaks for both PLA-30 and PLA-45 is similar with a marginal difference in the intensities of the parent peak. The intensity both the peaks reduces for PLA-45 sample. This behaviour can be credited to two phenomenon acting at once. The splitting of C–H bend peak can be correlated to sp3 to sp3 hybridization of CH groups. From Fig. 7 it is clear that as the degradation of PLA continues, the more number of CH2 groups are forming. The reflections of C–H bond from CH2 group is slightly different than that of CH3 group, as evident from upward shift of C–H stretch peak to 3004 cm−1. Though the C–H deformation peaks essentially lie in the same IR wavenumber region, the nature of their reflections is different and that can be the reason for split peak at 1381 and 1361 cm−1. At the same time, as CH3 groups are becoming CH2 groups due to photochemical cleavage and abstraction of H atoms, there will come a point in PLA macromolecule where the abstraction of H atom will now take place from a CH2 group in vicinity. This H atom, thus, abstracted will form a hydro-peroxide (OH) and its photolysis will remove H atom completely from the PLA structure. This means that eventually the number of C–H bonds are reducing from the PLA structure, thereby indicated by a reducing peak intensity for PLA-45 sample. Looking at the formation of a small shoulder for C–O stretch peak at 1126 cm−1, it can be explained from the formation of O radicals (O˙) at different stages of degradation. The acetate end group forming after photochemical cleavage has O radical (O˙) bonded to the backbone C atom. The reflection of C–O˙ is different than the reflection of C–O bonding. Thus, as the nature of moieties changes, the IR response will be different thereby reflecting a small shoulder for a relatively sharp peak.
Apart from the changes observed in the PLA structure after natural degradation, the concentration of different bonds from FTIR was also evaluated to have a quantitative approach towards the proposed degradation mechanism. The concentration was calculated using the Beer–Lambert equation as follows:
| A = εbC | (3) |
The concentration of various of functional group bonds as calculated using the above equation are shown in Table 4.
| Functional group bond | Concentration in mol L−1 | ||
|---|---|---|---|
| PLA-0 | PLA-30 | PLA-45 | |
| C–H | 1.07 | 0.90 | 0.74 |
| C–O | 2.65 | 3.11 | 3.64 |
| CO |
3.69 | 3.61 | 3.64 |
| CC |
— | 0.08 | 0.10 |
It is evident from Table 4 that the molar concentration values support the FTIR findings. As explained above, the continuous photochemical cleavage and abstraction of H atom in PLA structure will reduce the functional group CH3 by hybridizing into CH2 and finally removal of H atom in the form of hydro-peroxide (OH). This phenomenon is back-up by concentration values as well. The molar concentration of C–H bond is 1.07 mol L−1 for PLA-0 sample. After a degradation time of 30 days, the C–H bond concentration reduces to 0.90 mol L−1 and for PLA-45 samples it becomes 0.74 mol L−1. This supports the claim that as PLA degrades in the presence of natural UV rays, the multiple phenomenon acting together leads to a cumulative reduction of C–H bond concentration. Similarly, it is explained above that with the formation of O radicals (O˙), a shoulder peak appears for C–O reflection as a result of two different moieties of same structure. Similar phenomenon can be deduced from Table 4, wherein the molar concentration of C–O in case of PLA-0 samples is 2.65 mol L−1. As PLA degrades, the formation of different a C–O moiety will reflect in terms of increased molar concentration. As the degradation time increases to 45 days, the molar concentration also increases to 3.64 mol L−1.
Looking at the molar concentration of CO ester carbonyl, it is clear that this bond remains fairly unaffected by the PLA degradation mechanism. It is reported by many that for bio-degradable polymers like poly(L-lactide) (PLLA),9,27 poly(ε-caprolactone) (PCL),9 poly(3-hydroxybutyrate) (PHB),93 poly(3-hydroxybutyrate-co-3-hydroxyvalerate) (PHBV),1 the hydrolysis mechanism is dominating over photochemical and scission reactions. As the hydrolysis of polymer structure progresses, it tends to reduce the CO ester groups by photo-oxidation. Thus, these studies report a reduction in the molar concentration of CO bond by the virtue of hydrolysis of ester group.1,14 In addition,1 reports that for less exposure time, the hydrolysis of PHBV CO ester group is dominant, while as the exposure time increases, the scission reactions prevailed over hydrolysis. In present study on PLA, it is evident that the molar concentration of CO ester carbonyl group does not change. Thus, it is safe to say here that hydrolysis degradation mechanism is more detrimental for bio-degradable polymers, however, the PLA under present study does not undergo hydrolysis reaction during degradation. This is supported by the molar concentration values of CO band that remains same at ∼3.6 mol L−1. It is evident from the explanation of FTIR findings above that CC peak is not naturally present in the PLA structure, but it appears during the photochemical cleavage stage of degradation. The further scission and cross-linking does not affect the CC in any aspect, however, as the degradation continues, the concentration of CC increases from 0.08 to 0.10 mol L−1. The mechanism illustrated in Fig. 7 demonstrates a segment of PLA long chain. When the PLA structure is exposed to UV rays, the initiation stage of homolysis will occur simultaneously at multiple CH3 groups. This will lead to photochemical cleavage at various points throughout the PLA backbone. The more number of smaller segments form, the formation of CC end will also increase, as seen from Table 4 also. The extent of degradation on PLA samples can also be judged by visual inspection. Fig. 8 shows an example of PLA surface before and after degradation for G60 sample.
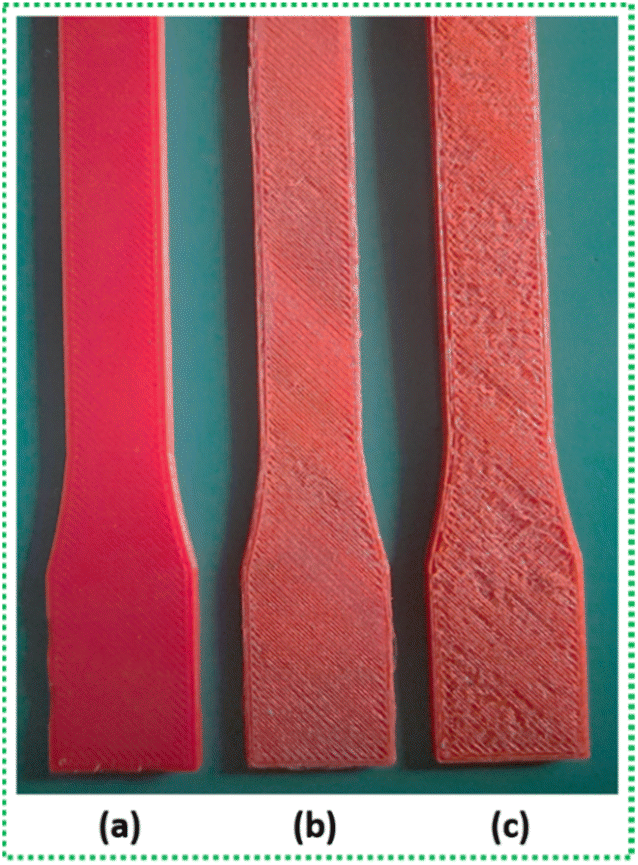 | ||
| Fig. 8 Sample PLA surface for (a) PLA-0, (b) PLA-30 and (c) PLA-45. | ||
It is evident that exposure to atmospheric conditions will essentially attack the sample surface first. Though UV rays are able to penetrate inside the material, the effects of moisture and/or water is strictly limited to surface layer during an initial stage of degradation. Once the surface layer deteriorates enough, the atmospheric conditions now penetrates to the material bulk, thereby, starting degradation of the inside layer of material as well. The simultaneous action of degradation on different layers further weakens the material. It is visible from Fig. 8(c) that the surface of sample exposed for 45 days is more damaged than PLA-30 sample. A similar trend between the exposure duration and sample surface is exhibited by all the PLA samples with different in-fill patterns and varying in-fill density. Hence, it can be said here that longer the exposure time, more damage will be experienced by the material. Thus, a reduction in the tensile strength of PLA-30 and PLA-45 samples, irrespective of in-fill pattern and density, can be justified from the suggested degradation mechanism.
3.3 Molecular weight analysis and DSC thermal properties
The proposed mechanism is also supported by determining the molecular weight of PLA before and after degradation using End Group Analysis technique. The molecular weight, summarized in Table 5, represents a declining trend with degradation time and supports the findings from FTIR as predicted. This confirms the fact that as a result of degradation, the long polymer chains are breaking down into smaller amorphous segments and this adversely affects the mechanical properties. This is also confirmed from the increasing molarity values as determined from End Group Analysis. As chain scission occurs, more open ends are produced. There open ends, as depicted in Fig. 7, are essentially O radicals and due to the affinity of NaOH to them, the volume of NaOH consumed by the solution of ethyl acetate and PLA sample during titration also increases. Thus, with the support of the molar concentration values from FTIR and the molecular weight from End Group Analysis, the probable degradation mechanism for PLA exposed to natural atmosphere (Fig. 7) is validated.| Sample | Molecular weight (g mol−1) | % Crystallinity | Glass transition temperature, Tg (°C) | Melting temperature, Tm (°C) | Melt enthalpy (J g−1) |
|---|---|---|---|---|---|
| PLA-0 | 2.5 × 10⁴ | 5.91 | 67.3 | 159.4 | −3.38 |
| PLA-30 | 1.5 × 10⁴ | 6.19 | 66.2 | 158.6 | −3.07 |
| PLA-45 | 1.3 × 10⁴ | 6.34 | 61.6 | 155.8 | −1.00 |
However, it was also observed that the tensile modulus of PLA is increasing after degradation. This can be correlated with the crystallinity of PLA polymer before and after degradation as determined from DSC and summarized in Table 5. Furthermore, the glass transition temperature (Tg), melting temperature (Tm) and melt enthalpy of PLA before and after degradation is also reported in Table 5. It is concluded from FTIR analysis that even though PLA under present study does not undergo specific reactions reported by others14,45,49,54,61 like hydrolysis of ester bond or abstraction of H atom from CH3 group only, the PLA is degrading into smaller amorphous segments with open chain ends, as confirmed from molarity as well. Few studies report1,12,26 that the cross-linking of these small amorphous segments formed by chain scission leads to an increment of crystallinity of the polymer. It can be seen from Table 5 that for PLA exposed to natural atmosphere under present study also reflects increased crystallinity, albeit marginally.
Similarly, there is a reduction in the Tg and Tm temperatures of PLA after degradation owing to chain scission. These changes in the DSC crystallinity, temperatures and melt enthalpy can be correlated with the suggested degradation mechanism in the same manner as reported by others. During degradation, the photochemical cleavage of PLA macromolecule into two smaller segments takes place at a very early stage, as depicted in Fig. 7. The enol and acetate functional groups at the chain ends of individual segments further participate in radical initiation and scission reactions. These smaller segments tend to be more mobile and will cross-link further to stabilize the degraded structure. Furthermore, as the smaller segments are amorphous in nature, their subsequent cross-linking increases the crystallinity of the material and the reflects as a marginal increment in crystallinity. It is also well known that as the polymer chain structure degrades and forms new chain open ends, the energy needed to melt the structure reduces and therefore, the degraded material melts at a lower temperature. This can be supported by reduced Tg and Tm temperatures as well the decreasing melt enthalpy values. The successive cross-link, thus, formed will enhance the progression of load through the material for a limiting amount, thereby increasing the tensile modulus of PLA to some extent, as clear from Fig. 4.92,93 However, the PLA chain suffers scission at different stages of degradation (Fig. 7) which is more detrimental, thereby reducing the tensile strength (Fig. 4) and melt enthalpy (Table 5).
4. Conclusion
The present study explores the effect of atmospheric conditions on the degradation behaviour of poly(lactic acid) (PLA). It can be concluded here that:• When compared to PLA degraded by accelerated weathering test, the degradation mechanism for PLA exposed to natural atmosphere changes. This can be attributed to the fact that when PLA is exposed to natural UV rays from sunlight, the homolysis of CH3 groups was found to be dominating. This caused photochemical cleavage at various points through the PLA structure, which breaks down into number of smaller segments. It is speculated that with further exposure, the cleavage process leads to the formation of enol and acetate group chain ends. These open ends will then initiate radicalization with atmospheric oxygen, which in turn will exit the PLA structure in the form of hydro-peroxide moieties, eventually creating more open ends. Once this process occurs on the sample surface and weakens it; the effects of UV rays, moisture and/or water will now penetrate to the under-layers, thereby, starting degradation of the inside layer of PLA as well.
• A drop in the tensile properties noted after atmospheric degradation of PLA can be credited to the simultaneous action of degradation on different layers, which further weakens the material. When commenting on the effect of in-fill volume and density, it can be established from the extensive details furnished above, that the tensile strength of PLA depends more on the in-fill pattern, while the tensile modulus is greatly influenced by the in-fill density. However, any extent of degradation weakens the PLA material, thereby reducing the tensile properties as clearly indicated.
Thus, present study concludes that irrespective of the in-fill pattern and density, the degradation of PLA structure will inherently degrade its properties. One can explore different techniques to improve the stability of PLA structure under atmospheric degradation, thereby, leading to a high strength polymer. Though the mechanical properties of PLA will reduce after degradation, one can also explore the chemistry of different PLA structures (like PLLA, PDLA and PDLLA) and their response to the degradation conditions.
Conflicts of interest
There are no conflicts to declare.References
- L. Wei and A. G. McDonald, Accelerated weathering studies on the bioplastic, poly(3-hydroxybutyrate-co-3-hydroxyvalerate), Polym. Degrad. Stab., 2016, 126, 93–100 CrossRef CAS.
- J. Li, J. Hunt, S. Gong and Z. Cai, Wood-based tri-axial sandwich composite materials: Design, fabrication, testing, modeling and application, CAMX 2014 - Compos. Adv. Mater. Expo Comb. Strength Unsurpassed Innov., 2014 Search PubMed.
- J. Li, J. F. Hunt, S. Gong and Z. Cai, Simplified analytical model and balanced design approach for light-weight wood-based structural panel in bending, Compos. Struct., 2016, 136, 16–24 CrossRef.
- J. Li, J. F. Hunt, S. Gong and Z. Cai, High Strength Wood-based Sandwich Panels Reinforced with Fiberglass and Foam, BioResources, 2014, 9, 1898–1913 CAS.
- J. Li, J. F. Hunt, Z. Cai and X. Zhou, Bending analyses for 3D engineered structural panels made from laminated paper and carbon fabric, Composites, Part B, 2013, 53, 17–24 CrossRef CAS.
- J. Li, J. F. Hunt, S. Gong and Z. Cai, Testing and Evaluation of a Slot and Tab Construction Technique for Light-Weight Wood-Fiber-Based Structural Panels Under Bending, J. Test. Eval., 2016, 44, 20140270 Search PubMed.
- J. M. Luengo, B. García, A. Sandoval, G. Naharro and E. R. Olivera, Bioplastics from microorganisms, Curr. Opin. Microbiol., 2003, 6, 251–260 CrossRef CAS PubMed.
- X. Ma, F. Zhang and L. Wei, Effect of wood charcoal contents on the adsorption property, structure, and morphology of mesoporous activated carbon fibers derived from wood liquefaction process, J. Mater. Sci., 2015, 50, 1908–1914 CrossRef CAS.
- H. Tsuji, Y. Echizen and Y. Nishimura, Photodegradation of biodegradable polyesters: A comprehensive study on poly(l-lactide) and poly(ε-caprolactone), Polym. Degrad. Stab., 2006, 91, 1128–1137 CrossRef CAS.
- K. Song, Q. Wu, Z. Zhang, S. Ren, T. Lei and K. M. Dooley, et al., Fabricating electrospun nanofibers with antimicrobial capability: A facile route to recycle biomass tar, Fuel, 2015, 150, 123–130 CrossRef CAS.
- Z. A. Raza, S. Abid and I. Banat, Polyhydroxyalkanoates: Characteristics, production, recent developments and applications, Int. Biodeterior. Biodegrad., 2018, 126, 45–56 CrossRef CAS.
- I. Moura, G. Botelho and A. V. Machado, Characterization of EVA/PLA Blends When Exposed to Different Environments, J. Polym. Environ., 2014, 22, 148–157 CrossRef CAS.
- R. E. Drumright, P. R. Gruber and D. E. Henton, Polylactic Acid Technology, Adv. Mater., 2000, 12, 1841–1846 CrossRef CAS.
- A. Copinet, C. Bertrand, S. Govindin, V. Coma and Y. Couturier, Effects of ultraviolet light (315 nm), temperature and relative humidity on the degradation of polylactic acid plastic films, Chemosphere, 2004, 55, 763–773 CrossRef CAS PubMed.
- M. E. C. Alfaro, S. L. Stares, G. M. d. O. Barra and D. Hotza, Estimation of shelf life of 3D-printed PLA scaffolds by accelerated weathering, Mater. Today Commun., 2022, 32, 104140 CrossRef CAS.
- R. Mahmudzade, P. Nikaeen, W. Chirdon, A. Khattab and D. Depan, Photodegradation mechanisms and physico-chemical properties of EPON-IPD epoxy-based polymers, React. Funct. Polym., 2022, 178, 105351 CrossRef CAS.
- K. GTh, Impact of food processing on the environment—an overview, LWT--Food Sci. Technol., 1995, 28, 547–552 CrossRef.
- S. Mishra, L. N. Fukey, L. N. Fukey and V. Wankhar. Single Use Plastic packaging: the online food and beverage industry's take on it, SPAST Abstr., 2021, cited 2022 Sep 20, available from https://spast.org/techrep/article/view/1902 Search PubMed.
- C. Vogel, E. Wessel and H. W. Siesler, FT-IR Imaging Spectroscopy of Phase Separation in Blends of Poly(3-hydroxybutyrate) with Poly(l-lactic acid) and Poly(ε-caprolactone), Biomacromolecules, 2008, 9, 523–527 CrossRef CAS PubMed.
- H. Lu, S. G. Kazarian and H. Sato, Simultaneous Visualization of Phase Separation and Crystallization in PHB/PLLA Blends with In Situ ATR-FTIR Spectroscopic Imaging, Macromolecules, 2020, 53, 9074–9085 CrossRef CAS.
- What's the difference between Biobased & Biodegradable Plastics, HEXPOL TPE, cited 2022 Dec 17, available from https://www.hexpol.com/tpe/resources/sustainability-insights/biobased-vs-biodegradable/ Search PubMed.
- P. Tyagi, S. Agate, O. D. Velev, L. Lucia and L. Pal, A Critical Review of the Performance and Soil Biodegradability Profiles of Biobased Natural and Chemically Synthesized Polymers in Industrial Applications, Environ. Sci. Technol., 2022, 56, 2071–2095 CrossRef CAS PubMed.
- M. Vukoje, R. Kulčar, K. Ivanda, J. Bota and T. Cigula, Improvement in Thermochromic Offset Print UV Stability by Applying PCL Nanocomposite Coatings, Polymers, 2022, 14, 1484 CrossRef CAS PubMed.
- A. Pellis, M. Malinconico, A. Guarneri and L. Gardossi, Renewable polymers and plastics: Performance beyond the green, New Biotechnol., 2021, 60, 146–158 CrossRef CAS PubMed.
- G. E. Luckachan and C. K. S. Pillai, Biodegradable Polymers- A Review on Recent Trends and Emerging Perspectives, J. Polym. Environ., 2011, 19, 637–676 CrossRef CAS.
- A. Araújo, G. Botelho, M. Silva and A. Machado, UV Stability of Poly(Lactic Acid) Nanocomposites, J. Mater. Sci. Eng. B, 2013, 3, 75–83 Search PubMed.
- H. Tsuji, Y. Echizen and Y. Nishimura, Enzymatic Degradation of Poly(l-Lactic Acid): Effects of UV Irradiation, J. Polym. Environ., 2006, 14, 239 CrossRef CAS.
- N. Pathan, Handbook of Biodegradable Polymers, cited 2022 Sep 20, available from https://www.academia.edu/4243818/Handbook_of_Biodegradable_Polymers Search PubMed.
- R. G. Sinclair, The Case for Polylactic Acid as a Commodity Packaging Plastic, J. Macromol. Sci., Part A: Pure Appl.Chem., 1996, 33, 585–597 CrossRef.
- M. Nofar, R. Salehiyan and S. Sinha Ray, Rheology of poly(lactic acid)-based systems, Polym. Rev., 2019, 59, 465–509 CrossRef CAS.
- M. Wang, Y. Wu, Y. D. Li and J. B. Zeng, Progress in Toughening Poly(Lactic Acid) with Renewable Polymers, Polym. Rev., 2017, 57, 557–593 CrossRef CAS.
- C. Shuai, B. Peng, P. Feng, L. Yu, R. Lai and A. Min, In situ synthesis of hydroxyapatite nanorods on graphene oxide nanosheets and their reinforcement in biopolymer scaffold, J. Adv. Res., 2022, 35, 13–24 CrossRef CAS PubMed.
- M. H. Hsueh, C. J. Lai, C. F. Chung, S. H. Wang, W. C. Huang and C. Y. Pan, et al., Effect of Printing Parameters on the Tensile Properties of 3D-Printed Polylactic Acid (PLA) Based on Fused Deposition Modeling, Polymers, 2021, 13, 2387 CrossRef CAS PubMed.
- Y. Sun, W. Tian, T. Zhang, P. Chen and M. Li, Strength and toughness enhancement in 3d printing via bioinspired tool path, Mater. Des., 2020, 185, 108239 CrossRef.
- H. K. Dave, A. R. Prajapati, S. R. Rajpurohit, N. H. Patadiya and H. K. Raval, Open hole tensile testing of 3D printed parts using in-house fabricated PLA filament, Rapid Prototyp. J., 2019, 26, 21–31 CrossRef.
- W. Prasong, P. Muanchan, A. Ishigami, S. Thumsorn, T. Kurose and H. Ito, Properties of 3D Printable Poly(lactic acid)/Poly(butylene adipate-co-terephthalate) Blends and Nano Talc Composites, J. Nanomater., 2020, 2020, 1–16 CrossRef.
- H. Gonabadi, A. Yadav and S. J. Bull, The effect of processing parameters on the mechanical characteristics of PLA produced by a 3D FFF printer, Int. J. Adv. Manuf. Technol., 2020, 111, 695–709 CrossRef.
- X. Zhang, M. A. Geven, D. W. Grijpma, J. E. Gautrot and T. Peijs, Polymer-polymer composites for the design of strong and tough degradable biomaterials, Mater. Today Commun., 2016, 8, 53–63 CrossRef CAS.
- F. Lupone, E. Padovano, A. Veca, L. Franceschetti and C. Badini, Innovative processing route combining fused deposition modelling and laser writing for the manufacturing of multifunctional polyamide/carbon fiber composites, Mater. Des., 2020, 193, 108869 CrossRef CAS.
- M. C. Vu, T. H. Jeong, J. B. Kim, W. K. Choi, D. H. Kim and S. R. Kim, 3D printing of copper particles and poly(methyl methacrylate) beads containing poly(lactic acid) composites for enhancing thermomechanical properties, J. Appl. Polym. Sci., 2021, 138, 49776 CrossRef CAS.
- M. J. Martín, J. A. Auñón and F. Martín, Influence of Infill Pattern on Mechanical Behavior of Polymeric and Composites Specimens Manufactured Using Fused Filament Fabrication Technology, Polymers, 2021, 13, 2934 CrossRef PubMed.
- S. Sinha Ray, Polylactide-Based Bionanocomposites: A Promising Class of Hybrid Materials, Acc. Chem. Res., 2012, 45, 1710–1720 CrossRef CAS PubMed.
- R. Auras, B. Harte and S. Selke, An Overview of Polylactides as Packaging Materials, Macromol. Biosci., 2004, 4, 835 CrossRef CAS PubMed.
- R. JanF. Degradation of polymers initiated by radicals formed from photolysis of different compounds, in Polymer Photodegradation: Mechanisms and experimental methods, ed. R. JanF, Springer Netherlands, Dordrecht, 1995, p. 377–398, cited 2022 Sep 21, available from DOI:10.1007/978-94-011-1274-1_6.
- S. Belbachir, F. Zaïri, G. Ayoub, U. Maschke, M. Naït-Abdelaziz and J. M. Gloaguen, et al., Modelling of photodegradation effect on elastic–viscoplastic behaviour of amorphous polylactic acid films, J. Mech. Phys. Solids, 2010, 58, 241–255 CrossRef CAS.
- S. Araujo, C. Sainlaud, N. Delpouve, E. Richaud, L. Delbreilh and E. Dargent, Segmental Relaxation Dynamics in Amorphous Polylactide Exposed to UV Light, Macromol. Chem. Phys., 2022, 223, 2200085 CrossRef CAS.
- N. Yasuda, Y. Wang, T. Tsukegi, Y. Shirai and H. Nishida, Quantitative evaluation of photodegradation and racemization of poly(l-lactic acid) under UV-C irradiation, Polym. Degrad. Stab., 2010, 95, 1238–1243 CrossRef CAS.
- S. Bocchini, K. Fukushima, A. D. Blasio, A. Fina, A. Frache and F. Geobaldo, Polylactic Acid and Polylactic Acid-Based Nanocomposite Photooxidation, Biomacromolecules, 2010, 11, 2919–2926 CrossRef CAS PubMed.
- S. Lv, X. Liu, J. Gu, Y. Jiang, H. Tan and Y. Zhang, Effect of glycerol introduced into PLA based composites on the UV weathering behavior, Constr. Build. Mater., 2017, 144, 525–531 CrossRef CAS.
- M. E. González-López, A. S. Martín del Campo, J. R. Robledo-Ortíz, M. Arellano and A. A. Pérez-Fonseca, Accelerated weathering of poly(lactic acid) and its biocomposites: A review, Polym. Degrad. Stab., 2020, 179, 109290 CrossRef.
- M. S. Reeve, S. P. McCarthy, M. J. Downey and R. A. Gross, Polylactide stereochemistry: effect on enzymic degradability, Macromolecules, 1994, 27, 825–831 CrossRef CAS.
- P. K. Samantaray, A. Little, A. M. Wemyss, E. Iacovidou and C. Wan, Design and Control of Compostability in Synthetic Biopolyesters, ACS Sustainable Chem. Eng., 2021, 9, 9151–9164 CrossRef CAS.
- M. Atreya, K. Dikshit, G. Marinick, J. Nielson, C. Bruns and G. L. Whiting, Poly(lactic acid)-Based Ink for Biodegradable Printed Electronics With Conductivity Enhanced through Solvent Aging, ACS Appl. Mater. Interfaces, 2020, 12, 23494–23501 CrossRef CAS PubMed.
- M. Vert, J. Mauduit and S. Li, Biodegradation of PLA/GA polymers: increasing complexity, Biomaterials, 1994, 15, 1209–1213 CrossRef CAS PubMed.
- L. Gritsch and A. R. Boccaccini, Bioactive and Biodegradable Polymer-Based Composites, in Encyclopedia of Materials: Technical Ceramics and Glasses, ed. M. Pomeroy, Elsevier, Oxford, 2021, pp. 674–700, cited 2022 Sep 21, available from https://www.sciencedirect.com/science/article/pii/B9780128035818121204 Search PubMed.
- J. Svatík, P. Lepcio, F. Ondreáš, K. Zárybnická, M. Zbončák and P. Menčík, et al., PLA toughening via bamboo-inspired 3D printed structural design, Polym. Test., 2021, 104, 107405 CrossRef.
- C. Shuai, W. Yang, P. Feng, S. Peng and H. Pan, Accelerated degradation of HAP/PLLA bone scaffold by PGA blending facilitates bioactivity and osteoconductivity, Bioact. Mater., 2021, 6, 490–502 CrossRef CAS PubMed.
- J. L. Gardette, P. O. Bussière and S. Therias, Recent progress in the field of polymer photodegradation, AIP Conf. Proc., 2018, 1981, 020051 CrossRef.
- K. Encalada, M. B. Aldás, E. Proaño and V. Valle, An overview of starch-based biopolymers and their biodegradability, Revista Ciencia e Ingeniería, 2018, 39, 245–258 Search PubMed.
- A. Gamage, A. Liyanapathiranage, A. Manamperi, C. Gunathilake, S. Mani and O. Merah, et al., Applications of Starch Biopolymers for a Sustainable Modern Agriculture, Sustainability, 2022, 14, 6085 CrossRef CAS.
- A. Copinet, C. Bertrand, A. Longieras, V. Coma and Y. Couturier, Photodegradation and Biodegradation Study of a Starch and Poly(Lactic Acid) Coextruded Material, J. Polym. Environ., 2003, 11, 169–179 CrossRef CAS.
- G. Botelho, M. M. Silva, A. M. Gonçalves, V. Sencadas, J. Serrado-Nunes and S. Lanceros-Mendez, Performance of electroactive poly(vinylidene fluoride) against UV radiation, Polym. Test., 2008, 27, 818–822 CrossRef CAS.
- 7 - UV Degradation & Stabilization of Polymers & Rubbers, in Handbook of UV Degradation and Stabilization, ed. G. Wypych, ChemTec Publishing, 3rd edn, 2020, pp. 187–321, cited 2022 Sep 21, available from https://www.sciencedirect.com/science/article/pii/B9781927885574500103 Search PubMed.
- Aladin. June Weather forecast - Rainy season forecast - Aurangabad, India, Weather Atlas, cited 2022 Sep 21, available from https://www.weather-atlas.com/en/india/aurangabad-weather-june Search PubMed.
- K. Fukushima, D. Tabuani, M. Dottori, I. Armentano, J. M. Kenny and G. Camino, Effect of temperature and nanoparticle type on hydrolytic degradation of poly(lactic acid) nanocomposites, Polym. Degrad. Stab., 2011, 96, 2120–2129 CrossRef CAS.
- M. Rismalia, S. C. Hidajat, I. G. R. Permana, B. Hadisujoto, M. Muslimin and F. Triawan, Infill pattern and density effects on the tensile properties of 3D printed PLA material, J. Phys.: Conf. Ser., 2019, 1402, 044041 CrossRef CAS.
- X. Zhou, S. J. Hsieh and C. C. Ting, Modelling and estimation of tensile behaviour of polylactic acid parts manufactured by fused deposition modelling using finite element analysis and knowledge-based library, Virtual Phys. Prototyping, 2018, 13, 177–190 CrossRef.
- M. Fernandez-Vicente, W. Calle, S. Ferrandiz and A. Conejero, Effect of Infill Parameters on Tensile Mechanical Behavior in Desktop 3D Printing, 3D Print. Addit. Manuf., 2016, 3, 183–192 CrossRef.
- J. Dobos, M. M. Hanon and I. Oldal, Effect of infill density and pattern on the specific load capacity of FDM 3D-printed PLA multi-layer sandwich, J. Polym. Eng., 2022, 42, 118–128 CrossRef.
- H. K. Dave, N. H. Patadiya, A. R. Prajapati and S. R. Rajpurohit, Effect of infill pattern and infill density at varying part orientation on tensile properties of fused deposition modeling-printed poly-lactic acid part, Proc. Inst. Mech. Eng., Part C, 2021, 235, 1811–1827 CrossRef CAS.
- R. Srinivasan, W. Ruban, A. Deepanraj, R. Bhuvanesh and T. Bhuvanesh, Effect on infill density on mechanical properties of PETG part fabricated by fused deposition modelling, Mater. Today: Proc., 2020, 27, 1838–1842 CAS.
- C. Lubombo and M. A. Huneault, Effect of infill patterns on the mechanical performance of lightweight 3D-printed cellular PLA parts, Mater. Today Commun., 2018, 17, 214–228 CrossRef CAS.
- A. Milovanović, A. Sedmak, A. Grbović, Z. Golubović, G. Mladenović and K. Čolić, et al., Comparative analysis of printing parameters effect on mechanical properties of natural PLA and advanced PLA-X material, Procedia Struct. Integr., 2020, 28, 1963–1968 CrossRef.
- M. R. Derise and A. Zulkharnain, Effect of infill pattern and density on tensile properties of 3d printed polylactic acid parts via fused deposition modeling (FDM), Int. J. Mech. Mechatron. Eng., 2020, 20, 54–63 Search PubMed.
- S. A. Khan, B. A. Siddiqui, M. Fahad and M. A. Khan, Evaluation of the Effect of Infill Pattern on Mechanical Strength of Additively Manufactured Specimen, Mater. Sci. Forum, 2017, 887, 128–132 Search PubMed.
- C. K. L. Alvarez, C. R. F. Lagos and M. Aizpun, Investigating the influence of infill percentage on the mechanical properties of fused deposition modelled ABS parts, Ing. Invest., 2016, 36, 110–116 CrossRef.
- M. M. Hanon, Y. Alshammas and L. Zsidai, Effect of print orientation and bronze existence on tribological and mechanical properties of 3D-printed bronze/PLA composite, Int. J. Adv. Manuf. Technol., 2020, 108, 553–570 CrossRef.
- Y. Y. Aw, C. K. Yeoh, M. A. Idris, P. L. Teh, K. A. Hamzah and S. A. Sazali, Effect of Printing Parameters on Tensile, Dynamic Mechanical, and Thermoelectric Properties of FDM 3D Printed CABS/ZnO Composites, Materials, 2018, 11, 466 CrossRef PubMed.
- M. Samykano, S. K. Selvamani, K. Kadirgama, W. K. Ngui, G. Kanagaraj and K. Sudhakar, Mechanical property of FDM printed ABS: influence of printing parameters, Int. J. Adv. Manuf. Technol., 2019, 102, 2779–2796 CrossRef.
- V. S. Jatti, S. V. Jatti, A. P. Patel and V. S. Jatti, A Study On Effect Of Fused Deposition Modeling Process Parameters On Mechanical Properties, Int. J. Sci. Technol. Res., 2019, 8, 5 Search PubMed.
- T. Yao, J. Ye, Z. Deng, K. Zhang, Y. Ma and H. Ouyang, Tensile failure strength and separation angle of FDM 3D printing PLA material: Experimental and theoretical analyses, Composites, Part B, 2020, 188, 107894 CrossRef CAS.
- T. Yao, K. Zhang, Z. Deng and J. Ye, A novel generalized stress invariant-based strength model for inter-layer failure of FFF 3D printing PLA material, Mater. Des., 2020, 193, 108799 CrossRef CAS.
- M. Vaezi and S. Yang, Extrusion-based additive manufacturing of PEEK for biomedical applications, Virtual Phys. Prototyping, 2015, 10, 123–135 CrossRef.
- S. Wang, Y. Ma, Z. Deng, S. Zhang and J. Cai, Effects of fused deposition modeling process parameters on tensile, dynamic mechanical properties of 3D printed polylactic acid materials, Polym. Test., 2020, 86, 106483 CrossRef CAS.
- B. Akhoundi and A. H. Behravesh, Effect of Filling Pattern on the Tensile and Flexural Mechanical Properties of FDM 3D Printed Products, Exp. Mech., 2019, 59, 883–897 CrossRef.
- M. T. Birosz, D. Ledenyák and M. Andó, Effect of FDM infill patterns on mechanical properties, Polym. Test., 2022, 113, 107654 CrossRef CAS.
- J. Bonada, M. M. Pastor and I. Buj-Corral, Influence of Infill Pattern on the Elastic Mechanical Properties of Fused Filament Fabrication (FFF) Parts through Experimental Tests and Numerical Analyses, Materials, 2021, 14, 5459 CrossRef CAS PubMed.
- M. Yunus and M. Alsoufi, Effect of raster inclinations and part positions on mechanical properties, surface roughness and manufacturing price of printed parts produced by fused deposition method, J. Mech. Eng. Sci., 2020, 14, 7416–7423 CAS.
- P. Feng, S. Shen, L. Yang, Y. Kong, S. Yang and C. Shuai, Vertical and uniform growth of MoS2 nanosheets on GO nanosheets for efficient mechanical reinforcement in polymer scaffold, Virtual Phys. Prototyping, 2023, 18, e2115384 CrossRef.
- C. B. Crawford and B. Quinn, 4 - Physiochemical properties and degradation, in Microplastic Pollutants, ed. C. B. Crawford and B. Quinn, Elsevier, 2017, pp. 57–100, cited 2022 Sep 21, available from https://www.sciencedirect.com/science/article/pii/B9780128094068000049 Search PubMed.
- R. Zentel and M. Brehmer. 8.06 - Electroactive Liquid Crystalline Polymers, in Polymer Science: A Comprehensive Reference, ed. K. Matyjaszewski and M. Möller, Amsterdam, Elsevier, 2012, pp. 129–145, cited 2022 Sep 21, available from https://www.sciencedirect.com/science/article/pii/B9780444533494002041 Search PubMed.
- D. dos Santos Rosa, M. R. Calil, C. das Graças Fassina Guedes and C. E. O. Santos, The Effect of UV-B Irradiation on the Biodegradability of Poly-β-Hydroxybutyrate (PHB) and Poly-ε-Caprolactone (PCL), J. Polym. Environ., 2001, 9, 109–113 CrossRef CAS.
- R. K. Sadi, G. J. M. Fechine and N. R. Demarquette, Photodegradation of poly(3-hydroxybutyrate), Polym. Degrad. Stab., 2010, 95, 2318–2327 CrossRef CAS.
- O. Gil-Castell, R. Andres-Puche, E. Dominguez, E. Verdejo, L. Monreal and A. Ribes-Greus, Influence of substrate and temperature on the biodegradation of polyester-based materials: Polylactide and poly(3-hydroxybutyrate-co-3-hydroxyhexanoate) as model cases, Polym. Degrad. Stab., 2020, 180, 109288 CrossRef CAS.
- A. P. Heitmann, I. Coura Rocha, P. P. de Souza, L. C. A. Oliveira, O. de and P. S. Patrício, Photoactivation of a biodegradable polymer (PHB): Generation of radicals for pollutants oxidation, Catal. Today, 2020, 344, 171–175 CrossRef CAS.
- B. W. Chieng, N. A. Ibrahim, W. M. Z. W. Yunus and M. Z. Hussein, Poly(lactic acid)/Poly(ethylene glycol) Polymer Nanocomposites: Effects of Graphene Nanoplatelets, Polymers, 2014, 6, 93–104 CrossRef.
- N. Choksi and H. Desai, Synthesis of Biodegradable Polylactic Acid Polymer By Using Lactic Acid Monomer, Int. J. Appl. Chem., 2017, 13, 377–384 Search PubMed.
- Chemistry (IUPAC) TIU of P and A, IUPAC - Norrish Type I photoreaction (N04219), cited 2022 Sep 21, available from https://goldbook.iupac.org/terms/view/N04219 Search PubMed.
- J. N. Pitts and F. E. Blacet, Methyl ethyl ketone photochemical processes, J. Am. Chem. Soc., 1950, 72, 2810–2811 CrossRef CAS.
- Chemistry (IUPAC) TIU of P and A, IUPAC - Norrish Type II photoreaction (N04218), cited 2022 Sep 21, available from https://goldbook.iupac.org/terms/view/N04218 Search PubMed.
- R. G. W. Norrish and C. H. Bamford, Photo-decomposition of Aldehydes and Ketones, Nature, 1937, 140, 195–196 CrossRef CAS.
| This journal is © The Royal Society of Chemistry 2023 |