 Open Access Article
Thermal analysis of novel third-generation phase-change materials with zinc as a chemical modifier
Vishnu Saraswata,
Shiv Kumar Pala,
N. Mehta *a,
Arun Kumarb and
M. M. A. Imranc
aPhysics Department, Banaras Hindu University, Varanasi-221005, India. E-mail: dr_neeraj_mehta@yahoo.co.in
bPhysics Department, IIT Roorkee, Roorkee-247667, India
cPhysics Department, Al-Balqa Applied University, Al-Salt-19117, Jordan
First published on 26th January 2023
Abstract
The thermal analysis in the present work is done to analyze the glass/crystal phase transformation in a newly synthesized glassy system (i.e., glassy SeTeSnZn alloys) consisting of chalcogenides Se and Te as major elements, Sn as a third element of the parent alloy and Zn as a chemical modifier. The role of increasing the Zn concentration at the cost of Se has been understood by correlating the kinematics of structural relaxation during the glass transition phenomenon and devitrification during the crystallization phenomenon in the chalcogenide glasses (ChGs) of the quaternary STSZ [i.e., Se78−xZnxTe20Sn2 (0 ≤ x ≤ 6)] system and their different physicochemical properties. A noticeable rise in the crystallization rate is observed after the addition of Zn in the parent SeTeSn glass. With the rise in the zinc content, the values of average heat of atomization and overall mean bond energy are found to be decreased with the decrease in cohesive energy of samples. An inverse correlation is observed between the thermal stability parameter and the enthalpy released during the glass/crystalline phase transformation.
1. Introduction
In recent years, the use of zinc as a dopant or metallic modifier in different advanced functional materials has been enhanced1–6 because of its efficient role in controlling the properties of the parent materials and achieving fascinating and fruitful results. The zinc chalcogenides have attracted the attention of experimentalists working on metal chalcogenides because of their robust bonding, large energy gaps, high enthalpies of formation, and melting points as compared to most of the other metallic chalcogenides formed by using other elements placed in the II–VI.1–10 The crystal dynamics of zinc chalcogenides4–6 suggest their utilization in various applications.4–10 Particularly, the recent literature survey of the last decade reveals that zinc is one of the building elements of phase change materials (PCMs) for use in phase change optical memory.11–17 These features compelled various research groups to utilize Zn as a modifier for preparing multicomponent (binary and ternary) ChGs.18–35Mehta et al.18 compared the effective values of thermal diffusivity and corresponding thermal conductivity of binary Se90Zn10 and Te90Zn10 alloys and found that both parameters are lower for Se90Zn10 alloy as compared to Te90Zn10 alloy. The outcome of Zn addition on the number of defect states per unit volume in the parent Se70Te30 sample was analyzed by Srivastava et al.19 by performing a.c. conductivity measurements.
Singh et al.20,21 observed the Meyer–Neldel relation between the rate constant and activation energy in thermally controlled crystallization during the calorimetric studies of ternary Se–In–Zn glasses. Nasir et al.22 reported the thermal analysis of the kinematics of glass transition as well as the recrystallization of binary Se98−xZnx glasses. They noticed the significant impact of zinc on the glass/crystal phase transformation of selenium glass. Nasir and Zulfequar23,24 performed the electrical measurement too in these glasses to estimate the number of localized states per unit volume and their dielectric behavior. They found the enhancement in the corresponding number density when the concentration of Zn content rises in the selenium glass. They also noticed a sufficient dielectric dispersion as a consequence of Zn incorporation.
The thermophysical and optical characterization of ternary Se98−xInxZn2 and Se93−xTe5InxZn2 (0 ≤ x ≤ 10) was done by Singh25,26 for the comparison between these ternary and quaternary samples. Kishore et al.27 used FTIR spectra of ternary Se72−xS28Znx (0 ≤ x ≤ 4) for analyzing the influence of Zn on the optical parameters of parent Se72S28 glass and observed the significant decrement in the optical gap by a small rise in the content of zinc. Ahmad et al.28 used silver ion radiation to expose amorphous thin films of the SeSZn sample and investigated the irradiation effect on optical, electrical, and structural properties. Abbady et al.29 compared the effect of Zn over two other additives (Ge and Ga) on the optical linearity/non-linearity of selenium by preparing thin-film samples. They found that most of the linear/non-linear optical parameters are optimized for the addition of Zn.
Alwany et al.30 reported the optical properties of ternary Ge20Se70Zn10 alloy by preparing its amorphous thin film. Lu et al.31 designed a novel (As2S3)100−x(ZnSe)x (0 ≤ x ≤ 30) system for the possible applications in Mid-IR fiber lasers and found that these materials show compatibility with a drawing scheme adopted for preparing fibers showing low-loss of signals. Azhniuk and his research group32 observed the sign of photoinduced creation of ZnSe nano-crystallites during the investigation of the optical characterization of As2Se3 thin films doped with zinc.
Nagpal et al.33 investigated the consequences of adding zinc to the various optical parameter of binary Se90Sb10 glass (0 ≤ x ≤ 10) and concluded that the optical properties changed noticeably. Chazot and his research team34 tried to design a fiber laser by using a composite that consists of active crystals of Fe:ZnSe in a glass matrix. For this, they checked the suspension stability of zinc selenide crystals in a specific glass made of As2S3 and As2Se3 having compositions 94.6 and 5.4 respectively. Some glass ceramics of the ternary Se–Ge–Zn system were developed by Velea et al.35 for applications in infrared optics that were found capable of the prospective research work in IR optics.
In this way, different groups used zinc as a modifier in various multicomponent ChGs (especially binary and ternary systems) to see its consequence on the physical properties of parent samples. The above literature survey reveals that only a few endeavors were done to study the role of Zn on different physical properties in quaternary systems of ChGs. Keeping in mind this point and the fascinating results reported by the above research groups, we decided to synthesize some ChGs of the quaternary SeTeSnZn system. In this paper, we have reported a systematic analysis of the outcomes derived from the calorimetric experiments done on the present samples of the quaternary STSZ system.
2. Experimental
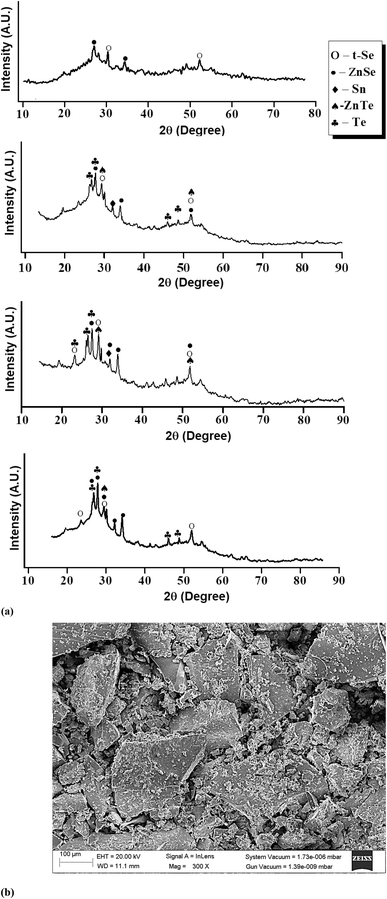
For the present studies, we prepared some glassy samples of SeTeSnZn by quenching their melts in chilled water. The specifics of this synthesis technique are described in ref. 36–38. The non-crystalline character of as-prepared samples was confirmed by the X-ray diffraction (XRD) technique and analysis of scanning electron microscopic (SEM) pictures. Fig. 1 shows such results for as-prepared samples. There were no sharp peaks of sufficient intensity in the XRD patterns of the present samples. Only a few weak peaks of insignificant intensities were observed over the broad humps i.e., the first sharp diffraction peak (FSDP) and second sharp diffraction peak (SSDP) [see Fig. 1(a)] that were the characteristic of intermediate-range ordering in the present samples. However, we have identified some distinguished peaks that can be indexed.The primary peaks of crystalline t-Se i.e., trigonal Se (COD-9008579) are visible at 2θ values of 23.5°, 29.7°, and 51.7°, which correspond to the crystal planes (100), (101), and (201), respectively while the small peaks at 23.05°, 27.55°, 45.88°, 47.04°, and 49.69° are, respectively, associated with the crystal planes (100), (101), (003), (200), and (201) of crystalline t-Te i.e., trigonal Te. The diffraction peaks at 2θ of 32°, are compared with the JCPDS data and respectively indexed to the crystallographic planes (101) polycrystalline planes metallic tin (JCPDS card no. 004-0673). Further, the peaks at (2θ) 27.65, 45.13, and 52.6 in the ZnSe spectrum correspond to the index planes (111), (220), and (311) for cubic zinc mix structured ZnSe (JCPDS card no. 65-9602). In addition to these peaks, the ZnSe diffraction pattern also shows peaks at (2θ) 23.55, 26.4, 28.6, 30.5, 34.9, and 43.8, which correspond to the Miller indices (111), (100), (002), (101), (102) and (220). ZnTe nanocrystals' diffraction peaks at 29.92, 49.52, and 51.88 could be correlated with the (200), (311), and (222) planes of the cubic-phase ZnTe.
Further, no sign of crystallinity was observed in the SEM picture of the as-prepared samples. Such an SEM picture of a representative sample of Se76Te20Sn2Zn2 is shown here [see Fig. 1(b)]. For the thermal characterization of the samples, we adopted non-isothermal heating and performed the calorimetric measurements in a differential scanning calorimeter (TA Instruments, USA; Model: Q20). DSC runs were performed at four diverse heating rates for all the samples. For doing calorimetric measurement in the DSC unit, the samples were crushed and 5 mg powder of each sample was enclosed in the crimped pans. For the calibration of the DSC cell, indium was used. Nitrogen gas is used as purge gas during the calorimetric measurements. The sensitivity of the employed DSC unit was 1.0 μW and temperature accuracy was ±0.1 °C. The full details of this technique are described in ref. 39.
3. Results and discussion
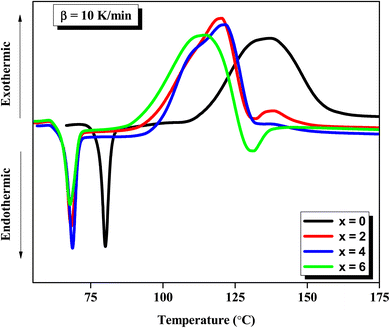
Fig. 2 shows the results of the calorimetric experiment performed on the samples of the STSZ glassy system at a specific heating rate of 10 K min−1. The appearance of distinct glass transition and crystallization phenomena are seen as the first endothermic peak and the second exothermic peak in each scan of this figure. Further, the homogeneity of each as-prepared sample is reflected in the sharpness of the glass transition and crystallization peaks. When the homogeneity of the samples is poor, there is a strong chance of phase separation,40–43 which appears as the splitting of the glass transition peak and/or crystallization peak in double or triple components or the broadening of its width.Abdel-Wahab43 prepared a ternary glass (Se77.5Te20Sn2.5) whose composition was almost identical to the parent glass (Se78Te20Sn2) of the present SeTeSnZn system. He performed DSC experiments in Se77.5Te20Sn2.5 and found that this sample had two exothermic crystallization peaks as a signature of phase separation. However, such splitting of the glass transition peak and/or crystallization peak is neither observed in the parent Se78Te20Sn2 ternary glass nor zinc containing SeTeSnZn quaternary glasses. Thus, in our samples, the chance of this unwanted situation is ruled out as a signature of the sharpness of the glass transition peaks. Similar observations were observed in DSC scans obtained by calorimetric measurements at other heating rates. From such DSC scans of all samples at different heating rates, we have determined the glass transition temperature Tg and the crystallization temperature Tc by noting down the temperatures corresponding to peak maximum.
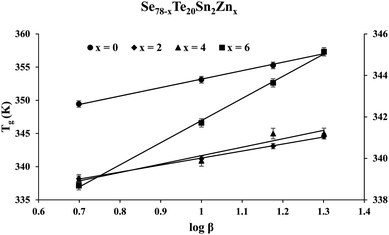
To realize the dependency of these characteristic temperatures on heating rate β, we have used the following empirical relations suggested by Lasocka:44
Tg = Ag + Bg![[thin space (1/6-em)]](https://www.rsc.org/images/entities/char_2009.gif) log log![[thin space (1/6-em)]](https://www.rsc.org/images/entities/char_2009.gif) β β
| (1) |
The intercept Ag in eqn (1) represents the theoretical value of Tg corresponding to 1 K min−1 heating rate. Lasocka's parameter Bg represents the slope of the straight line shown by eqn (1). Such linear graphs are shown in Fig. 3. Table 1 tabulates the value of Ag and Bg for the present samples.
| Sample | Ag (K) | Bg (min−1) | Ac (K) | Bc (min−1) |
|---|---|---|---|---|
| Se78Te20Sn2 | 340.5 | 12.7 | 380.7 | 29.1 |
| Se76Te20Sn2Zn2 | 330.7 | 10.6 | 372.5 | 20.6 |
| Se74Te20Sn2Zn4 | 329 | 12.7 | 364.7 | 22.2 |
| Se72Te20Sn2Zn6 | 331.1 | 10.7 | 370.9 | 23.3 |
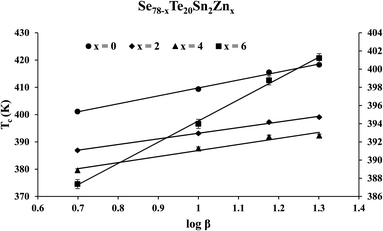
The similar empirical relation of Tc for crystallization phenomenon can be expressed in terms of β:44
Tc = Ac + Bc![[thin space (1/6-em)]](https://www.rsc.org/images/entities/char_2009.gif) log log![[thin space (1/6-em)]](https://www.rsc.org/images/entities/char_2009.gif) β β
| (2) |
To find the correlation between Tg and Tc in the present study, we have derived the following relation by using eqn (1) and (2):
 | (3) |
Eqn (3) reveals that the kinetic temperatures Tc and Tg, corresponding to the crystallization and glass transition phenomena respectively, are mutually dependent on each other. Another interesting fact about such correlation is that we can use this equation for the determination of Kauzmann temperature (Tk) which is a significant parameter for the characterization of glassy materials from a thermodynamic lookout.45 The Tk represents the value of temperature upon which the entropy of a liquid having glass-forming ability becomes equal to that of its crystalline complement. Thus, keeping in mind the thermodynamic aspects, it signifies a lower limit for Tg below which the presence of an under-cooled glass-forming liquid does not obey thermodynamic law.45 We can use eqn (3) for the determination of the Kauzmann temperature in the present case by keeping in mind that the Kauzmann temperature is the bottommost hypothetical borderline for the glass transition corresponding to a permissible assumption Tg = Tc = Tk46 at a particular heating rate βk (known as Kauzmann heating rate).
Solving eqn (3) for Tk (which is equal to Tg or Tc) and βk, we obtain the following relations:
 | (4) |
 | (5) |
Table 2 tabulates the values obtained for Tk and βk from eqn (4) and (5) in the present case. From this table, one can realize that it is enormously hard to perform the calorimetric experiments to detect this ideal glass transition because of the very low values of the heating rate.
| Sample | Tk (K) | βk (K min−1) |
|---|---|---|
| Se78Te20Sn2 | 309.1 | 2.12 × 10⁻⁶ |
| Se76Te20Sn2Zn2 | 286.7 | 2.7 × 10⁻¹⁰ |
| Se74Te20Sn2Zn4 | 281.2 | 2.2 × 10⁻⁹ |
| Se72Te20Sn2Zn6 | 297.9 | 5.8 × 10⁻⁸ |
The composition dependence of different kinetic parameters indicates that there is non-linear variation in different parameters. ChGs are famous for their non-linear physical properties due to their inherent structural flexibility. In ChGs, earlier it was believed that only two critical compositions are having the values 2.4 and 2.67 of mean coordination number (![[Z with combining macron]](https://www.rsc.org/images/entities/i_char_005a_0304.gif) ) in the IV–VI chalcogenide glassy system at which such a reversal in the compositional trend of different physical properties is observed. However, we have observed such a reversal in the compositional trend of Lasocka's parameters and Kauzmann's parameters at lower values of
) in the IV–VI chalcogenide glassy system at which such a reversal in the compositional trend of different physical properties is observed. However, we have observed such a reversal in the compositional trend of Lasocka's parameters and Kauzmann's parameters at lower values of ![[Z with combining macron]](https://www.rsc.org/images/entities/i_char_005a_0304.gif) . In the recent study,47–49 it has been proposed that the rigidity percolation transition (i.e., a reversal in the compositional trend) can occur over a range of mean coordination numbers leading to three distinct phases namely; floppy, intermediate and rigid. Various researchers50–52 reported that such transitions occur at different compositions for different physical properties even at lower values of
. In the recent study,47–49 it has been proposed that the rigidity percolation transition (i.e., a reversal in the compositional trend) can occur over a range of mean coordination numbers leading to three distinct phases namely; floppy, intermediate and rigid. Various researchers50–52 reported that such transitions occur at different compositions for different physical properties even at lower values of ![[Z with combining macron]](https://www.rsc.org/images/entities/i_char_005a_0304.gif) . This is probably the reason behind the observation of the reversal in the compositional trend of Lasocka's parameters and Kauzmann's parameters at different compositions.
. This is probably the reason behind the observation of the reversal in the compositional trend of Lasocka's parameters and Kauzmann's parameters at different compositions.
Moynihan and coworkers53 developed a method to evaluate the glass transition activation energy. This relation is generally known as the Moynihan relation and can be expressed as:
 | (6) |
Although the Kissinger equation54 is primarily derived for the evaluation of kinetic activation energy Ec involved in thermally governed crystallization, one can adopt an analogous relation for the glass transition to estimate the corresponding activation energy Eg. The premise of employing this relation for the assessment of Eg originates from the shifting of maxima at Tg towards the higher temperature side with the rise in β values. Consequently, the analogous Kissinger equation takes the form:54
 | (7) |
The plots of ln(β) and ln(β/Tg2) against 1000/Tg are shown in Fig. 5. The linear nature of the graphs confirms the applicability of eqn (6) and (7). From the gradients of such linear graphs, we have determined Eg for all the samples.
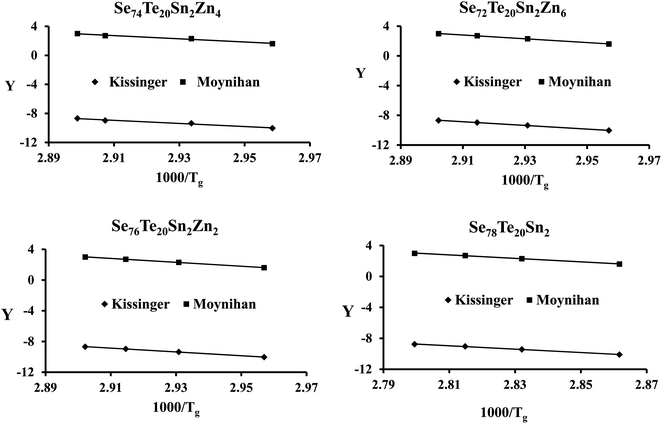 | ||
| Fig. 5 Plots of ln(β) vs. 103/Tg and ln(β/Tg2) vs. 103/Tg for the present samples. On the y-axis, Y = ln(β) and ln(β/Tg2) for the Moynihan method and Kissinger method, respectively. | ||
Lasocka44 observed that Bg is subject to the cooling rate of the melt unswervingly. He suggested that parameter Bg signifies the retroactivity of the configurational alterations arising in the vicinity of the temperature range corresponding to the glass transformation. Keeping in mind the fact that glass transition activation energy Eg is related to the movements of structural species throughout the thermal relaxation in the neighborhood of the glass transition, we have plotted the graph of Eg against parameter Bg and found that Eg of the samples is decreased non-linearly with increasing parameter Bg [see Fig. 6(a)] in the present case. This indicates that the higher the value of Bg, the more transient responsiveness of the local configurational deviations and so the glass network requires less activation energy. A similar correlation between glass transition activation energy Eg and Lasocka parameter Bg was observed earlier in the glassy Se80−xTe20Snx system by Kumar et al.55 Thus, our present results of the glassy Se80−xTe20Sn2Znx system are consistent with our previous results of the glassy Se80−xTe20Snx system.55
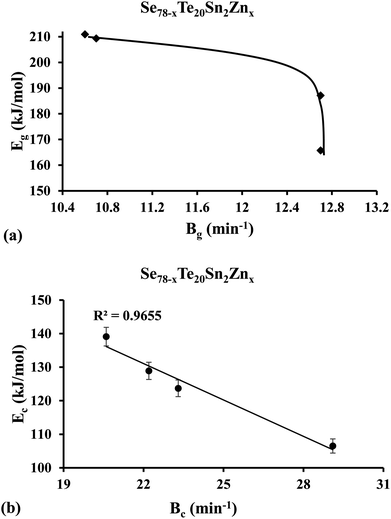 | ||
| Fig. 6 Plots of (a) glass transition activation energy Eg against Lasocka parameter Bg, and (b) crystallization activation energy Ec against Lasocka parameter Bg. | ||
By using the JMA model, various methods are developed by different authors to calculate Ec for different kinds of glasses. As derived by Kissinger,54 we can express Ec in terms of β as follows:
 | (8) |
Matusita and Sakka56,57 set up the following equation for the determination of Ec from the classical JMA relation:
 | (9) |
Augis and Bennett58 derived a slightly different non-isothermal relation to calculate the crystallization activation energy:
 | (10) |
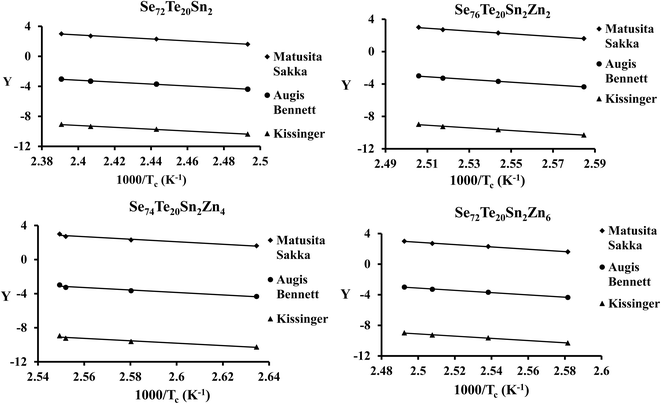
By using eqn (8)–(10) we have plotted the graphs of ln(β/Tc2) [i.e., Kissinger method], ln(β) [i.e., Matusita–Sakka method] and ln(β/Tc) [i.e., Augis–Bennett method] against 1000/Tc. Such plots are shown in Fig. 7. By using the slopes of these graphs, we have evaluated the Ec values in the present study for the various samples. Keeping in mind the observed correlation between Lasocka parameter Bg and glass transition activation energy Eg, we have plotted a similar plot for the Lasocka parameter Bc and crystallization activation energy Ec and observed that Ec is also decreased with a rise in Lasocka parameter Bc [see Fig. 6(b)]. However, the decrement in Ec with Bc is almost linear.
The crystallization rate of ChGs can be determined by studying its temperature dependence which is governed by the Arrhenius equation:59,60
 | (11) |
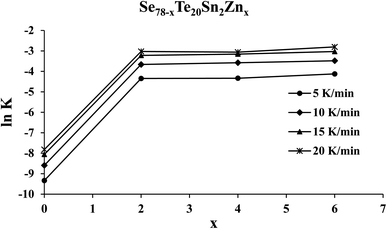
Since the rate K represents the growth rate of the crystalline species during the devitrification of the samples, we can understand the influence of zinc incorporation on the rate constant K of crystallization for the parent glass by substituting the value of the crystallization activation energy Ec in eqn (11) at the temperatures lying in the crystallization region of the SeTeSnZn samples.
Knowing the value of Ec and pre-factor K0, we have determined the rate of crystallization for the present samples of the SeTeSnZn system using eqn (11). The composition dependence of ln![[thin space (1/6-em)]](https://www.rsc.org/images/entities/char_2009.gif) K is shown in Fig. 8 for all the samples at different heating rates. From this figure, we see that the crystallization rate of the quaternary alloys is larger in comparison to parent SeTeSn glass and it attains an almost constant higher value after zinc incorporation at all the heating rates.
K is shown in Fig. 8 for all the samples at different heating rates. From this figure, we see that the crystallization rate of the quaternary alloys is larger in comparison to parent SeTeSn glass and it attains an almost constant higher value after zinc incorporation at all the heating rates.
We have used the following relation for the determination of the average heat of atomization ![[H with combining macron]](https://www.rsc.org/images/entities/i_char_0048_0304.gif) A of the samples in the present study:61
A of the samples in the present study:61
 | (12) |
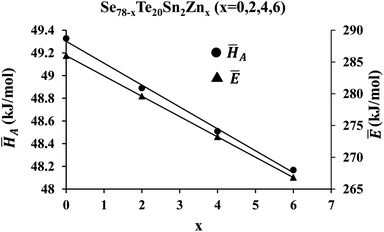
![[H with combining macron]](https://www.rsc.org/images/entities/i_char_0048_0304.gif) A on the zinc content is revealed in Fig. 9.
A on the zinc content is revealed in Fig. 9.
To determine the overall mean bond energy of the samples, we have used a model recommended by Tichy and Ticha based on the approach chemical bond theory.62 According to the Tichy–Ticha model, the ChGs can be categorized into three categories based on a parameter R according to the following conditions:
| R = 1; R > 1 or R < 1 | (13) |
For R is equal to one (i.e., R = 1), Tichy and Ticha suggested that the glass network attains the stoichiometric composition because of the presence of heteropolar bonds solitary and this composition is corresponding to the chemical threshold where we observe frequently the utmost values of glass transition temperature Tg. If R is greater than one (i.e., R > 1), then the corresponding glassy system will be a member of the chalcogen-rich family. In such a case, the glassy system consists of both chalcogen–chalcogen bonds and heteropolar bonds. If R is smaller than one (i.e., R < 1), then the corresponding glassy system will be a member of the chalcogen-poor family. In such cases, the chalcogen–chalcogen bonds are almost absent and the glassy system consists of only metal–metal bonds and heteropolar bonds.62 Since in the present studies, the concentration of chalcogen elements Se and Te is very high as compared to the other two elements (Sn and Zn), our glassy system belongs to the chalcogen-rich family.
For the chalcogen-rich region, the Tichy–Ticha model further suggests that the degree of cross-linking can be determined by using the expression:
 | (14) |
| Ec = Pr × Ehb | (15) |
 | (16) |
 | (17) |
Knowing the values of Ec and Erm, we can determine the overall value Ē of mean bond energy by adding them, i.e.,:62
| Ē = Ec + Erm | (18) |
Fig. 9 shows the dependency of Ē on the concentration of zinc also. This figure reveals that both average heat of atomization ![[H with combining macron]](https://www.rsc.org/images/entities/i_char_0048_0304.gif) A and overall mean bond energy Ē are decreased with the intensification of the zinc atoms in the parent SeTeSn glass. This is probably understood through the chemically ordered network model and chemical bond approach63 as described in the next paragraph.
A and overall mean bond energy Ē are decreased with the intensification of the zinc atoms in the parent SeTeSn glass. This is probably understood through the chemically ordered network model and chemical bond approach63 as described in the next paragraph.
The bonds of Se–Se (330.5 kJ mol−1) are sturdier as compared to the bonds of Te–Te (293.3 kJ mol−1).64 Similarly, the Se atom has higher electro-negativity as compared to the Te atom. Thus, the bond strength of Se–Zn bonds is greater than Te–Zn bonds. Consequently, we can expect that zinc as a foreign element gives preference to Se after entering the glass network of parent glass and so there is a drop in the number of Se–Se bonds (330.5 kJ mol−1) as an outcome of the dissolution of Zn atoms in polymeric Se-chains.64 Thus, the creation of Se–Zn bond (170.7 kJ mol−1) and Zn–Zn bonds (22 kJ mol−1) occur.64 Accordingly, the cohesive energy of the system decreases with a rise in the Zn concentration in the parent glass. This is probably the reason for the reduction in the overall value of mean bond energy and average heat of atomization of the preset samples with the rise in Zn concentration.
A crucial parameter to determine the permanency of glassy substances in the vitreous state is the released amount of the enthalpy (ΔHgc) through the phase transformation from the non-crystalline state (i.e., glassy phase) to the crystalline state (i.e., crystal phase). It can be determined by subtracting the glass transition enthalpy (ΔHg) from crystallization enthalpy (ΔHc), so that:
| ΔHgc = ΔHc − ΔHg | (19) |
The glass having lower values of ΔHgc possesses higher thermal stability. To confirm this, we have determined thermal stability by using the Saad–Poulin relation:65
 | (20) |
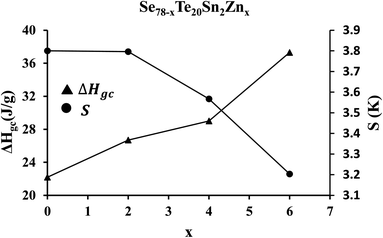 | ||
| Fig. 10 Composition dependence of enthalpy (ΔHgc) released during phase transformation from the glassy state to the crystalline state and thermal stability parameter S. | ||
In the last two decades, various research groups have studied the thermal stability of zinc containing multicomponent (i.e., binary, ternary, and quaternary) ChGs of Se–Te to optimize the durability and reduce aging effects.22,66–68 Hence, we have compared the results of the present study with that are reported in ref. 22 and 66–68. The comparison of such data is tabulated in Table 3. This table reveals the better durability of the present samples as compared to others zinc containing multicomponent ChGs due to their thermal stability values.
| S. no. | Glass composition | S (K) | Reference |
|---|---|---|---|
| 1 | Se98Zn2 | 1.6 | 22 |
| Se95Zn5 | 2.7 | ||
| Se90Zn10 | 2.5 | ||
| Se80Zn20 | 2.0 | ||
| 2 | Se70Te28Zn2 | 3.1 | 67 |
| Se70Te26Zn4 | 3.6 | ||
| Se70Te24Zn6 | 2.9 | ||
| Se70Te22Zn8 | 3.3 | ||
| 3 | Se78Te20Zn2 | 3.1 | 66 |
| Se76Te20Zn4 | 3.2 | ||
| Se74Te20Zn6 | 2.9 | ||
| Se72Te20Zn8 | 2.4 | ||
| Se70Te20Zn10 | 1.9 | ||
| 4 | Se93Zn2Te5 | 1.8 | 68 |
| Se91Zn2Te5In2 | 2.8 | ||
| Se89Zn2Te5In4 | 3.9 | ||
| Se87Zn2Te5In6 | 4.2 | ||
| Se83Zn2Te5In10 | 3.0 | ||
| 5 | Se78Te20Sn2 | 3.8 | Present work |
| Se78Te20Sn2Zn2 | 3.8 | ||
| Se76Te20Sn2Zn4 | 3.7 | ||
| Se74Te20Sn2Zn6 | 3.2 |
4. Conclusions
The incorporation of zinc in SeTeSn helps in the synthesis of new third-generation samples of quaternary SeTeSnZn system that are free from the problem of phase separation. This is confirmed by the appearance of the sharp solo peaks at glass transition temperature in zinc-containing derived samples. Further analysis reveals that the activation energies corresponding to the crystallization and glass transition phenomena are decreased with a rise in the corresponding Lasocka parameters.The crystallization rate is increased appreciably in the quaternary alloys after zinc incorporation in the parent SeTeSn ternary sample. The average heat of atomization and overall mean bond energy of the present samples is decreased with the reduction in cohesive energy when we increase the concentration of zinc. The thermal stability parameter is found to be increased with the drop in enthalpy released during the phase transformation from glass to the crystalline state.
Conflicts of interest
There are no conflicts to declare.Acknowledgements
Neeraj Mehta is thankful to his university for providing an incentive under Institutions of Eminence (IoE) Scheme (Dev. Scheme No. 6031).References
- R. Gangadharan, V. Jayalakshmi, J. Kalaiselvi, S. Mohan, R. Murugan and B. Palanivel, Electronic and structural properties of zinc chalcogenides ZnX (X = S, Se, Te), J. Alloys Compd., 2003, 359, 22–26 CrossRef CAS.
- F. Janetzko and J. Karl, Miscibility of zinc chalcogenides, J. Phys. Chem. A, 2004, 108, 5449–5453 CrossRef CAS.
- Y. Sun, Z. Sun, S. Gao, H. Cheng, Q. Liu, J. Piao, T. Yao, C. Wu, S. Hu, S. Wei and Y. Xie, Fabrication of flexible and freestanding zinc chalcogenide single layers, Nat. Commun., 2012, 3, 1057 CrossRef PubMed.
- J. P. Dubey, R. Tiwari, K. S. Upadhyaya and P. K. Pandey, Crystal dynamics of zinc chalcogenides I: an application to ZnS, Turk. J. Phys., 2015, 39, 242–253 CrossRef CAS.
- J. P. Dubey, R. Tiwari, K. S. Upadhyaya and P. K. Pandey, Crystal dynamics of zinc chalcogenides II: an application to ZnSe, IOSR J. Appl. Phys., 2015, 7, 67–75 Search PubMed.
- J. P. Dubey, R. Tiwari, K. S. Upadhyaya and P. K. Pandey, Crystal dynamics of zinc chalcogenides III: an application to ZnTe, Turk. J. Phys., 2016, 40, 201–208 CrossRef CAS.
- J. Zhou, H. Zhuang and H. Wang, Layered tetragonal zinc chalcogenides for energy-related applications: from photocatalysts for water splitting to cathode materials for Li-ion batteries, Nanoscale, 2017, 9, 17303–17311 RSC.
- C. Tang, X. Wei, X. Cai, Q. An, P. Hu, J. Sheng, J. Zhu, S. Chou, L. Wu and L. Mai, ZnSe microsphere/multiwalled carbon nanotube composites as high-rate and long-life anodes for sodium-ion batteries, ACS Appl. Mater. Interfaces, 2018, 10, 19626–19632 CrossRef CAS PubMed.
- S. Deb, P. K. Kalita and P. Datta, Opto-electronic characterization of starch capped zinc chalcogenides (core-shell) nanocomposites and their application as Schottky device, Phys. Scr., 2020, 95, 095810 CrossRef CAS.
- P. Li and T. He, Recent advances in zinc chalcogenide-based nanocatalysts for photocatalytic reduction of CO2, J. Mater. Chem. A, 2021, 9, 23364–23381 RSC.
- R. Li, Y. Jiang, L. Xu, Z. Ma, F. Yang, J. Xu and W. Su, Enhanced threshold voltage of Zn-doped Ge2Sb2Te5 phase-change memory deposited by electron-beam evaporation, Phys. Status Solidi A, 2013, 210, 2650–2655 CrossRef CAS.
- Y. Chen, G. Wang, J. Li, X. Shen, T.-F. Xu, R. Wang, Y. Lu, X. Wang, S. Dai and Q. Nie, Sb-rich Zn–Sb–Te phase-change materials: a candidate for the trade-off between crystallization speed and data retention, Appl. Phys. Express, 2014, 7, 105801 CrossRef.
- G. Wang, X. Shen, Y. Lu, S. Dai, Q. Nie and T.-F. Xu, Understanding the role of Zn in improving the phase change behaviors of Sb2Te3 films, Thin Solid Films, 2015, 585, 57–65 CrossRef CAS.
- Y. Chen, G. Wang, M. Tian, X. Shen, T.-F. Xu, Y. Lu, S. Dai and Q. Nie, Fast reversible laser-induced crystallization of Sb-rich Zn-Sb-Se phase change material with excellent stability, AIP Adv., 2015, 5, 077174 CrossRef.
- G. Wang, H. Shi, A. Lotnyk, D. Shi and R. Wang, Conversion of p–n conduction type by spinodal decomposition in Zn-Sb-Bi phase-change alloys, NPG Asia Mater., 2020, 12, 17 CrossRef CAS.
- Z. Wang, G. Wang, Y. Luo, G. Chen, H. Wang, D. Shi, Y. Lu, K. Jiang, T. Gu and J. Zhong, Amorphous-to-crystalline phase transition in Ge-rich Ge-Te-Zn films with high thermal stability, Vacuum, 2016, 132, 82–85 CrossRef CAS.
- J. Gu, Y. Chen, Q. Zhang, G. Wang, R. Wang, X. Shen, J. Wang and T. Xu, Crystallization kinetics with fragile-to-strong crossover in Zn-Sb-Te supercooled phase-change liquids, Appl. Phys. Lett., 2019, 115, 091903 CrossRef.
- N. Mehta, K. Singh and N. S. Saxena, Comparative analysis of some thermo-physical properties of Se90Zn10 and Te90Zn10 alloys, Thermochim. Acta, 2008, 475, 80–82 CrossRef CAS.
- S. Srivastava, N. Mehta, R. K. Shukla and A. Kumar, Effect of Zn incorporation on the a.c. conductivity of glassy Se70Te30 alloy, Eur. Phys. J.: Appl. Phys., 2008, 44, 217–221 CrossRef CAS.
- A. K. Singh and K. Singh, Crystallization kinetics and thermal stability of Se98-xZn2Inx chalcogenide glasses, Philos. Mag., 2009, 89, 1457–1472 CrossRef CAS.
- A. K. Singh, N. Mehta and K. Singh, Correlation between Meyer–Neldel rule and phase separation in Se98-xZn2Inx chalcogenide glasses, Curr. Appl. Phys., 2009, 9, 807–811 CrossRef.
- M. Nasir, M. A. M. Khan, M. Husain and M. Zulfequar, Thermal properties of Se100-xZnx glassy system, Mater. Sci. Appl., 2011, 2, 289–298 CAS.
- M. Nasir and M. Zulfequar, Estimation the density of localized state in glassy Se100-xZnx thin films by using space charge limited conduction measurement, New J. Glass Ceram., 2012, 2, 91–97 CrossRef CAS.
- M. Nasir and M. Zulfequar, DC conductivity and dielectric behaviour of glassy Se100-xZnx alloys, Open J. Inorg. Non-Met. Mater., 2012, 2, 11–17 CAS.
- A. K. Singh, Comparative study on thermophysical properties of Se–Zn–In and Se–Zn–Te–In chalcogenide glasses, Adv. Sci., Eng. Med., 2012, 4, 123–127 CrossRef CAS.
- A. K. Singh, A comparative study on optical properties of Se–Zn–In and Se–Zn–Te–In chalcogenide glasses, Optik, 2013, 124, 2187–2190 CrossRef CAS.
- S. N. Kishore, R. Kundu and S. Dhankhar, FTIR and optical properties of various Se-S-Zn chalcogenide glasses, IOP Conf. Ser.: Mater. Sci. Eng., 2015, 73, 012150 Search PubMed.
- S. Ahmad, M. Nasir, K. Asokan, M. S. Khan and M. Zulfequar, Electronic excitation induced structural, optical and electrical properties of Se85S10Zn5 thin films and applicability of a single oscillator model, RSC Adv., 2015, 5, 69400–69409 RSC.
- G. Abbady, K. Aly, Y. Saddeek and N. Afifiy, Linear and non-linear optical properties of amorphous Se and M5Se95 (M = Ge, Ga and Zn) films, Bull. Mater. Sci., 2016, 399, 1819–1825 CrossRef.
- A. Alwany, M. Algradee, M. M. Hafith and M. Abdel-Rahim, Structural and optical properties of Ge20Se70Zn10 thin films, Int. J. Sci. Eng. Investig., 2017, 6, 90–97 Search PubMed.
- X. Lu, Y. Zhang, J. Ren, E. Lewis, G. Farrell, A. Yang, Z. Yang and P. Wang, Chalcogenide glasses with embedded ZnS nanocrystals: potential mid-infrared laser host for divalent transition metal ions, J. Am. Ceram. Soc., 2018, 101, 666–673 CrossRef CAS.
- Y. Azhniuk, D. Solonenko, E. Sheremet, V. Dzhagan, V. Loya, I. V. Grytsyshche, S. Schulze, M. Hietschold, A. V. Gomonnai and D. Zahn, Structural and optical study of Zn-doped As2Se3 thin films: evidence for photoinduced formation of ZnSe nanocrystallites, AIP Adv., 2019, 9, 065212 CrossRef.
- G. Nagpal, I. Sharma and S. K. Tripathia, The effect of substitution of Sb with Zn on the optical and physical properties of Se90Sb10-xZnx (x = 0, 2, 4, 6, 10 at. %) thin films, Optik, 2020, 207, 164460 CrossRef CAS.
- M. Chazot, C. Arias, M. Kang, C. Blanco, A. Kostogiannes, J. Cook, A. Yadav, V. Rodriguez, F. Adamietz, D. Verreault, S. Danto, T. Loretz, A. Seddon, D. Furniss, K. Schepler, M. Richardson and K. Richardson, Investigation of ZnSe stability and dissolution behavior in As-S-Se chalcogenide glasses, J. Non-Cryst. Solids, 2021, 555, 120619 CrossRef CAS.
- A. Velea, F. Sava, P. Badica, M. Burdusel, C. Mihai, A. Galca, E. Matei, A. Buruiana, O. El Khouja and L. Calvez, New chalcogenide glass-ceramics based on Ge-Zn-Se for IR applications, Materials, 2022, 18, 5002 CrossRef PubMed.
- T. Bennett, Y. Yue, P. Li, A. Qiao, H. Tao, N. G. Greaves, T. Richards, G. I. Lampronti, S. A. T. Redfern, F. Blanc, O. Farha, J. Hupp, A. Cheetham and D. Keen, Melt-Quenched Glasses of Metal–Organic Frameworks, J. Am. Chem. Soc., 2016, 138, 3484–3492 CrossRef CAS PubMed.
- C. Qiao, Y. R. Guo, F. Dong, J. Wang, H. Shen, S. Wang, M. Xu, X. Miao, Y. Zheng, R. Zhang, L. Chen, C. Wang and K. Ho, Evolution of short and medium-range order in the melt-quenching amorphization of Ge2Sb2Te5, J. Mater. Chem. C, 2018, 6, 5001–5011 RSC.
- M. C. Brand, F. Greenwell, R. Clowes, B. D. Egleston, A. Kai, A. Cooper, T. Bennett and R. L. Greenaway, Melt-quenched porous organic cage glasses, J. Mater. Chem. A, 2021, 9, 19807–19816 RSC.
- N. Mehta, Characterization techniques for the study of thermally activated phase transitions and determination of thermo-physical/kinetic properties, in Advanced Analytic and Control Techniques for Thermal Systems with Heat Exchangers, ed. L. Pekar, Elsevier, 2020, pp. 149–166 Search PubMed.
- C. Jijian, Phase separation and crystallization of chalcogenide glass-forming systems, J. Non-Cryst. Solids, 1993, 161, 304–308 CrossRef.
- N. Mehta and A. Kumar, Observation of phase separation in some Se–Te–Ag chalcogenide glasses, Mater. Chem. Phys., 2006, 96, 73–78 CrossRef CAS.
- S. Stehlík, J. Kolar, H. Haneda, I. Sakaguchi, M. Frumar and T. Wagner, Phase separation in chalcogenide glasses: the system AgAsSSe, Int. J. Appl. Glass Sci., 2011, 2, 301–307 CrossRef.
- F. Abdel-Wahab, Observation of phase separation in some Se–Te–Sn chalcogenide glasses, Phys. B, 2011, 406, 1053–1059 CrossRef CAS.
- M. Lasocka, The effect of scanning rate on glass transition temperature of splat-cooled Te85Ge15, Mater. Sci. Eng., 1976, 23, 173–177 CrossRef CAS.
- W. Kauzmann, The nature of the glassy state and the behavior of liquids at low temperatures, Chem. Rev., 1948, 43, 219–256 CrossRef CAS.
- T. Ichitsubo, E. Matsubara, H. Numakura, K. Tanaka, N. Nishiyama and R. Tarumi, Low-temperature elastic moduli of a Pd-based metallic glass showing positive phonon dispersion, Phys. Rev. B: Condens. Matter Mater. Phys., 2005, 72, 052201 CrossRef.
- D. Selvanathan, W. J. Bresser and P. Boolchand, Stiffness transitions SixSe1-x in glasses from Raman scattering and temperature-modulated differential scanning calorimetry, Phys. Rev. B: Condens. Matter Mater. Phys., 2000, 61, 15061 CrossRef CAS.
- P. Boolchand, D. G. Georgiev and B. Goodmana, Discovery of the intermediate phase in chalcogenide glasses, J. Optoelectron. Adv. Mater., 2001, 3, 703–720 CAS.
- D. G. Georgiev, P. Boolchand and M. Micoulaut, Rigidity Transitions and Molecular Structure of AsxSe1-x Glasses, Phys. Rev. B: Condens. Matter Mater. Phys., 2000, 62, 9228 CrossRef.
- J. C. Phillips, Topology of covalent non-crystalline solids i: short-range order in chalcogenide alloys, J. Non-Cryst. Solids, 1979, 34, 153–181 CrossRef CAS.
- S. O. Kasap, D. Tonchev and T. Wagner, Heat capacity and the structure of chalcogenide glasses studied by temperature-modulated differential scanning calorimetry, J. Mater. Sci. Lett., 1998, 17, 1809–1811 CrossRef CAS.
- S. Saraswat and S. S. S. Kushwaha, Structural interpretation of specific heat measurements on glassy Se100-xSbx alloys, Philos. Mag., 2009, 89, 583–593 CrossRef CAS.
- C. T. Moynihan, A. J. Easteal, J. Wilder and J. Tucker, Dependence of the glass transition temperature on heating and cooling rate, J. Phys. Chem., 1974, 78, 2673–2677 CrossRef CAS.
- H. E. Kissinger, Reaction kinetics in differential thermal analysis, Anal. Chem., 1957, 29, 1702–1706 CrossRef CAS.
- H. Kumar, N. Mehta and K. Singh, Calorimetric studies of glass transition phenomenon in glassy Se80-xTe20Snx alloys, Phys. Scr., 2009, 80, 065602 CrossRef.
- K. Matusita and S. Sakka, Kinetic study of the crystallization of glass by differential scanning calorimetry, Phys. Chem. Glasses, 1979, 20, 81–84 CAS.
- K. Matusita and S. Sakka, Study of non-isothermal crystallization of glass by thermal analysis, Bull. Inst. Chem. Res., 1981, 59, 159–171 CAS.
- J. Augis and J. Bennett, Calculation of the Avrami parameters for heterogeneous solid state reactions using a modification of the Kissinger method, J. Therm. Anal. Calorim., 1978, 13, 283–292 CrossRef CAS.
- S. Arrhenius, About the rate of reaction in the inversion of cane sugar by acids, Z. Phys. Chem., 1889, 4, 226–248 CrossRef.
- S. Arrhenius, About the dissociation of water dissolved substances, Z. Phys. Chem., 1887, 1, 631–648 CrossRef.
- N. Chandel and N. Mehta, Analysis of physicochemical properties in covalent network chalcogenide glasses (ChGs): critical review of theoretical modeling of chemical bond approach, SN Appl. Sci., 2019, 1, 657 CrossRef.
- L. Tichy and H. Ticha, Covalent bond approach to the glass-transition temperature of chalcogenide glasses, J. Non-Cryst. Solids, 1995, 189, 141–146 CrossRef CAS.
- N. Mehta and A. Kumar, Thermal characterization of glassy Se70Te20M10 using DSC technique, J. Mater. Sci., 2004, 39, 6433–6437 CrossRef CAS.
- W. M. Haynes and D. R. Lide, CRC Handbook of Chemistry and Physics, section 9, 2014, pp. 65–69 Search PubMed.
- M. Saad and M. Poulin, Glass forming ability criterion, Mater. Sci. Forum, 1987, 19–20, 11–18 CAS.
- S. Faheem Naqvi and N. S. Saxena, Role of additive (Zn) incorporation on the glass/crystal thermodynamics and stability of Se80-xTe20Znx (x = 2, 4, 6, 8 and 10) glassy alloys, J. Non-Cryst. Solids, 2011, 357, 1804–1810 CrossRef.
- S. Srivastava, M. Zulfequar and A. Kumar, Glass transition kinetics of some Se70Te30-xZnx chalcogenide glasses, J. Ovonic Res., 2008, 4, 1–11 CAS.
- A. K. Singh, N. Mehta and K. Singh, Effect of indium additive on glass-forming ability and thermal stability of Se-Zn-Te chalcogenide glasses, Philos. Mag. Lett., 2010, 90, 201–208 CrossRef CAS.
| This journal is © The Royal Society of Chemistry 2023 |

