
 Open Access Article
 This Open Access Article is licensed under a Creative Commons Attribution-Non Commercial 3.0 Unported Licence
Analysis of canthin-6-one alkaloids derived from Eurycoma spp. by micellar liquid chromatography and conventional high-performance liquid chromatography: a comparative evaluation†
Attapon Sakdamasa,
Fonthip Makliangb,
Waraporn Putalunc,
Thaweesak Juengwatanatrakuld,
Tripetch Kanchanapoomc,
Seiichi Sakamoto e and
Gorawit Yusakul*af
e and
Gorawit Yusakul*af
aSchool of Pharmacy, Walailak University, Nakhon Si Thammarat, Thailand. E-mail: gorawit.yu@wu.ac.th; gorawit.yu@mail.wu.ac.th; Tel: +66-75-67-2839
bSchool of Languages and General Education, Walailak University, Nakhon Si Thammarat, Thailand
cFaculty of Pharmaceutical Sciences, Khon Kaen University, Khon Kaen, Thailand
dFaculty of Pharmaceutical Sciences, Ubon Rachathani University, Ubon Ratchathani, Thailand
eGraduate School of Pharmaceutical Sciences, Kyushu University, Higashi-ku, Fukuoka, Japan
fBiomass and Oil Palm Center of Excellence, Walailak University, Nakhon Si Thammarat, Thailand
First published on 21st February 2023
Abstract
Extracts of Eurycoma longifolia Jack (EL) and Eurycoma harmandiana Pierre (EH) contain numerous bioactive compounds and varying matrices that are challenging to separate using chromatographic techniques. Herein, micellar liquid chromatography (MLC) was used to analyze canthin-6-one alkaloids contained in these extracts, and the achieved performance was compared with that of a conventional high-performance liquid chromatography (HPLC) method. The optimal mobile phase of MLC corresponded to 15![[thin space (1/6-em)]](https://www.rsc.org/images/entities/char_2009.gif) :85 (v/v) acetonitrile:water (pH 3) containing 110 mM sodium dodecyl sulfate and 10 mM NaH2PO4. The retention times of canthin-6-one-9-O-β-D-glucopyranoside, 9-hydroxycanthin-6-one, canthin-6-one, and 9-methoxycanthin-6-one were 4.78/15.42, 17.64/24.11, 32.84/38.27, and 39.04/39.86 min, respectively, in the cases of isocratic MLC and conventional HPLC. In both cases, the analyte resolution exceeded 1.5. The MLC elution behavior of the examined analytes was largely determined by their hydrophobicity and ionization. The sensitivity, precision, accuracy, and per-run acetonitrile consumption of the MLC method were comparable to those of the conventional HPLC method. However, the latter method exhibited higher performance for application to EL and EH samples, particularly those with low analyte concentrations and varying sample matrices. Overall, the analysis of canthin-6-one alkaloids using MLC was limited to trace analytes due to interference by the matrix.
:85 (v/v) acetonitrile:water (pH 3) containing 110 mM sodium dodecyl sulfate and 10 mM NaH2PO4. The retention times of canthin-6-one-9-O-β-D-glucopyranoside, 9-hydroxycanthin-6-one, canthin-6-one, and 9-methoxycanthin-6-one were 4.78/15.42, 17.64/24.11, 32.84/38.27, and 39.04/39.86 min, respectively, in the cases of isocratic MLC and conventional HPLC. In both cases, the analyte resolution exceeded 1.5. The MLC elution behavior of the examined analytes was largely determined by their hydrophobicity and ionization. The sensitivity, precision, accuracy, and per-run acetonitrile consumption of the MLC method were comparable to those of the conventional HPLC method. However, the latter method exhibited higher performance for application to EL and EH samples, particularly those with low analyte concentrations and varying sample matrices. Overall, the analysis of canthin-6-one alkaloids using MLC was limited to trace analytes due to interference by the matrix.
Introduction
Eurycoma longifolia Jack (EL) and Eurycoma harmandiana Pierre (EH) are medicinal plants that are native to Southeast Asia and accumulate similar types of bioactive compounds.1 Given the broad safety profile of EL root extracts and the abundance of bioactive species (mainly quassinoids, canthin-6-one alkaloids, and β-carboline alkaloids),1–3 these extracts are utilized in numerous medicinal applications: they are used for improving male sexual performance4 and treating sexual dysfunction, malaria, cancer, diabetes, constipation, inflammation, fever, fatigue, leukemia, and infectious and bone diseases.3,5,6The aphrodisiac activities of EL are attributed to canthin-6-one alkaloids, such as canthin-6-one-9-O-β-D-glucopyranoside (C6OG), 9-methoxycanthin-6-one (MCO), canthin-6-one (C6O), and 9-hydroxycanthin-6-one (HCO), which exert their effects by inhibiting phosphodiesterase type 5 (IC50 = 2.86 ± 0.23, 3.30 ± 1.03, 4.31 ± 0.52, and 4.66 ± 1.13 μM, respectively).7 In addition, HCO may be associated with penile erection and delayed ejaculation in rats, by interfering with Ca2+ mobilization and, thus, antagonistically toning the smooth muscles of the corpus cavernosum and seminal vesicle.8
Bioactive marker standardization is the basis for quality control of herbal drugs. High-performance liquid chromatography (HPLC) analysis of canthin-6-one alkaloids in EL roots typically requires an acetonitrile-containing mobile phase,1,9,10 as indicated by reverse-phase liquid chromatography using isocratic elution with 35% (v/v) acetonitrile in 0.1% (v/v) aqueous acetic acid.1 However, acetonitrile and other organic solvents are harmful to humans and the environment, pose safety risks due to their volatility, and incur additional expenses related to waste handling. Given that medicinal plant extracts typically contain numerous bioactive compounds and interferences and are therefore difficult to analyze, the development of appropriate analytical methods, such as micellar liquid chromatography (MLC), has drawn significant attention.
This green reverse-phase liquid chromatographic technique has been applied to samples with diverse matrices, e.g., honey, serum, meat, milk, feeds, sauces, vegetables, and wastewater;11 however, the performance of MLC for the analysis of natural products in complex plant-extract matrices remains underexplored. Large variations in secondary metabolites (both quality and quantity) are usually observed for plant samples of the same species. The environmental factors influencing the accumulation of secondary metabolites include location of cultivation, season, rainfall, temperature, age of plant, and soil microbial. These factors lead to phytochemical analyses involving varied matrices; the critical performance of an analytical method should therefore be compatible with varied matrices. Thus, the methods can be applied in EL and EH raw material quality control.
MLC uses a surfactant solution as the mobile phase with a concentration above the critical micelle concentration,12 with the retention of analytes determined by their interactions with the micelles and surfactant-modified stationary phase. For [nonionized analyte + ionic surfactant] and [charged analyte + nonionic surfactant] combinations, the elution behavior is determined by hydrophobic, dipole–dipole, and hydrogen bonding interactions, while electrostatic interactions are additionally observed for the [charged solute + ionic surfactant] combination.13 In addition, MLC may exhibit a lower demand for organic solvents than conventional HPLC, thus having a lower environmental impact. Previously, MLC has been applied in the determination of analytes containing ionizable N-atoms (such as quinolones, sulfonamides, mebendazole, and melamine).14 However, the MLC conditions for canthin-6-one alkaloids have not been evaluated.
In view of the above, we herein exploited differences in the hydrophobicity and ionization behavior of selected bioactive species (C6OG, MCO, C6O, and HCO) contained in EL and EH extracts to achieve their efficient separation using MLC (Table 1). The mobile phase composition (e.g., surfactant type and concentration, pH, and additive type and concentration) was optimized to decrease retention times and achieve acceptable resolutions using the response surface methodology (RSM). The performance of MLC was compared with that of conventional HPLC, and the applicability of both methods to plant extract analysis was assessed.
| Compound | Structure and pKa | logD |
Charge | ||||
|---|---|---|---|---|---|---|---|
| pH 3 | pH 5 | pH 7 | pH 3 | pH 5 | pH 7 | ||
| C6OG |  |
−1.558 | −0.7864 | −0.7591 | 0.8721 | 0.0638 | 0.0007 |
| HCO |  |
0.6939 | 1.4802 | 1.5067 | 0.8781 | 0.0671 | −0.0046 |
| C6O | 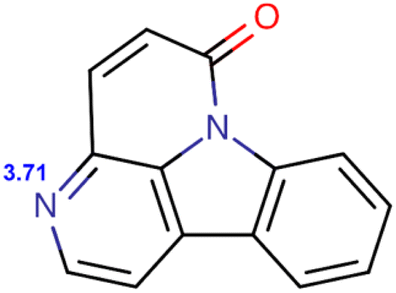 |
1.0984 | 1.792 | 1.8127 | 0.8366 | 0.0487 | 0.0005 |
| MCO |  |
0.8432 | 1.6264 | 1.6549 | 0.8768 | 0.0665 | 0.0007 |
Experimental
Materials
Sodium dodecyl sulfate (SDS; NaC12H25SO4, ≥99.5%), cetyltrimethylammonium bromide (CTAB; C19H42BrN, ≥99%), and polyoxyethylene lauryl ether (Brij®35; (C2H4O)nC12H26O, for synthesis) were obtained from QReC Quality Reagent Chemical, Ltd. (New Zealand), Loba Chemie Pvt., Ltd. (Mumbai, India), and Sigma-Aldrich (MO, USA), respectively. Authentic C6O (98%), C6OG (98%), HCO (97%), MCO (97%), and β-carboline-1-propionic acid (CPA; 97%) were prepared as described previously.15 Chaparrinone (CHA; 97%) and scopoletin (SCO, 97%) were also prepared according to a known method.16 13-α-(21)-Epoxyeurycomanone (13-EEU; 98%), eurycomanone (EU; 98%), and eurycomalactone (EUL; 98%) were obtained from Wuhan ChemFaces Biochemical Co., Ltd. (Wuhan, Hubei, China). Reference standard stock solutions were prepared at 1 mg mL−1 in methanol using 30 min ultrasonication at 30 °C. The solutions of authentic compounds were kept at −25 °C until analysis. Prior to analysis, the samples were thoroughly solubilized using ultrasonication. Analytical-grade reagents were used for analysis.Plant sample preparation
EL roots were collected from several regions in Thailand. For extraction, dried EL root powder (200 mg) was fully suspended in ethanol (1 mL) upon agitation, and the sample was ultrasonicated (37 kHz) at 30 °C for 30 min. The mixture was subjected to 15 min centrifugation at 10000g, and the clear supernatant was collected, while the residue was subjected to three additional extractions as described above. The obtained extracts were combined, volume-adjusted to 5 mL, filtered through a membrane with a pore size of 0.45 μm, and analyzed using the chromatographic techniques.
Equipment
The Dionex Ultimate 3000 chromatographic system (Thermo Scientific, MA, USA) used herein included column compartments (TCC-3000SD), an autosampler (WPS-3000TSL), a solvent supply pump (LPG-3400SD), and a detector (DAD-3000). A VertiSep™ UPS C18 column (Vertical Chromatography Co., Ltd., Nonthaburi, Thailand) with a particle size of 5 μm and dimensions of 4.6 mm × 250 mm was used. The column compartment was maintained at 35 °C. The injection volume was 10 μL, and the flow rate of the mobile phase was 1.5 mL min−1. The performance of the chromatographic techniques was assessed in terms of analyte resolution and retention time. Detection was performed at wavelengths of 244 nm (13-EEU, EU, CHA, CPA, and EUL), 272 nm (C6OG, HCO, and MCO), 343 nm (SCO), and 361 nm (C6O). The column was equilibrated with the mobile phase for 50 min before analysis. Between experiments of varied MLC mobile phase compositions, the column was sequentially washed with deionized water (10 min, 1.5 mL min−1), methanol (20 min, 1 mL min−1), and water (10 min, 1.5 mL min−1), as described in a previous study.17Effect of surfactant type on MLC elution behavior
The composition and pH of the mobile phase were the primary factors affecting the MLC elution behavior. Initially, we optimized the surfactant type and concentration by testing SDS (30–120 mM), CTAB (30–120 mM), and Brij®35 (12.5–50 mM) as anionic, cationic, and nonionic surfactants, respectively. The mobile phase was supplemented with NaH2PO4 to 10 mM, pH-adjusted to 5 using H3PO4, filtered through a nitrocellulose membrane (pore size = 0.45 μm), and degassed (sonicated, 37 kHz) for 30 min.Effect of pH on MLC elution behavior
SDS (120 mM), CTAB (120 mM), and Brij®35 (37.5 mM) were selected for MLC elution. The mobile phase was supplemented with NaH2PO4 to 10 mM, pH-adjusted to 3, 5, or 7 using H3PO4 or NaOH solutions, filtered through a nitrocellulose membrane (pore size = 0.45 μm), and degassed (sonicated) for 30 min.Effect of additives on MLC elution behavior
The mobile phase with the optimal surfactant and pH (120 mM SDS, pH 5.0) was supplemented with acetonitrile, butanol, propanol, or propylene glycol at 4% (v/v) to enhance the peak shape and resolution. The best resolution was observed for acetonitrile, and its content was subsequently optimized in the range of 2–20% (v/v) at 120 mM SDS, 10 mM NaH2PO4, and pH 5.Optimization of mobile phase for MLC using RSM
Based on the one-factor-at-a-time method, the SDS concentration (X1 = 90, 110, and 130 mM), ACN content (X2 = 5, 10, and 15%, v/v), and pH (X3 = 3, 5, and 7) were additionally optimized using the RSM. Table S1† presents the details of the RSM experiments performed according to the Box–Behnken design (BBD). The optimal conditions were identified as 110 mM SDS, 15% (v/v) ACN, and pH 3 and were validated by comparison with conventional HPLC.Conventional HPLC
Conventional HPLC analysis was performed with the same instrumentation as that used for MLC analysis using a modified system described previously.7 A VertiSep™ UPS C18 column (particle size = 5 μm, dimensions = 4.6 mm × 250 mm) and gradient elution were used. The mobile phase consisted of solution B (80% (v/v) acetonitrile in 0.02% (v/v) aqueous trifluoroacetic acid) and solution A (0.02% (v/v) aqueous trifluoroacetic acid). The gradient program was as follows: 10–40% B (0–24 min), 40% B (24–40 min), and 40–80% B (40–43 min). The mobile phase composition was returned to 10% B to equilibrate the column for subsequent analyses. The column temperature was maintained at 35 °C, and the flow rate was 1 mL min−1. The detection wavelengths were set to 244, 272, 343, and 361 nm, and the injection volume was 10 μL.Validation of MLC and conventional HPLC methods
Validation, which included selectivity, accuracy, and precision evaluation, as well as sensitivity, was conducted following appendix K: Guidelines for dietary supplements and botanicals.18 Initially, the separation selectivity was assessed using authentic C6OG, HCO, C6O, and MCO and was additionally determined for MLC using the selected known constituents of EL and EH, including 13-EEU, EU, CPA, CHA, SCO, and EUL.Validation of sensitivity and linearity of determination were conducted using solutions of authentic compounds. The sensitivities of MLC and conventional HPLC methods were expressed in terms of the limits of detection (LOD) and quantitation (LOQ), which were determined as LOD = 3.3σ/S and LOQ = 10σ/S. In these equations, σ is the standard deviation of the response and S is the slope of the calibration curve describing the relationship between the analyte concentration (1.56–100 μg mL−1) and peak area. To determine the linearity and determination range, we prepared the reference standards as serial concentrations and analyzed them using MLC and conventional HPLC. The peak areas of the authentic compounds were plotted against their concentrations, and the goodness of the obtained linear fits were expressed in terms of the coefficient of determination (R2). For recovery determination, the EL extract solutions were spiked with the authentic compounds. The theoretical concentrations of the spiked authentic compounds (12.5, 25, and 50 μg mL−1) were defined as C1, while the analyte concentrations determined in spiked samples using MLC and conventional HPLC were denoted as C2, and the analyte concentrations in the nonspiked EL extract were defined as C3. The accuracy was calculated as recovery (%) = [(C2 − C3)/C1] × 100%. The repeatability and precision were evaluated for intraday and interday analyses. The relative standard deviation (%RSD) was obtained by analyzing three independent samples spiked at three different levels. For interday precision, the investigation was performed using the same procedure on different days and was conducted within a single laboratory.
Software
Design-Expert® software version 13.0.5.0 was used to conduct the RSM analysis (Stat-Ease Inc. MN, USA). The pKa, logD, and charge of analytes and other constituents were calculated using the Chemicalize platform (https://chemicalize.com/app/calculation).
Results and discussion
Effect of mobile phase composition and pH on analyte retention
At the same concentration (30–120 mM), CTAB afforded shorter retention times than SDS (Tables S2 and S3†), whereas CTAB-modified C18 stationary phases were considered to repel cationic analytes.13 Moreover, not all concentrations of CTAB allowed the separation of HCO and C6O, and the C6O–MCO resolution was lower than the acceptance criterion. In the case of Brij®35, the target compounds could be separated with acceptable resolutions at surfactant concentrations of 25–50 mM, although the required runtime ranged from 31 to 57 min (Table S4†). SDS provided shorter retention times with higher resolutions. In the case of 120 mM SDS, the retention times of C6OG, HCO, C6O, and MCO were 3.67, 11.4, 18.13, and 21.03 min, respectively, with the C6OG–HCO, HCO–C6O, and C6O–MCO resolutions being 12.91, 6.76, and 2.14, respectively.For all surfactants and analytes, the retention time and resolution decreased with increasing surfactant concentration, which was ascribed to the concomitant increase in the partitioning of analytes into the micelles contained in the mobile phase.13,19 At a fixed mobile phase pH of 5, the analytes were eluted according to their hydrophobicity. The glycosidic compound C6OG exhibited weaker retention than the more hydrophobic analytes, such as HCO, C6O, and MCO. At pH 5, the predicted logD values (lipophilicity of ionizable compounds) of C6O and MCO were 1.792 and 1.6264, respectively, whereas the respective charges were 0.0487 and 0.0665 (Table 1). The higher positive charge of MCO may have contributed to its stronger retention despite its lower logD.
As expected, the pH of the mobile phase affected the analyte ionization status and lipophilicity (Table 1), thus influencing the electrostatic and hydrophobic interactions and analyte retention. Regarding the mobile phase containing 120 mM SDS and 10 mM NaH2PO4, a higher pH resulted in shorter retention times for all compounds (Table S5†). Such an outcome can be attributed to the higher pH corresponding to higher logD and lower ionization degree and thus favoring analyte uptake by micelles, suppressing the electrostatic interactions with SDS adsorbed on C18, and promoting elution. However, only pH 5 resulted in acceptable resolution. The predicted analyte pKa ranged from 3.71 to 3.86, which indicated that the positively charged analytes (at pH 3) were expected to interact with the SDS adsorbed on C18 and thus retain more strongly.
Regarding the cationic surfactant (CTAB), the elution was not significantly altered by the pH of the mobile phase (Table S6†). The retention time of HCO significantly increased as the pH increased to 7, and the corresponding retention time exceeded that of MCO. Regarding the predicted ionization, HCO was expected to be negatively charged at pH 7 and should therefore be more strongly retained by the cationic CTAB adsorbed on C18 than the other (almost neutral) analytes. However, the pH adjustment (pH 3, 5, and 7) of the CTAB-containing mobile phase did not afford acceptable HCO–C6O and C6O–MCO separations. In the case of the nonionic surfactant (Brij®35), the change in pH did not alter the retention time. Thus, analyte ionization did not produce a strong effect when the Brij®35-containing mobile phase was used, although the resolution decreased at pH 3 and 7 (Table S7†).
The aforementioned results indicate that the retention of canthin-6-one alkaloids during MLC is controlled by analyte ionization and hydrophobicity, also implying that the analyte separation is affected by electrostatic interactions. Thus, SDS (anionic surfactant) was concluded to provide an acceptable retention time and resolution for analytes with a partial positive charge. The combination of electrostatic and hydrophobic interactions between SDS and analytes has contributed to this MLC method. The effect of the pH of SDS-containing mobile phases on the resolution of ionizable analytes has been reported previously.17 In the case of CTAB, the charge of analytes has been also reported as an essential factor for achieving a good resolution.20 Thus, analyte ionization control is a very important factor to consider for retention time and resolution adjustment.
Effect of additives on analyte retention
The efficiency and elution strength of MLC can be enhanced through the addition of organic solvents. SDS (120 mM) supplemented with NaH2PO4 (10 mM) provided appropriate retention time and resolution. However, in our study, when the mobile phase did not contain any organic solvent, the results were irreproducible and repeated experiments resulted in peak transformation. In addition, upon repeated use of the C18 stationary phase, the resolution decreased. Initially, MLC was performed with 120 mM SDS at pH 3, without any organic solvent, with the total analysis time being less than 30 min (Table S2†). However, the retention times of C6OG, HCO, C6O, and MCO were extended upon repeated analyses using the same column, which indicated the low robustness of the non-additive MLC system. The exact reason of irreproducibility is unknown and requires further research. The analytes were ionized in mobile phase conditions and an ionized surfactant was used in the mobile phase; hence, ionic interactions play an important role in the elution behavior. Ion-pair chromatography required column equilibration because of surfactant adsorption, which could result in non-reproducible elution.13 Longer equilibration with the mobile phase may be required to achieve steady-state conditions and reproducibility. Alternatively, retention exhibits good reproducibility and can be adequately modeled using an organic solvent in the mobile phase, which can predict changes in retention times based on the composition of the mobile phase.11 Organic solvents including n-propanol, n-butanol, methanol, ethanol, and n-pentanol, are used in conditioning most MLC mobile systems.14Regarding the investigated additives (4% v/v), the retention time was decreased in the order of butanol > propanol > acetonitrile > propylene glycol (Table S8†). The highest resolution was obtained with acetonitrile, and higher acetonitrile contents resulted in lower retention times for all analytes. This reduction in retention time was ascribed to the competition between acetonitrile and SDS for adsorption on the C18 phase.13 The C6O–MCO resolution was the highest at an acetonitrile content of 4% (v/v) (Table S9†).
RSM-based parameter optimization
The SDS concentration (90, 110, and 130 mM), acetonitrile content (5, 10, and 15% v/v), and pH (3, 5, and 7) were selected for RSM-based optimization, which was performed in 17 experiments (12 experiments and five duplicates of center point) according to the BBD (Table S10†). The retention times of all analytes (Y1, Y2, Y3, and Y4) were expressed as functions of the independent variables using quadratic models and were correlated with the SDS concentration, acetonitrile content, and pH (Table S11†). The responses of Y1 and Y3 did not change significantly when the SDS concentration was increased to the maximal value (Fig. S1†). In addition, the adjustment of pH also limited the response, and the retention time change was largely restricted to pH 3–4. An increase in pH to >4 decreased the response rate and retention time (Fig. S1†). Thus, the adjustment of the surfactant concentration and pH limited the response of analyte retention time. A linear decrease in the retention time was observed with increasing acetonitrile content, exhibiting a greater effect on the retention time than the SDS concentration and pH (Fig. S1†). A linear decrease in the amount of adsorbed surfactant upon increase in the acetonitrile content of the mobile phase has been reported previously.13 However, high percentages of organic solvents may result in the disruption of the micelle structure. Acetonitrile (10% v/v) has been used as an additive for the analysis of some pharmaceuticals by MLC and proven to be more efficient at enhancing the MLC peak profiles obtained with SDS compared to methanol and n-propanol.21,22Variance analysis of the regression parameters revealed a significant lack of fit for Y1–Y4 (p < 0.05) due to the very low variance of the center point (110 mM SDS, 10% (v/v) acetonitrile, pH 5; Table S11†). The power factors for Y1–Y3 decreased in the order of X3 (pH) > X2 > X1 (Table S13†). X3 also had the largest effect on Y4 (Table S13†). This finding was ascribed to the fact that pH influences the analyte ionization and substantially affects the MLC retention. The X2X3 interaction contributed to the models of Y1, Y2, and Y4 (Fig. S2†). That is, the decrease in the retention time with decreasing acetonitrile content could be compensated by increasing the pH.
The resolution was considered as Y5, Y6, and Y7, with the corresponding fits constructed using reduced quadratic, two-factor interaction, and reduced quadratic models, respectively (Table S12†). The significant lack of fit observed for Y5 and Y7 was due to the lower variation in response regarding the center point. That is, the C6OG–HCO resolution decreased at low SDS concentrations and high pH values (Fig. S3†). The lower extent of analyte ionization may limit the separation capacity of SDS-based MLC. The X1X3 and X2X3 interactions significantly contributed to Y5 and Y6, respectively. A decrease in pH can maintain the resolution high while lowering the SDS concentration. Similarly, an interaction between the acetonitrile content and pH was observed (Fig. S4†).
Based on the experimental data, the C6O–MCO resolution was the limiting factor of the process. The separation of both compounds was also difficult to achieve even under the conventional HPLC conditions used for the simultaneous determination of all analytes. Based on the results of the RSM experiments, the optimal MLC conditions were determined as 110 mM SDS, 15% (v/v) acetonitrile, and pH 3.0. The retention times of C6OG, HCO, C6O, and MCO under optimal conditions were predicted as 3.70 [3.30–4.10, 95% Prediction Interval (PI)], 16.30 (14.34–18.67, 95% PI), 25.43 (22.93–28.28, 95% PI), and 36.23 (31.07–42.72) min, respectively, with the predicted C6OG–HCO, HCO–C6O, and C6O–MCO resolutions being 12.9 (11.8–14.1, 95% PI), 4.9 (3.8–6.3, 95% PI), and 3.0 (1.9–5.0, 95% PI), respectively. The retention times of C6OG, HCO, C6O, and MCO under optimal conditions were experimentally determined as 4.78 ± 0.06, 17.64 ± 0.27, 32.84 ± 0.78, and 39.04 ± 0.65 min, respectively, with the experimental C6OG–HCO, HCO–C6O, and C6O–MCO resolutions being 17.88 ± 1.86, 9.69 ± 0.72, and 2.80 ± 0.32, respectively. Although the run time of the optimal MLC was higher than that obtained with 120 mM SDS at pH 3 without any organic solvent, optimal MLC conditions with acetonitrile can provided stable peak shape and retention time. In addition, MLC with 110 mM SDS, 15% (v/v) acetonitrile, and pH 3.0 can provided higher resolution compared to 120 mM SDS at pH 3 without any organic solvent. The error of Y1 and Y3 was higher than 20%, with the models exhibiting significant lack of fit and low predicted R2. The other strategy of experimental design, central composite design (CCD), confirmed the model's predictability.17,23–25 Compared to BBD, CCDs require more experiments because they are designed with center points and additional axial points. Overall, the RSM was commonly applied for optimization of the MLC mobile phase, with the interaction and elution behavior of MLC being explored.
Based on the regression parameters, the models were fit for purpose despite the significant deviations from the experimental data observed for almost all models. Thus, RSM was successfully used to improve the C6O–MCO resolutions of MLC in a reproducible manner. In addition, the MLC elution behaviors of C6OG, HCO, C6O, and MCO were investigated. The pH of the mobile phase had a significant effect on the MLC elution strength and separation efficiency, which was ascribed to the influence of pH on the analyte ionization status. The separation selectivity of MLC was determined using 13-EEU, EU, CPA, CHA, SCO, and EUL (Fig. S5†). The compounds are reported as chemical constituents of the EL and EH extracts. 13-EEU and EU were not retained, while CHA, SCO, EUL, and CPA were eluted at 2.54, 4.11, 6.16, and 34.49 min, respectively. Thus, the peaks of the above compounds did not overlap with those of the target analytes.
System suitability
In the case of MLC, the retention times of C6OG, HCO, C6O, and MCO were 4.78 ± 0.06, 17.64 ± 0.27, 32.84 ± 0.78, and 39.04 ± 0.65 min, respectively, while the C6OG–HCO, HCO–C6O, and C6O–MCO resolutions equaled 17.88 ± 1.86, 9.69 ± 0.72, and 2.80 ± 0.32, respectively (Fig. 1A and B). For conventional HPLC, the retention times of C6OG, HCO, C6O, and MCO were 15.42 ± 0.00, 24.11 ± 0.01, 38.27 ± 0.02, and 39.86 ± 0.02 min, respectively, while the C6OG–HCO, HCO–C6O, and C6O–MCO resolutions equaled 49.07 ± 0.68, 38.86 ± 0.45, and 2.92 ± 0.03, respectively (Fig. 1C and D). Each chromatographic system achieved acceptable resolution (≥1.5). The asymmetry factors of C6OG, HCO, C6O, and MCO equaled 0.96 ± 0.05, 0.97 ± 0.06, 0.94 ± 0.05, and 1.04 ± 0.07 for MLC and 1.00 ± 0.02, 1.01 ± 0.05, 1.02 ± 0.03, and 1.01 ± 0.02, respectively, for conventional HPLC. The peak shapes were acceptable (<2) for both analytical methods. However, the HCO, C6O, and MCO peaks produced by MLC were broader than those produced by conventional HPLC. The plate numbers of C6OG, HCO, C6O, and MCO were determined as 3171 ± 687, 4292 ± 587, 4401 ± 209, and 4495 ± 554 for MLC and 161772 ± 1851, 228450 ± 10616, 83854 ± 2506, 79418 ± 646, respectively, for conventional HPLC. Thus, the column efficiency of the gradient conventional HPLC method exceeded that of the isocratic MLC (same column) method. Consequently, the application of isocratic MLC was limited to the simultaneous determination of large varied polar analytes. Previously, a gradient containing acetonitrile with Brij®35 yielded a significant reduction in peak widths and enhanced MLC resolution.26 Thus, resolution enhancement is possible.
 | ||
| Fig. 1 Chromatograms of authentic compounds at 50 μg mL−1 (A and C) and EL root extracts (B and D) obtained using MLC (A and B) and conventional HPLC (C and D) at a detection wavelength of 272 nm. The MLC conditions were 110 mM SDS, 15% (v/v) ACN, and pH 3. | ||
In summary, the runtimes of MLC and conventional HPLC were similar, but conventional HPLC required additional time and solvent for column re-equilibration before the next analysis. The corresponding per-run acetonitrile consumptions of MLC and conventional HPLC (including column re-equilibration) were estimated as ∼11 and ∼12 mL, respectively. Although ethanol is not commonly used as a modifier in MLC,22 the investigation of ethanol instead of acetonitrile should be included in further studies for diminishing acetonitrile consumption. In addition, natural deep eutectic solvents have been used as effective modifiers for green chemistry purposes.23,24
Comparative validations were performed to compare the analytical performances and applicabilities of the MLC and conventional HPLC methods.
Validation of MLC and conventional HPLC methods
Table 2 lists the performance metrics of MLC and conventional HPLC methods. The sensitivity of MLC was comparable to that of conventional HPLC. The LOQ was in the range of 0.62–1.90 μg mL−1 (MLC) and 0.42–1.48 μg mL−1 (conventional HPLC), while the coefficient of determination (R2) were 0.9995–0.9999 (MLC) and 0.9997–1 (conventional HPLC).| Analytical parameters | MLC | |||
|---|---|---|---|---|
| C6OG | HCO | C6O | MCO | |
| Linear range (μg mL−1) | 1.56–100 | 1.56–100 | 3.13–100 | 1.56–100 |
| Linearity equation | y = 0.1727x + 0.0013 | y = 0.399x + 0.0705 | y = 0.3308x − 0.13 | y = 0.3152x − 0.0787 |
| Coefficient of determination (R2) | 0.9999 | 0.9998 | 0.9995 | 0.9995 |
| LOD (μg mL−1) | 0.26 | 0.35 | 0.63 | 0.21 |
| LOQ (μg mL−1) | 0.79 | 1.06 | 1.90 | 0.62 |
| Analytical parameters | Conventional HPLC | |||
|---|---|---|---|---|
| C6OG | HCO | C6O | MCO | |
| Linear range (μg mL−1) | 1.56–100 | 1.56–100 | 1.56–100 | 1.56–100 |
| Linearity equation | y = 0.1556x + 0.0241 | y = 0.4452x − 0.0478 | y = 0.1388x + 0.0227 | y = 0.3893x − 0.1892 |
| Coefficient of determination (R2) | 1 | 1 | 0.9997 | 0.9998 |
| LOD (μg mL−1) | 0.32 | 0.14 | 0.35 | 0.49 |
| LOQ (μg mL−1) | 0.98 | 0.42 | 1.06 | 1.48 |
Based on the mass of extraction samples (200 mg) and analyte spiking concentration (12.5–50 μg mL−1), the suggested acceptable recovery was 85–110%.18 For all analytes, the recoveries were in the range of 92.6–105.9% (MLC) and 87.1–106.8% (conventional HPLC), which are acceptable in all cases.
The intraday and interday precisions (%RSD) of MLC/conventional HPLC were in the ranges of 0.19–2.10/0.07–6.09 and 1.95–6.46/1.44–5.26%, respectively (Table 3 and 4). Thus, both methods exhibited acceptable precision and accuracy under the investigated chromatographic conditions.
| Analyte | Spiked concentration (μg mL−1) | Measured concentration (μg mL−1) | Intraday precision (n = 3) | Interday precision (n = 3) | Recovery (%) |
|---|---|---|---|---|---|
| C6OG | 12.5 | 13.11 ± 0.34 | 1.20 | 2.58 | 105.8 |
| 25 | 26.00 ± 0.60 | 0.70 | 1.95 | 104.4 | |
| 50 | 51.06 ± 1.05 | 0.97 | 2.06 | 102.3 | |
| HCO | 12.5 | 12.15 ± 0.73 | 1.77 | 6.04 | 97.0 |
| 25 | 25.93 ± 1.46 | 1.34 | 5.64 | 103.6 | |
| 50 | 52.98 ± 2.00 | 1.59 | 3.78 | 105.9 | |
| C6O | 12.5 | 11.74 ± 0.60 | 0.42 | 5.11 | 95.2 |
| 25 | 23.35 ± 0.65 | 1.30 | 2.78 | 94.0 | |
| 50 | 46.12 ± 1.78 | 0.51 | 3.85 | 92.6 | |
| MCO | 12.5 | 12.88 ± 0.83 | 1.40 | 6.41 | 103.5 |
| 25 | 25.47 ± 1.37 | 2.10 | 5.37 | 102.1 | |
| 50 | 49.02 ± 3.16 | 0.19 | 6.46 | 98.1 |
| Analyte | Spiked concentration (μg mL−1) | Measured concentration (μg mL−1) | Intraday precision (n = 3) | Interday precision (n = 3) | Recovery (%) |
|---|---|---|---|---|---|
| C6OG | 12.5 | 12.87 ± 0.68 | 5.48 | 5.26 | 103.0 |
| 25 | 24.16 ± 1.10 | 1.92 | 4.57 | 96.6 | |
| 50 | 43.85 ± 1.18 | 0.07 | 2.40 | 87.7 | |
| HCO | 12.5 | 11.10 ± 0.19 | 0.23 | 1.85 | 89.1 |
| 25 | 21.75 ± 0.43 | 0.83 | 1.98 | 87.1 | |
| 50 | 44.34 ± 1.13 | 1.05 | 2.55 | 88.1 | |
| C6O | 12.5 | 12.39 ± 0.27 | 2.04 | 2.16 | 98.4 |
| 25 | 23.88 ± 0.40 | 1.32 | 1.69 | 95.2 | |
| 50 | 43.95 ± 1.10 | 3.16 | 2.51 | 87.7 | |
| MCO | 12.5 | 11.31 ± 0.51 | 6.09 | 4.49 | 91.2 |
| 25 | 26.61 ± 0.38 | 2.02 | 1.44 | 106.8 | |
| 50 | 45.19 ± 1.65 | 3.14 | 3.66 | 90.6 |
Application of MLC and conventional HPLC to the analysis of Eurycoma spp. extracts
The practical performances of MLC and conventional HPLC were compared through the analysis of 12 samples (Table 5). The determined analyte concentrations significantly differed between the two methods and were generally lower in the case of MLC. Only samples with high analyte concentrations (as determined by conventional HPLC) could be successfully analyzed by MLC. Analytes not detectable by conventional HPLC were also not detectable by MLC, i.e., MLC did not generate false positive results. Regarding the analysis of samples spiked with authentic analytes, the retention times did not deviate significantly from those of reference analytes. Thus, the same matrix did not substantially impact the proposed MLC method. However, different samples of EL and EH had different matrices. The contents of analytes, analogs, and interferences in the same plant species can broadly vary because of environmental impacts. The contents of HCO, C6O, and MCO in the investigated EL and EH samples were determined as 0.01–0.69, 0.0–0.86, and 0.0–0.29 mg g−1, respectively.1 The broad peaks (low column efficacy) observed for MLC complicated the analysis of real plant samples with low analyte concentrations and large matrix variabilities. The characteristics of plant samples may be the reason for the lack of correlation between the results of the two methods.| Samplea | Analyte concentration (μg mL−1) | |||||||
|---|---|---|---|---|---|---|---|---|
| C6OG | HCO | C6O | MCO | |||||
| MLC | Conventional HPLC | MLC | Conventional HPLC | MLC | Conventional HPLC | MLC | Conventional HPLC | |
| a Stem and root samples of EL and EH were obtained from various locations (district, province). Samples 1–12 correspond to EL stem (Khongjiam, Ubon Ratchathani), EL root (Khongjiam, Ubon Ratchathani), EL root 1 (Nopphitam, Nakhon Si Thammarat), EL root 2 (Nopphitam, Nakhon Si Thammarat), EL root 3 (Nopphitam, Nakhon Si Thammarat), EL root 4 (Nopphitam, Nakhon Si Thammarat), EL root (Thasala, Nakhon Si Thammarat), EL root (Than-To, Yala), EL root (Phanom, Surat Thani), EH root 1 (Sirindhorn, Ubon Ratchathani), EH root 2 (Sirindhorn, Ubon Ratchathani), and EH root (Tha Bo, Nong Khai), respectively. ND: not detectable. <LOQ: less than LOQ of the method. | ||||||||
| 1 | ND | ND | ND | 0.79 ± 0.01 | ND | ND | ND | 5.02 ± 0.04 |
| 2 | 2.54 ± 0.14 | 8.26 ± 0.12 | ND | 2.12 ± 0.04 | ND | 5.08 ± 0.27 | ND | 6.05 ± 0.09 |
| 3 | ND | ND | ND | 0.93 ± 0.01 | ND | ND | 4.16 ± 0.11 | 7.66 ± 0.02 |
| 4 | 1.00 ± 0.04 | 6.80 ± 0.02 | ND | 3.59 ± 0.03 | <LOQ | ND | 15.86 ± 0.55 | 21.28 ± 0.04 |
| 5 | 4.20 ± 0.17 | 9.46 ± 0.18 | 1.35 ± 0.06 | 6.85 ± 0.19 | 3.73 ± 0.16 | 4.20 ± 0.09 | 40.96 ± 0.52 | 48.55 ± 0.90 |
| 6 | ND | 6.48 ± 0.25 | ND | 2.83 ± 0.04 | ND | ND | 8.29 ± 0.023 | 13.86 ± 0.60 |
| 7 | ND | 4.68 ± 0.01 | ND | 0.75 ± 0.01 | ND | ND | ND | 4.58 ± 0.00 |
| 8 | ND | 4.55 ± 0.01 | ND | 0.92 ± 0.01 | <LOQ | 6.72 ± 0.08 | 3.62 ± 0.10 | 7.74 ± 0.03 |
| 9 | ND | ND | ND | ND | ND | ND | ND | ND |
| 10 | 14.63 ± 0.78 | 14.93 ± 0.16 | 4.92 ± 0.07 | 8.48 ± 0.07 | 4.88 ± 0.03 | 7.81 ± 0.23 | 7.18 ± 0.11 | 10.07 ± 0.07 |
| 11 | 9.65 ± 0.25 | 18.18 ± 0.12 | 5.87 ± 0.21 | 14.84 ± 0.06 | 12.73 ± 0.13 | 36.43 ± 0.23 | 7.87 ± 0.18 | 11.92 ± 0.03 |
| 12 | ND | ND | ND | 2.69 ± 0.08 | ND | ND | 1.78 ± 0.07 | 5.64 ± 0.06 |
C6OG was determined in 5 out of 12 samples analyzed with MLC and in 8 out of 12 samples analyzed with conventional HPLC, with the two methods being in agreement only for sample 10. MLC detected HCO, C6O, and MCO in 3, 3, and 8 out of 12 samples, respectively, whereas conventional HPLC detected these analytes in 11, 5, and 11 out of 12 samples, respectively. Both methods yielded similar C6O concentrations for sample 5 and similar MCO concentrations for samples 5, 10, and 11. The applicability of MLC was limited by large peak widths compared to those obtained for conventional HPLC. However, a third analytical method such as LC-MS/MS may be used for additional comparisons aiming to evaluate the MLC performance.
RSM results suggest that the analyte ionization significantly influenced elution, implying that the ionic interactions between analytes and SDS played a major role in determining the MLC performance. This performance may also be influenced by other ionizable interferences present in EL and EH extracts obtained from samples with various matrices. Other canthin-6-one derivatives have been detected in EL roots and stems, e.g., 10-hydroxycanthin-6-one (predicted strongest basic pKa = 4.03), 9,10-dimethoxycanthin-6-one (predicted strongest basic pKa = 4.19), 10-hydroxy-9-methoxycanthin-6-one, 11-hydroxy-10-methoxycanthin-6-one, 5,9-dimethoxycanthin-6-one, and 9-methoxy-3-methylcanthin-5,6-dione.3,27 In addition, β-carboline alkaloids have been detected in EL, e.g., 7-hydroxy-β-carboline-1-propionic acid (predicted strongest basic pKa = 5.09 and strongest acidic pKa = 4.14), 1-methoxymethyl-β-carboline (predicted strongest basic pKa = 4), β-carboline-1-propionic acid, and 7-methoxy-β-carboline-1-propionic acid.3 The ionized forms of these compounds in the matrix may competitively bind surfactants and thus limit the MLC capacity. In addition, interferences with carboxylic acid groups may competitively bind analytes and thus prevent them from interacting with SDS. Therefore, mobile phases containing nonionic surfactants should be examined to reduce the adverse effects of ionic interactions.
Conclusions
MLC was used to separate canthin-6-one alkaloids contained in Eurycoma spp. extracts; it was revealed that the elution behavior of these alkaloids depends on their hydrophobicity and ionization behavior. The anionic surfactant (SDS) was superior to cationic (CTAB) and nonionic (Brij®35) surfactants. Under the investigated conditions, the analytes might be neutral or ionized forms. Under optimal conditions, the acetonitrile consumption of MLC was similar to that of conventional HPLC. Both methods exhibited similar sensitivities, accuracies, and precisions. However, MLC was of limited applicability to plant extracts with low analyte concentrations and varied matrices. Thus, the impact of matrix interference should be further reduced to enhance the applicability of MLC for Eurycoma spp. phytochemical analysis.Author contributions
Attapon Sakdamas: conceptualization, formal analysis, funding acquisition, investigation, methodology, visualization, writing – original draft; Fonthip Makliang: methodology, writing – review and editing; Waraporn Putalun: conceptualization, methodology, resources, writing – review and editing; Thaweesak Juengwatanatrakul: writing – review and editing, resources; Tripetch Kanchanapoom: writing – review and editing, resources; Seiichi Sakamoto: methodology, writing – review and editing; Gorawit Yusakul: conceptualization, formal analysis, funding acquisition, methodology, project administration, resources, supervision, visualization, writing – review and editing. All authors approved of the version to be published.Conflicts of interest
There are no conflicts to declare.Acknowledgements
This work was supported by Walailak University Master Degree Excellence Scholarships (contract no. ME09/2021), Walailak University Scholarships for High Potential Candidates to Enroll in Master Programs (contract no. 01/2564), and Walailak University (grant no. RSPG-WU-02/2566).References
- J. Chaingam, T. Juengwatanatrakul, G. Yusakul, T. Kanchanapoom and W. Putalun, J. AOAC Int., 2021, 104, 802–810 CrossRef PubMed.
- P. C. Kuo, A. G. Damu, K. H. Lee and T. S. Wu, Bioorg. Med. Chem., 2004, 12, 537–544 CrossRef CAS PubMed.
- S. U. Rehman, K. Choe and H. H. Yoo, Molecules, 2016, 21, 331 CrossRef PubMed.
- H. E. Thu, I. N. Mohamed, Z. Hussain, P. A. Jayusman and A. N. Shuid, Chin. J. Nat. Med., 2017, 15, 71–80 Search PubMed.
- H. E. Thu, Z. Hussain, I. N. Mohamed and A. N. Shuid, Curr. Drug Targets, 2018, 19, 1657–1671 CrossRef CAS PubMed.
- L. Farouil, M. Sylvestre, A. Fournet and G. Cebrián-Torrejón, Eur. J Med. Chem. Rep., 2022, 5, 100049 CAS.
- R. Choonong, J. Chaingam, R. Chantakul, S. Mukda, P. Temkitthawon, K. Ingkaninan, T. Juengwatanatrakul, G. Yusakul, T. Kanchanapoom and W. Putalun, Chem. Biodivers., 2022, 19, e202200121 CrossRef CAS PubMed.
- W. F. Chiou and T. S. Wu, J. Sex. Med., 2012, 9, 1027–1036 CrossRef CAS PubMed.
- S. Tan, K. H. Yuen and K. L. Chan, Planta Med., 2002, 68, 355–358 CrossRef CAS PubMed.
- J. Chaingam, T. Juengwatanatrakul, G. Yusakul, T. Kanchanapoom and W. Putalun, Planta Med., 2019, 85, P030 Search PubMed.
- M. J. Ruiz-Ángel, M. C. García-Álvarez-Coque and A. Berthod, Sep. Purif. Rev., 2009, 38, 45–96 CrossRef.
- A. W. Sobańska and E. Brzezińska, J. Liq. Chromatogr. Relat. Technol., 2019, 42, 227–237 CrossRef.
- M. J. Ruiz-Ángel, S. Carda-Broch, J. R. Torres-Lapasió and M. C. García-Álvarez-Coque, J. Chromatogr. A, 2009, 1216, 1798–1814 CrossRef PubMed.
- E. Patyra and K. Kwiatek, J. Sep. Sci., 2021, 44, 2206–2220 CrossRef CAS PubMed.
- T. Kanchanapoom, R. Kasai, P. Chumsri, Y. Hiraga and K. Yamasaki, Phytochemistry, 2001, 56, 383–386 CrossRef CAS PubMed.
- T. Kanchanapoom, R. Kasai, P. Chumsri and K. Yamasaki, Phytochemistry, 2001, 57, 1205–1208 CrossRef CAS PubMed.
- A. E. Ibrahim, A. A. Elmaaty and H. M. El-Sayed, Anal. Bioanal. Chem., 2021, 413, 5051–5065 CrossRef CAS PubMed.
- AOAC Guidelines, Official Methods of Analysis, AOAC International, Gaithersburg, MD, 2019, Appendix K: Guidelines for Dietary Supplements and Botanicals Search PubMed.
- M. Rambla-Alegre, J. Peris-Vicente, J. Esteve-Romero and S. Carda-Broch, Food Chem., 2010, 123, 1294–1302 CrossRef CAS.
- C. Martinez-Algaba, J. M. Bermudez-Saldana, R. M. Villanueva-Camanas, S. Sagrado and M. J. Medina-Hernandez, J. Pharm. Biomed. Anal., 2006, 40, 312–321 CrossRef CAS PubMed.
- D. El Sherbiny and M. E. K. Wahba, Open Chem., 2020, 18, 377–390 CAS.
- M. J. Ruiz-Angel, J. R. Torres-Lapasio, S. Carda-Broch and M. C. Garcia-Alvarez-Coque, J. Chromatogr. A, 2010, 1217, 7090–7099 CrossRef CAS PubMed.
- A. M. Ramezani, R. Ahmadi and G. Absalan, J. Chromatogr. A, 2020, 1610, 460563 CrossRef CAS PubMed.
- A. M. Ramezani and G. Absalan, J. Pharm. Biomed. Anal., 2020, 186, 113259 CrossRef CAS PubMed.
- A. M. Ramezani, G. Absalan and R. Ahmadi, Anal. Chim. Acta, 2018, 1010, 76–85 CrossRef CAS PubMed.
- E. Peris-Garcia, C. Ortiz-Bolsico, J. J. Baeza-Baeza and M. C. Garcia-Alvarez-Coque, J. Sep. Sci., 2015, 38, 2059–2067 CrossRef CAS PubMed.
- K. Mitsunaga, K. Koike, T. Tanaka, Y. Ohkawa, Y. Kobayashi, T. Sawaguchi and T. Ohmoto, Phytochemistry, 1994, 35, 799–802 CrossRef CAS.
Footnote |
| † Electronic supplementary information (ESI) available. See DOI: https://doi.org/10.1039/d2ra07034k |
| This journal is © The Royal Society of Chemistry 2023 |