 Open Access Article
Study of the denitration performance of a ceramic filter using a manganese-based catalyst
Zhenzhen Wang ab,
Shuchuan Penga,
Chengzhu Zhu
 a,
Bin Wangc,
Bo Dua,
Ting Cheng
 a,
Zhaozhong Jianga and
Lei Sun
 *b
*b
aSchool of Resource and Environmental Engineering, Hefei University of Technology, Hefei, 230009, China
bAnhui Academy for Ecological and Environmental Science Research, Hefei, 230071, China. E-mail: sunlei551@qq.com
cCNBM Environmental Protection Research Institute(Jiangsu)Co., Ltd., Yancheng, 224051, China
First published on 21st December 2022
Abstract
A MnOx/γ-Al2O3 catalyst was prepared by impregnation of manganese acetate and alumina. After optimizing the composition, it was loaded into a ceramic filter (CF) by a one-step coating method. The results show that MnOx/γ-Al2O3 had the best denitration activity when the Mn loading was 4 wt% with a calcination temperature of 400 °C. The MnOx/γ-Al2O3 catalyst ceramic filter (MA-CCF) was made by loading the CF twice with MnOx/γ-Al2O3. When face velocity (FV) was 1 m min−1, MA-CCF displayed more than 80% NO conversion at 125–375 °C and possessed a good resistance of H2O and SO2. The abundant surface adsorbed oxygen, dense membrane and high-density fiber structure on the outer layer of CF effectively protected the catalyst and could improve MA-CCF denitration activity. The multiple advantages of MA-CCF made it possible for good application prospects.
1 Introduction
The glass industry is an important industry related to economic development and people's life, but the emission of furnace flue gas seriously affects the atmospheric environment. The outlet temperature of glass furnace flue gas is 450–550 °C, and the temperature after waste heat recovery is about 150–300 °C. While the NOx concentration of glass furnaces fueled by natural gas is 1800–2870 mg m−3, the SO2 concentration is 100–500 mg m−3, and the particulate matter concentration is 80–280 mg m−3, respectively.1–3 At present, the flue gas treatment system widely used in industrial kilns is a tandem technique composed of a dust collector, desulfurization equipment and SCR. But it requires complex processes, large floor space, and high investment.4,5 Compared with the traditional technique, a catalyst ceramic filter (CCF) has an advantageous corrosion tolerance, high-temperature tolerance and does not need production to be stopped when it is replaced. Its dense external film and internal fiber can remove 99% of the dust in the flue gas, and the internally loaded catalyst can react with NOx in the gas flow to decompose it into N2 and H2O. Due to its ability to synchronize the dust removal and denitration of the exhaust gas in a set of devices, the CCF has great application prospects in the glass industry.Choi et al.6–8 developed a V2O5–WO3/TiO2-based CCF with good high-temperature tolerance by a coating process applying centrifugal force. The NO conversion was more than 95% at 320 °C. Heidenreich et al.9,10 studied the pilot tests of a V2O5–WO3/TiO2-based CCF in a 3.5 WMth biomass combustion plant, and showed that the denitration conversion reached 83.3ϖ% (NH3![[thin space (1/6-em)]](https://www.rsc.org/images/entities/char_2009.gif) :
:![[thin space (1/6-em)]](https://www.rsc.org/images/entities/char_2009.gif) NO = 0.87) under the working conditions of 300 °C and face velocity (FV) of 2.5 cm s−1. An et al.11 used the sol–gel method to load the TiO2 on the ceramic filter and then loaded V2O5 to prepare V2O5–TiO2 CCF, and NO conversion reached about 80% at 350 °C. Yu et al.12 prepared V2O5–WO3–MoO3/TiO2 catalytic filter by coating method, and the denitrification efficiency was greater than 90% at 220–380 °C. Their experiments found that catalysts with high vanadium content had more active sites, the agglomeration of particles was more severe at high temperatures. The strong adsorption capacity of agglomerated particles led to the increase of ammonia nitrogen content, which led to the decrease of catalyst selectivity. Zhang et al.13 studied cordierite catalytic filters by one-step and two-step processes and found the one-step process promoted catalyst dispersion in cordierite and had better N2 selectivity. Generally, the catalyst loaded on the CF is V2O5–WO3/TiO2, it is expensive, its operating temperature window is high and narrow (300–400 °C). The melting and volatilization of vanadium release toxic gases, causing secondary pollution. The potential task for applying the CCF in the industry with low flue gas temperature (150–300 °C) is how to widen temperature window by replacing the catalyst.13–16
NO = 0.87) under the working conditions of 300 °C and face velocity (FV) of 2.5 cm s−1. An et al.11 used the sol–gel method to load the TiO2 on the ceramic filter and then loaded V2O5 to prepare V2O5–TiO2 CCF, and NO conversion reached about 80% at 350 °C. Yu et al.12 prepared V2O5–WO3–MoO3/TiO2 catalytic filter by coating method, and the denitrification efficiency was greater than 90% at 220–380 °C. Their experiments found that catalysts with high vanadium content had more active sites, the agglomeration of particles was more severe at high temperatures. The strong adsorption capacity of agglomerated particles led to the increase of ammonia nitrogen content, which led to the decrease of catalyst selectivity. Zhang et al.13 studied cordierite catalytic filters by one-step and two-step processes and found the one-step process promoted catalyst dispersion in cordierite and had better N2 selectivity. Generally, the catalyst loaded on the CF is V2O5–WO3/TiO2, it is expensive, its operating temperature window is high and narrow (300–400 °C). The melting and volatilization of vanadium release toxic gases, causing secondary pollution. The potential task for applying the CCF in the industry with low flue gas temperature (150–300 °C) is how to widen temperature window by replacing the catalyst.13–16
Mn-based catalyst has become the research focus of SCR catalyst due to wider temperature windows and variable valence states.17,18 Zhou et al.19 discovered MnOx/α-Fe2O3 achieved over 90% NO conversion at 200–350 °C. Wang et al.20 found that the formation of amorphous MnOx had better SCR performance and good resistance to SO2 and H2O. γ-Al2O3 is often used as support catalytic adsorbents because of its ideal pore structure and many hydroxy groups on its surface.21,22 However, the combination of manganese-based catalysts with CF and the influence of CF structure on the SCR reaction of the catalyst are not introduced in the research.
In present study, MnOx/γ-Al2O3 was optimized by studying the loading number of active components and calcination temperature. The MnOx/γ-Al2O3 catalyst ceramic filter (MA-CCF) was successfully synthesized by the one-step method. The MA-CCF was applied to the SCR of NO with NH3. Compared with conventional V2O5–WO3/TiO2-based CCF, it maintained higher SCR activity over a wider temperature range. The effects of FV, H2O, SO2 and Na on NO conversion were investigated. Moreover, the mechanisms of reaction and poisoning were revealed by using XRD, SEM, BET, and XPS techniques. We hope the study can provide theoretical support for the development of potential, stable and more widely used catalytic ceramic filters.
2 Materials and methods
2.1 Preparation of manganese-based catalyst ceramic filter
The ceramic filter (CF) (JiangSu SaiTu New Material Technology Co., Ltd) was treated into a cylinder (L20 mm × Φ16 mm). After washing, acid treatment, and alkali treatment, it was dried at 100 °C and subsequently calcined at 400 °C for 3 h in a muffle furnace.In this experiment, all the catalysts were prepared by the impregnation method. A certain amount of Mn (CH3COO)2·4H2O (99.9%, Guang Fu, Tianjin, China) was measured and added to deionized water and stirred to form an aqueous solution. A certain amount of γ-Al2O3 (AR, Sinopharm Chemical Reagent, China) added in the solution. The mixture was stirred violently for 2 h and aged for 12 h at room temperature. After that, the immersion products were dried at 100 °C and calcined for 4 h. The as-catalyst was pressed and screened into granules (40–60 mesh). Catalyst samples were denoted as xMnOx/γ-Al2O3 (MA), where x indicated x wt% of Mn in the catalyst.
The MA was loaded to the CF by a single-step coating method. Polyethylene glycol (PEG) was dissolved in distilled water, then added to the catalyst with a solid–liquid ratio of 20%, and stirred for 0.5 h. The pretreatment CF was placed in a beaker and sonicated for 5 min at 40 °C. After drying, it was recorded as a load once. Finally, the samples were calcined at 400 °C for 4 h, denoted as MA(y)-CCF, where y indicated the loading number of times with the catalyst. Simulated alkali metal poisoning was prepared by impregnation.
2.2 Sample characterization
X-ray diffraction (XRD) measurement was carried out on D/max 2500 V (Rigaku, Japan) using CuKα radiation, the diffraction angle (2θ) ranges from 5–75°. An automatic surface area and porosity analyzer (3H-2000PS2) was used to measure the N2 adsorption isotherm and the specific surface area at 77 K. Pore volume and average pore diameter were obtained by the Barrett–Joyner–Halenda (BJH) method. The atomic valence content of the catalyst surface was determined by an X-ray Photoelectron Spectroscopy (XPS, Thermo, America). A new field-emission scanning electron microscopy (SEM, SU8032, Hitachi, Japan) was used to observe the sample microstructure with a voltage range of 0.1–30 kV.2.3 Catalytic performance test
The loading rate (ω) is used to represent the coating firmness. ω is calculated according to the eqn (1):
 | (1) |
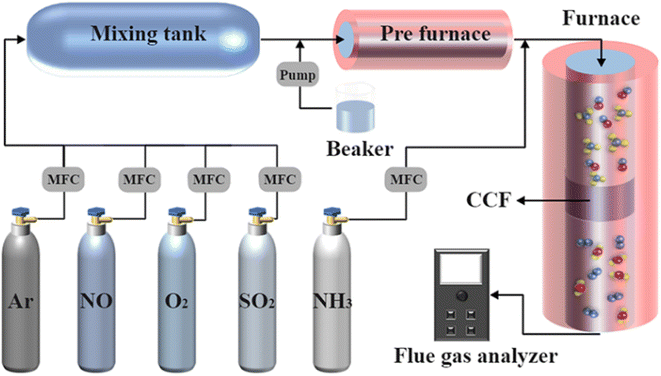
As shown in Fig. 1, the catalytic performance of the catalyst and the MA(y)-CCF were tested in the fixed-bed quartz reactor. The device comprised three units: gas distribution system, catalytic reaction system, and gas analysis system. The composition of the feed gas was as follows: 500 ppm NH3, 500 ppm NO, 3 vol% O2, 100 ppm SO2 (when used), 10 vol% H2O (when used), balanced with Ar. The total volume of gas in the catalyst activity measurement was 300 mL min−1 (GHSV = 35![[thin space (1/6-em)]](https://www.rsc.org/images/entities/char_2009.gif) 000 h−1). When MA(y)-CCF conducted the performance test, the gas volume was adjusted corresponding to the FV for 1 m min−1. The gas analysis system was equipped with a portable gas analyzer to detect the flue gas composition. The NO conversion is calculated as:
000 h−1). When MA(y)-CCF conducted the performance test, the gas volume was adjusted corresponding to the FV for 1 m min−1. The gas analysis system was equipped with a portable gas analyzer to detect the flue gas composition. The NO conversion is calculated as:
 | (2) |
3 Results and discussion
3.1 The optimal preparation of the MA(y)-CCF
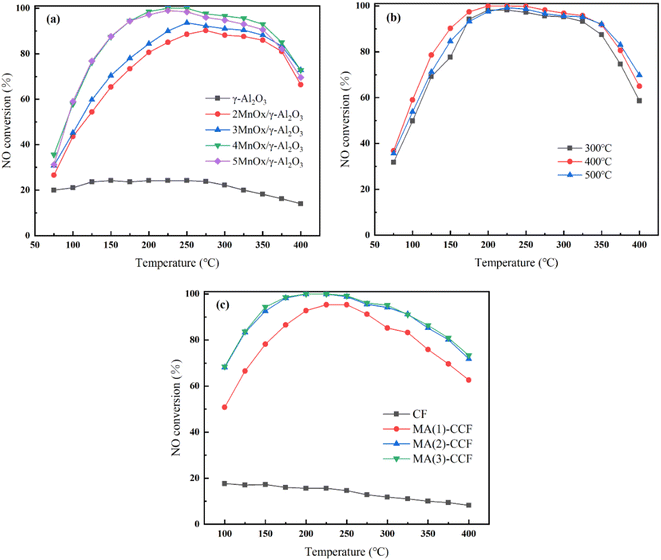 | ||
| Fig. 2 NO conversion of (a) γ-Al2O3 and xMnOx/γ-Al2O3 (b) 4MnOx/γ-Al2O3 with different calcination temperature (c) CF and MA(y)-CCF. | ||
The calcination temperature directly influences the catalyst's internal structure and the active component's dispersion in the support.26 NO conversion of 4MnOx/γ-Al2O3 with different calcination temperatures is shown in Fig. 2(b). When the calcination temperature was 300 °C, the NO conversion was mainly reduced, probably due to the temperature being too low and the active component not completely decomposed.27–29 When calcination was carried out 500 °C, the overall catalytic efficiency was decreased distinctly. Excessively high calcination temperatures could strengthen crystallinity of the catalyst.30–32 Furthermore, the phenomenon of sintering and melting blocked the catalyst pore size and decreased specific surface area. It reduced the catalyst contact area with NO and the catalytic efficiency.33,34 400 °C was chosen as calcination temperature for the catalyst.
| Sample | MA(1)-CCF | MA(2)-CCF | MA(3)-CCF |
|---|---|---|---|
| The loading number of times | 1 | 2 | 3 |
| The loading rate(%) | 9.7% | 18.4% | 20.1% |
The denitration efficiency of the blank CF was poor in Fig. 2(c). The highest NO conversion was only 17.6%. The NO conversion of MA(1)-CCF was 95.3% at 250 °C, and the NO conversion was >80% at 175–325 °C. Due to the increase in the catalyst loading, the denitration efficiency of the MA(2)-CCF significantly improved. It achieved 100% NO conversion at 200–250 °C, and NO conversion was above 80% at 125–375 °C. The denitration efficiency of MA(3)-CCF did not clearly improve compared with the second load. Considering the cost, MA(2)-CCF was selected for follow-up studies.
3.2 Characterization
| Test samples | Mn3+ | Mn4+ | Mn4+/(Mn4+ + Mn3+) | Binding energy at Oα | Binding energy at Oβ | Oα/(Oα + Oβ) |
|---|---|---|---|---|---|---|
| γ-Al2O3 | — | — | — | 531.7 | 530.5 | 40.8% |
| 4MnOx/γ-Al2O3 | 642.0 | 643.3 | 57.1% | 531.9 | 530.5 | 53.3% |
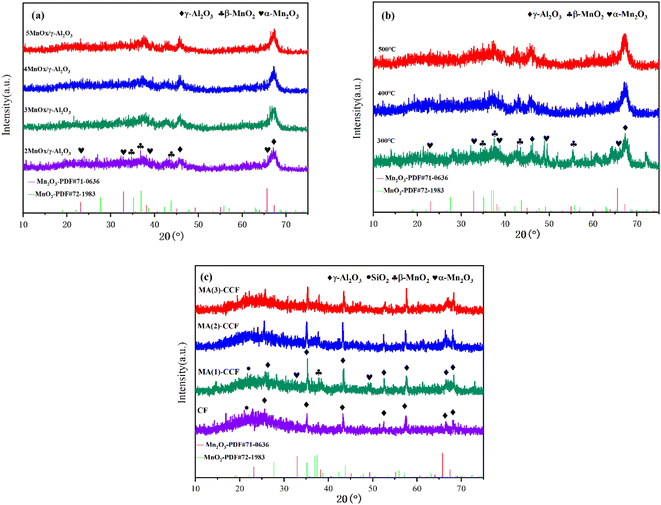
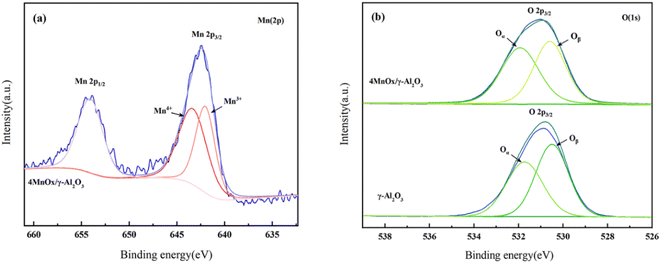
The Mn 2p XPS spectra of 4MnOx/γ-Al2O3 in Fig. 4(a) included two characteristic peaks, Mn2p1/2 and Mn2p3/2. Combined with the XRD results, it could be concluded that MnOx was present in the prepared catalyst samples, and the valence of Mn was mainly +3 and +4. The Mn4+ concentration was 57.1%, indicating that the catalyst contained more MnO2 than Mn2O3. The higher valence state of Mn4+ was more active for NH3-SCR reaction than Mn3+ 38,39. On the other hand, Mn3+ was more capable of promoting the conversion of NO to N2.40–42 Furthermore, each valence state's unbalanced content promoted oxygen vacancies on the catalyst surface,43,44 further enhancing the catalyst's SCR activity.
The O 1s XPS spectra of 4MnOx/γ-Al2O3 and γ-Al2O3 were implied in Fig. 4(b). The spectrum was fitted to two characteristic peaks, indicating that the sample contained two different kinds of oxygen species. The characteristic peaks between 528.9 eV and 530.8 eV at the binding energy corresponds to the lattice oxygen, O2− (denoted as Oβ) and the peaks between 530.8 eV and 533.33 eV at the binding energy corresponds to the surface chemisorbed adsorbed oxygen, O− (denoted as Oα).45–47 Surface-adsorbed oxygen was significantly more mobile than lattice oxygen.48–50 It was also more reactive in SCR reaction and was quickly replenished from oxygen in the flue gas, making the surface-absorbed oxygen more conducive to the catalytic oxidation of NOx.40,51 The amount of surface-adsorbed oxygen and the proportion of adsorbed oxygen dissociating into active oxygen determined the catalyst activity,52–54 so a higher Oα ratio represented higher catalyst oxidation activity.55 The addition of the active component increased the Oα/(Oα + Oβ) ratio on the surface of the sample from 40.8% to 53.3% (Table 2), and MnOx enhanced the SCR activity of the catalyst.
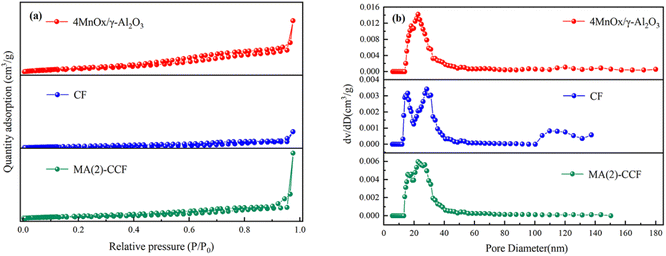
 isotherms with H3 hysteresis loop, indicating typical mesoporous characteristics. 4MnOx/γ-Al2O3 showed a large specific surface area (Fig. 6(a)). Generally, the larger the specific surface area of the catalyst could provide the more active sites, which was conducive to the adsorption and activation of the reactants.56,57 The pore size of CF was mainly distributed between 10–40 nm (Fig. 6(b)). This indicated it had a dense internal structure with a high dust removal performance. Some pores of CF lay between 100 and 140 nm, which might be because some ceramic fibers were finer, resulting in larger pore sizes between the fibers. The pore size of 4MnOx/γ-Al2O3 was mainly distributed between 20–40 nm. After the catalyst loading, the pore size of MA(2)-CCF was decreased. But the specific surface area of MA(2)-CCF was increased, which provided more space for NH3 and NO adsorption.58 The increase in the pore volume of MA(2)-CCF was because some holes whose walls were destroyed become larger holes in the preparation process.
| Sample | Specific surface area/(m2 g−1) | Pore volume/(cm3 g−1) | Average pore size/(nm) |
|---|---|---|---|
| 4MnOx/γ-Al2O3 | 109.03 | 0.51 | 9.41 |
| CF | 17.21 | 0.16 | 1.80 |
| MA(2)-CCF | 52.81 | 0.65 | 2.45 |
3.3 Catalytic activity test of the MA(2)-CCF
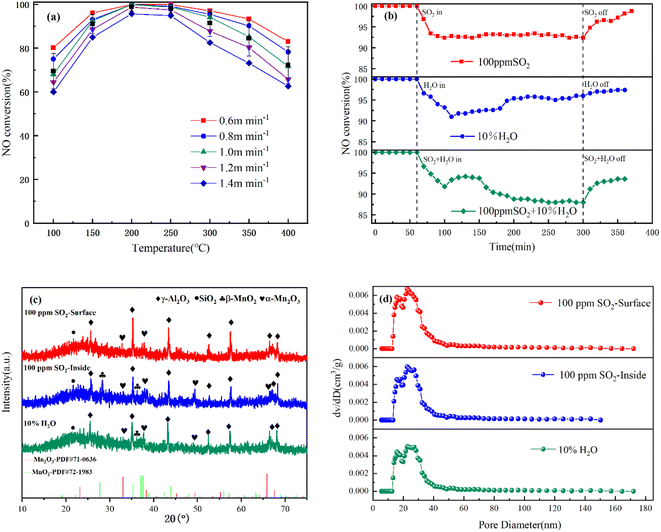
As shown in Fig. 7(b), when 100 ppm SO2 was introduced, the NO conversion of MA(2)-CCF dropped slightly to 92.4%. Additionally, when the SO2 supply was cut off, the NO conversion gradually recovered to 98.8%. When 10% H2O was added to the reaction gas, the NO conversion first decreased and then increased. The NO conversion dropped as low as 91.8% and finally stabilized at about 95%. Compared with SO2, adding H2O had a more significant impact on the iteration efficiency in a short period. After cutting off the supply of H2O, it recovered to 97.5%. Then, 100 ppm SO2 and 10% H2O were introduced, and the NO conversion of MA(2)-CCF gradually decreased and stabilized at about 88%. When the supply of the two components was cut off, the NO conversion gradually recovered to 93.6%. Therefore, MA(2)-CCF had good water and sulfur tolerance.
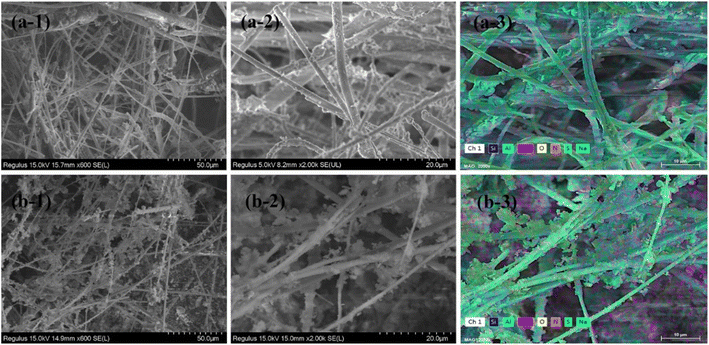
After the sulfur resistance experiment, the characteristic peak of MnOx on the surface of the MA(2)-CCF become weaker (Fig. 7(c)), indicating that MnOx and SO2 might have formed Mn(SO4)2.60–62 The specific surface area and average pore size were reduced, and the number of pores around 15 nm was increased (Fig. 7(d)), we hypothesized that the generated Mn(SO4)2, NH4(SO4)2, and NH4HSO2 blocked the large pores.63–65 However, the change in the characteristic peak of MnOx inside MA(2)-CCF was small. There was no apparent change in the pore size between fibers, which indicated the dense membrane and high-density fiber on the outer layer of the CF could effectively protect the catalyst loaded inside it and reduce the influence of SO2 on the catalyst.
After the water resistance experiment, the XRD result of MA(2)-CCF was poisoned by H2O was not much different from MA(2)-CCF, indicating that H2O did not destroy the material composition of the CCF. The effect of H2O on denitration efficiency was mainly in two aspects. First, in a high-temperature environment, high-temperature water vapor could destroy the support structure.66 BET results in Fig. 7(d) showed that the specific surface area of the MA(2)-CCF after 10% H2O decreased and average pore size increased, indicating that the high-temperature water vapor damaged the structure of the MA(2)-CCF. Additionally, it led to catalyst agglomeration, reducing the contact area between the catalyst and the airflow, and reducing the catalyst utilization rate.
Secondly, the catalyst adsorbed H2O to form surface –OH, which covered the surface-active sites, hindered the adsorption of NH3 and NO, and reduced the catalytic efficiency of the catalyst.67,68 However, in a higher-temperature environment, –OH desorption was also faster. When the effect of structural damage dropped to the threshold, the –OH desorption weakened the inhibitory effect of H2O. The rebound of NO conversion was consistent with the experimental result.
The denitration efficiency of MA(2)-CCF was significantly reduced after Na poisoning (Fig. 8(a)). 225 °C was found to be the optimum temperature for denitration activity of MA(2)-CCF. When Na was 1% of the weight of the catalyst, the NO conversion dropped to 83%. However, when the mass fraction of Na was increased, the NO conversion of MA(2)-CCF did not decrease sufficiently.
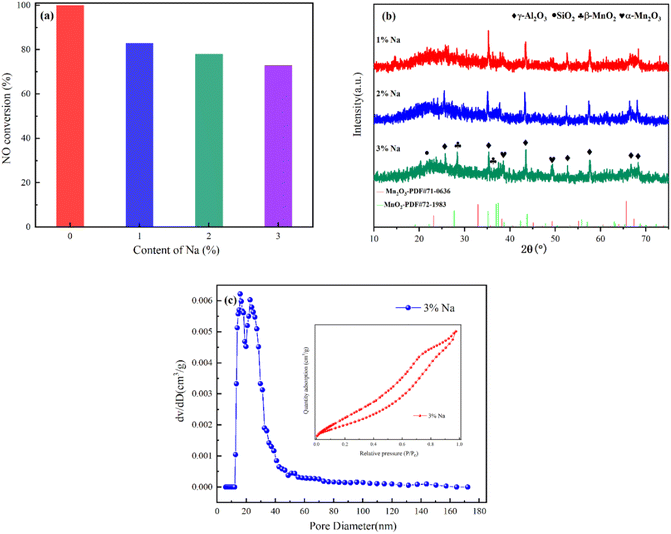 | ||
| Fig. 8 (a) NO conversion (b) XRD spectrum (c) N2 absorption and desorption curves and pore size distribution of MA(2)-CCF are poisoned by Na at 225 °C. | ||
There was no diffraction peak of Na in MA(2)-CCF after Na poisoning, which might be due to the low content of Na2O or the existence of an amorphous form (Fig. 8(b)). After alkali poisoning, the denitration performance of the CCF was decreased. However, the specific surface area increased, indicating that the specific surface area was not the only factor affecting alkali metals' denitration efficiency. Wang et al.71 modified V2O5–WO3/TiO2 with Nb and BET analysis and verified this result. The decrease in pore volume and average pore size and the increase in the number of pores between 10 and 20 nm in the pore size distribution were shown in Fig. 8(c). It proved one of the ways that alkali metals poison the catalyst was by blocking the pore size and loading the catalyst to reduce active surface sites and reduce its denitration performance.72–75
4 Conclusions
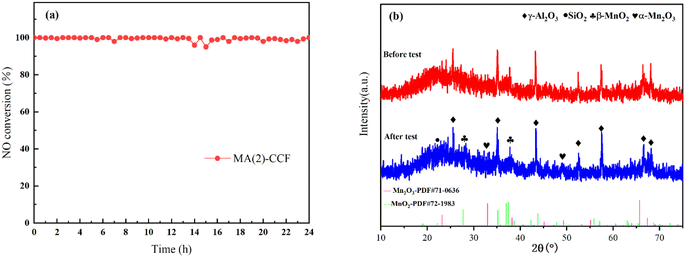
(1) MnOx/Al2O3 was prepared by an impregnation method. The dispersion of active components was also an essential factor affecting the denitration activity of the catalyst. When the loading amount was 4 wt% and the calcination temperature was 400 °C, the NO conversion was more than 90% at 150–350 °C. In addition, we will continue to study the N2 selectivity of MnOx/Al2O3 and further explore its SCR reaction mechanism in the future.(2) Under the FV of 1 m min−1, the NO conversion of MA(2)-CCF was above 80% at 125–375 °C. Water and sulfur tolerance of it were better and it showed good tolerance to alkali metal poisoning at 225 °C. MA(2)-CCF had good stability for 24 h at 225 °C.
(3) According to XRD, SEM, and BET results, there were two reasons for SO2 poisoning in the MA(2)-CCF. One was that the ammonium sulfate generated by SO2 and NH3 deposits on the surface of the MA(2)-CCF. The second was that the sulfate generated by the catalyst reduced the number of active sites. The influence of H2O mainly lay in the destruction of the fiber structure of the MA(2)-CCF. Alkali metal poisoning occurred due to the deposition of oxide generated by the alkali metal. It blocked the pore channel and covered the catalyst loaded on the surface of the MA(2)-CCF. The dense surface film and unique ceramic fiber structure of MA(2)-CCF could effectively protect the internal catalyst and reduce the poisoning effect, which had a high industrial application prospect.
Author contributions
Zhenzhen Wang: writing – investigation, original draft, methodology, date curation, formal analysis, software. Shuchuan Peng: supervision, validation. Chengzhu Zhu: methodology, writing – review & editing. Bin Wang: resources, project administration. Bo Du: formal analysis. Ting Cheng: formal analysis. Zhaozhong Jiang: formal analysis. Lei Sun: conceptualization, supervision, funding acquisition, visualization.Conflicts of interest
The authors declared that they have no conflicts of interest to this work.Acknowledgements
The authors thank for the financial support from Emission standard of air pollutants for the glass industry of Anhui Province of China (ZXBZ2020-27), Hefei key generic technology research and development projects (2021GJ064), and Major science and technology projects of Anhui Province of China (201903b06020016) for the support of this study.References
- H. Lin, A. Abubakar, C. Li, Y. Li, C. Wang, S. Gao, Z. Liu and J. Yu, Catal. Lett., 2019, 150, 702–712 Search PubMed.
- J. Yu, C. Li, F. Guo, S. Gao, Z.-G. Zhang, K. Matsuoka and G. Xu, Fuel, 2018, 219, 37–49 CrossRef CAS.
- L. Guo, J. Lu, Y. Zhao, C. Wang, C. Zhang, C. Tang, L. Dong, W. Kong, Q. Li and P. Cao, Catal. Sci. Technol., 2021, 11, 3164–3175 RSC.
- X. Liu, C. A. Wang, T. Zhu, Q. Lv, Y. Li and D. Che, Chem. Eng. J., 2019, 371, 486–499 CrossRef CAS.
- R. Xiao, T. Gao, X. Cui, Y. Ji, Y. Zhang, X. Chuai, Z. Xiong, Y. Liao, H. Gu, J. Yang, J. Zhang and Y. Zhao, Fuel, 2022, 310, 122219 CrossRef CAS.
- J.-H. Choi, J.-H. Kim, Y.-C. Bak, R. Amal and J. Scott, Korean J. Chem. Eng., 2005, 22, 844–851 CrossRef CAS.
- J.-H. Choi, S.-K. Kim, S.-J. Ha and Y.-O. Park, Korean J. Chem. Eng., 2001, 18, 456–462 CrossRef CAS.
- J.-H. Choi, S.-K. Kim and Y.-C. Bak, Korean J. Chem. Eng., 2001, 18, 719–724 CrossRef CAS.
- S. Heidenreich, M. Nacken, M. Hackel and G. Schaub, Powder Technol., 2008, 180, 86–90 CrossRef CAS.
- M. Nacken, S. Heidenreich, M. Hackel and G. Schaub, Appl. Catal., B, 2007, 70, 370–376 CrossRef CAS.
- Z. An, G. Niu, Z. Tan, T. Shang and X. Yang, Therm. Power. Gen., 2017, 46, 36–41 Search PubMed.
- C. Yu, Master, XiangTan University, 2018.
- Y. Zhang, C. Li, C. Yu, T. Tran, F. Guo, Y. Yang, J. Yu and G. Xu, Chem. Eng. J., 2017, 330, 1082–1090 CrossRef CAS.
- Y.-S. Zhang, C. Li, C. Wang, J. Yu, G. Xu, Z.-g. Zhang and Y. Yang, Ind. Eng. Chem. Res., 2019, 58, 828–835 CrossRef CAS.
- J. Svachula, N. Ferlazzo, P. Forzatti, E. Tronconi and F. Bregani, Ind. Eng. Chem. Res., 1993, 32, 1053–1060 CrossRef CAS.
- C. Wang, C. Li, Y. Li, L. Huangfu, Z. Liu, S. Gao and J. Yu, Ind. Eng. Chem. Res., 2019, 58, 19847–19854 CrossRef CAS.
- J. Xiang, L. Wang, F. Cao, K. Qian, S. Su, S. Hu, Y. Wang and L. Liu, Chem. Eng. J., 2016, 302, 570–576 CrossRef CAS.
- G. Zhai, Z. Han, X. Wu, H. Du, Y. Gao, S. Yang, L. Song, J. Dong and X. Pan, J. Taiwan Inst. Chem. Eng., 2021, 125, 132–140 CrossRef CAS.
- H. Zhou, L. Qian, T. Cheng, B. Du, F. Xia and C. Zhu, J. Chem., 2022, 2022, 5049161 Search PubMed.
- T. Wang, C. Zhu, H. Liu, Y. Xu, X. Zou, B. Xu and T. Chen, Environ. Technol., 2017, 42, 2705–2715 Search PubMed.
- L. Han, M. Gao, C. Feng, L. Shi and D. Zhang, Environ. Sci. Technol., 2019, 53, 5946–5956 CrossRef CAS PubMed.
- Z. Fan, J.-W. Shi, C. Niu, B. Wang, C. He and Y. Cheng, Chem. Eng. J., 2020, 398, 125572 CrossRef CAS.
- T. Qiao, Z. Liu, C. Liu, W. Meng, H. Sun and Y. Lu, Appl. Catal., A, 2021, 617, 118128 CrossRef CAS.
- Z. Fan, J.-W. Shi, C. Gao, G. Gao, B. Wang, Y. Wang, C. He and C. Niu, Chem. Eng. J., 2018, 348, 820–830 CrossRef CAS.
- J. Huang, Z. Tong, Y. Huang and J. Zhang, Appl. Catal., B, 2008, 78, 309–314 CrossRef CAS.
- L. Xu, S. Niu, C. Lu, Q. Zhang and J. Li, Fuel, 2018, 219, 248–258 CrossRef CAS.
- H. Xu, M. Sun, S. Liu, Y. Li, J. Wang and Y. Chen, RSC Adv., 2017, 7, 24177–24187 RSC.
- Z. Han, Q. Yu, Z. Teng, B. Wu, Z. Xue and Q. Qin, Environ. Sci. Pollut. Res., 2019, 26, 12920–12927 CrossRef CAS PubMed.
- S. M. Lee, H. H. Lee and S. C. Hong, Appl. Catal., A, 2014, 470, 189–198 CrossRef CAS.
- Y. Yu, J. Zhang, C. Chen, C. He, J. Miao, H. Li and J. Chen, J. Environ. Sci., 2020, 91, 237–245 CrossRef CAS PubMed.
- L. Ma, J. Li, H. Arandiyan, W. Shi, C. Liu and L. Fu, Catal. Today, 2011, 184, 145–152 CrossRef.
- Z. Song, Z. Huang, B. Liu, H. Liu, X. Zhu, F. Xia, H. Kang, Y. Mao, X. Liu, B. Zhao and Q. Zhang, Microporous Mesoporous Mater., 2019, 292, 109753 CrossRef.
- Q. Liu, C. Bian, Y. Jin, L. Pang, Z. Chen and T. Li, Catal. Today, 2022, 388–389, 158–167 CrossRef CAS.
- L. Jia, J. Liu, D. Huang, J. Zhao, J. Zhang, K. Li, Z. Li, W. Zhu, Z. Zhao and J. Liu, ACS Catal., 2022, 12, 11281–11293 CrossRef CAS.
- J. Zhang, Y. Li, L. Wang, C. Zhang and H. He, Catal. Sci. Technol., 2015, 5, 2305–2313 RSC.
- J. Liu, Y. Wei, P. Li, P. Zhang, W. Su, Y. Sun, R. Zou and Y. Zhao, ACS Catal., 2018, 8, 3863–3874 RSC.
- S. Mo, Q. Zhang, J. Li, Y. Sun, Q. Ren, S. Zou, Q. Zhang, J. Lu, M. Fu, D. Mo, J. Wu, H. Huang and D. Ye, Appl. Catal., B, 2019, 264, 118646 Search PubMed.
- S. Zhang, Y. Zhao, J. Yang, J. Zhang and C. Zheng, Chem. Eng. J., 2018, 348, 618–629 CrossRef CAS.
- Q. Xu, Z. Fang, Y. Chen, Y. Guo, Y. Guo, L. Wang, Y. Wang, J. Zhang and W. Zhan, Environ. Sci. Technol., 2020, 54, 2530–2538 CrossRef CAS PubMed.
- G. Zhai, J. Wang, Z. Chen, S. Yang and Y. Men, J. Hazard. Mater., 2019, 363, 214–226 CrossRef CAS PubMed.
- G. Zhai, J. Wang, Z. Chen, W. An and Y. Men, Chem. Eng. J., 2018, 337, 488–498 CrossRef CAS.
- J. Wang, C. Zhang, S. Yang, H. Liang and Y. Men, Catal. Sci. Technol., 2019, 9, 6379–6390 RSC.
- C. Liu, F. Li, J. Wu, X. Hou, W. Huang, Y. Zhang and X. Yang, J. Hazard. Mater., 2019, 363, 439–446 CrossRef CAS PubMed.
- C. Niu, B. Wang, Y. Xing, W. Su, C. He, L. Xiao, Y. Xu, S. Zhao, Y. Cheng and J.-W. Shi, J. Cleaner Prod., 2021, 290, 125858 CrossRef CAS.
- L. Yao, Q. Liu, S. Mossin, D. Nielsen, M. Kong, L. Jiang, J. Yang, S. Ren and J. Wen, J. Hazard. Mater., 2020, 387, 121704 CrossRef CAS PubMed.
- M. Salazar, S. Hoffmann, L. Tillmann, V. Singer, R. Becker and W. Grünert, Appl. Catal., B, 2017, 218, 793–802 CrossRef CAS.
- D. Fang, J. Xie, H. Hu, H. Yang, F. He and Z. Fu, Chem. Eng. J., 2015, 271, 23–30 CrossRef CAS.
- R. Luo, Y. Zeng, S. Ju, S. Feng, F. Zhang, Z. Zhong and W. Xing, Ind. Eng. Chem. Res., 2022, 61, 5816–5824 CrossRef CAS.
- F. A. Deorsola, S. Andreoli, M. Armandi, B. Bonelli and R. Pirone, Appl. Catal., A, 2016, 522, 120–129 CrossRef CAS.
- L. Wang, B. Huang, Y. Su, G. Zhou, K. Wang, H. Luo and D. Ye, Chem. Eng. J., 2012, 192, 232–241 CrossRef CAS.
- L. Cheng, J. Wang, C. Zhang, B. Jin and Y. Men, New J. Chem., 2019, 43, 19126–19136 RSC.
- Z. Zhang, J. Li, J. Tian, Y. Zhong, Z. Zou, R. Dong, S. Gao, W. Xu and D. Tan, Fuel Process. Technol., 2022, 230, 107213 CrossRef CAS.
- S. S. R. Putluru, L. Schill, A. D. Jensen, B. Siret, F. Tabaries and R. Fehrmann, Catalysts, 2021, 22, 259 CrossRef.
- D. Meng, Q. Xu, Y. Jiao, Y. Guo, Y. Guo, L. Wang, G. Lu and W. Zhan, Appl. Catal., B, 2018, 221, 652–663 CrossRef CAS.
- J. Liu, M. Jing, R. Tao, W. Song, H. Cheng, H. Li, Z. Zhao, J. Liu, W. Zhu and S. Dai, Fuel, 2023, 333, 126303 CrossRef CAS.
- A. Xie, Y. Tao, X. Jin, P. Gu, X. Huang, X. Zhou, S. Luo, C. Yao and X. Li, New J. Chem., 2019, 43, 2490–2500 RSC.
- J. Liu, H. Cheng, H. Zheng, L. Zhang, B. Liu, W. Song, J. Liu, W. Zhu, H. Li and Z. Zhao, ACS Catal., 2021, 11, 14727–14739 CrossRef CAS.
- Y. Li, Z. liu, X. Li and Y. Hou, Mol. Catal., 2021, 509, 111635 CrossRef CAS.
- R. Wang, L. Zhao, X. Hu, Z. Liu, H. Zhang and J. Jin, Mater. Res. Express, 2019, 6, 115512 CrossRef CAS.
- Z. L. Guan J, W. Li, D. Hu, J. Wen and B. Huang, Catalysts, 2021, 11, 324 CrossRef.
- Q. Wang, R. Wang, X. Huang and H. Shi, J. Environ. Chem. Eng., 2022, 10, 107345 CrossRef CAS.
- J. Wang, X. Yi, Q. Su, J. Chen and Z. Xie, Catal. Sci. Technol., 2021, 11, 2852–2863 RSC.
- C. Gao, J.-W. Shi, Z. Fan, B. Wang, Y. Wang, C. He, X. Wang, J. Li and C. Niu, Appl. Catal., A, 2018, 564, 102–112 CrossRef CAS.
- X. Wu, Q. Shi, Y. Xu, J. Wang and X. Zhang, Appl. Clay Sci., 2020, 185, 105200 CrossRef CAS.
- S. Pan, H. Luo, L. Li, Z. Wei and B. Huang, J. Mol. Catal. A: Chem., 2013, 377, 154–161 CrossRef CAS.
- Y. Li, X. Han, Y. Hou, Y. Guo, Y. Liu, Y. Cui and Z. Huang, Chem. Eng. J., 2018, 347, 313–321 CrossRef CAS.
- B. Zhang, M. Liebau, W. Suprun, B. Liu, S. Zhang and R. Gläser, Catal. Sci. Technol., 2019, 9, 4759–4770 RSC.
- K. Liu, Z. Yan, H. He, Q. Feng and W. Shan, Catal. Sci. Technol., 2019, 9, 5593–5604 RSC.
- M. Kong, Q. Liu, J. Zhou, L. Jiang, Y. Tian, J. Yang, S. Ren and J. Li, Chem. Eng. J., 2018, 348, 637–643 CrossRef CAS.
- L. Liu, X. Wu, Y. Ma, X. Zhang, R. Ran, Z. Si and D. Weng, Chem. Eng. J., 2020, 383, 123080 CrossRef CAS.
- B. Wang, Y. Bian, Q. Feng, S. Wang and B. Shen, J. Fuel Chem. Technol., 2022, 50, 503–512 CrossRef.
- P. Wu, K. Shen, Y. Liu, Y. Zhang, G. Li, H. Yang and S. Wang, Catal. Sci. Technol., 2021, 11, 4115–4132 RSC.
- B. Zhu, Z. Zi, Y. Sun, Q. Fang, J. Xu, W. Song, H. Yu and E. Liu, Catal. Sci. Technol., 2019, 9, 3214–3225 RSC.
- L. Lisi, G. Lasorella, S. Malloggi and G. Russo, Appl. Catal., B, 2004, 50, 251–258 CrossRef CAS.
- P. Wu, X. Tang, Z. He, Y. Liu and Z. Wang, Energy Fuels, 2022, 36, 5622–5646 CrossRef CAS.
| This journal is © The Royal Society of Chemistry 2023 |

