DOI:
10.1039/D2RA06524J
(Paper)
RSC Adv., 2023,
13, 1278-1287
Interface modified BTO@PS-co-mah/PS composite dielectrics with enhanced breakdown strength and ultralow dielectric loss
Received
16th October 2022
, Accepted 19th December 2022
First published on 4th January 2023
Abstract
Dielectrics of the polymer-matrix composite are considered to present combined advantages from both the polymer matrix and inorganic fillers. However, the breakdown strength, as well as energy density, is not effectively enhanced due to the poor compatibility between the organic and inorganic components. Herein, polymer composites derived from polystyrene (PS) and barium titanate (BTO) are proposed and beneficial interface modification by poly(styrene-co-maleic anhydride) (PS-co-mah) is conducted to improve compatibility between the inorganic filler and polymer matrix. The results show that the BTO@PS-co-mah/PS composites, in which the interfacial layer of PS-co-mah would undergo chemical reactions with the aminated BTO and blend PS matrix with excellent physical compatibility, exhibit enhanced breakdown strength and declined dielectric loss compared with both pure PS and BTO/PS without interfacial modulation. Particularly, the BTO@PS-co-mah/PS composite with 5 wt% filler content indicates optimized performance with an Eb of 507 MV m−1 and tan![[thin space (1/6-em)]](https://www.rsc.org/images/entities/char_2009.gif) δ of 0.085%. It is deduced that the deep energy traps introduced by the PS-co-mah layer would weaken the local electric field and suppress the space charge transporting so as to optimize the performance of composites. Consequently, the interfacial-modified BTO@PS-co-mah/PS would present great potential for applications, such as film capacitors.
δ of 0.085%. It is deduced that the deep energy traps introduced by the PS-co-mah layer would weaken the local electric field and suppress the space charge transporting so as to optimize the performance of composites. Consequently, the interfacial-modified BTO@PS-co-mah/PS would present great potential for applications, such as film capacitors.
Introduction
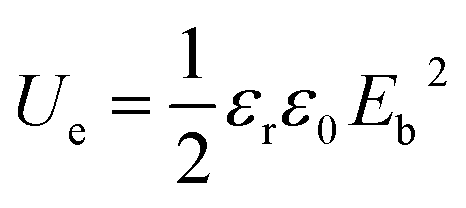
Polymer dielectrics are key components of film capacitors, which are widely used in various applications such as electric vehicles, electric power converters, and pulse power systems.1–5 The state-of-the-art polymer dielectric is biaxially oriented polypropylene (BOPP), which displays high breakdown strength (700 MV m−1) and low dissipation factor (0.0002).6 However, the discharged energy density (Ue) is not sufficient for the increasing requirements of film capacitors due to the relatively low permittivity.7–9 As is known, Ue is proportional to permittivity (εr) and square of breakdown strength (Eb) according to the energy density equation for linear dielectrics (Ue = 0.5εrε0Eb2, ε0 is the permittivity in vacuum).10,11 At the same time, low dissipation factor (tanδ) is also desired because dielectrics with low tanδ would acquire high charge–discharge efficiency (η).6 Consequently, many efforts have been devoted to pursuing enhanced permittivity and breakdown strength while reducing the dissipation factor.
Thus far, there are various strategies to optimize the dielectric performance, such as intrinsic polymer dielectrics,12–16 all-organic composite polymer dielectrics17–22 and inorganic filler/organic matrix composite dielectrics.10,23–27 Among all the methods, the organic/inorganic composite dielectrics combining the high-εr inorganic fillers and a high-Eb polymer matrix would take advantage of both components.28–31 It is critical to choose the appropriate polymer and filler to obtain the optimized properties. In comparison with ferroelectric polymers (e.g., poly(vinylidene fluoride), PVDF) or linear polymers with strong polarity (e.g., polyimide, PI), polystyrene (PS) shows a low dielectric loss, excellent electric insulation, as well as low price and attractive processability.6,11,32 Thus, many attempts have been made on the PS-based composite dielectrics.6,11,32–38 For instance, a conductive filler such as graphite nanoplates (GNPs) was introduced to the PS matrix to prepare the GNP/PS nanocomposite.34 As a result, the value of εr was enhanced to 36 at 100 Hz when the filler loading was 9 vol%, though the electrical conductivity increased simultaneously. Similar results were also obtained in Al/PS nanocomposite.37 Obviously, the high electrical conductivity is not in favor of high η. On the other hand, high-εr ferroelectric ceramic fillers such as Ba0.5Sr0.4Ca0.1TiO3 (BSCT) and BaTiO3 (BTO) have also been adopted. In the BSCT/PS composite derived from the hot press method, tanδ was relatively high, especially in the low-frequency range of 102 ∼ 105 Hz.32 The increase in the dielectric loss can be ascribed to the unmodified organic/inorganic interfaces. It is known that interface incompatibility would result in the agglomeration of fillers and the generation of defects, which are associated with deteriorated performance, such as dielectric breakdown and mechanical properties. To overcome this problem, the core–shell structured BaTiO3@PS was fabricated through atom transfer radical polymerization, which can be classified as a “graft from” approach.36 In the BaTiO3@PS/PS composite, the discharged energy density of 4.24 J cm−3 was obtained due to the reduced agglomeration of BaTiO3@PS and enhanced Eb. In another similar work, BaTiO3@PS particles with a core–shell structure were prepared by in situ reversible addition–fragmentation chain transfer polymerization from the BaTiO3 surface.38 The insulating polymer shell layer of PS not only functions as an interlayer to prevent the agglomeration of the nanoparticles but also serves as a matrix. Consequently, increased permittivity and very low dielectric loss, as well as weak frequency dependence of dielectric performance over a wide range of frequencies were acquired in the BaTiO3@PS/PS composite.
Based on the above background, in this work, the molecular modification at the interfaces between BaTiO3 nanoparticles and PS matrix via a more facial “graft to” method was conducted. Specifically, the copolymer of poly(styrene-co-maleic anhydride) (marked as PS-co-mah) was adopted to graft onto the surface of aminated BaTiO3 as polymer shells. On one hand, a chemical reaction occurred between the maleic anhydride segments in PS-co-mah and the amino groups on the surface of the pretreated BaTiO3 particles. On the other hand, the styrene segments in PS-co-mah would significantly improve the dispersion of BaTiO3 fillers in the PS matrix. Therefore, BTO@PS-co-mah/PS composite with increased compatibility between the inorganic and the organic interface with enhanced dielectric properties was obtained. Their mechanical and dielectric performances were investigated. We deduced that the enhanced breakdown strength and the suppressed dielectric loss can be ascribed to the deep energy traps introduced by molecular modification. Hence the charge density and trap energy level in the composite were characterized by the isothermal surface potential decay (ISPD) method.39,40 At the same time, the effect of interfacial coating on the local electric field distribution and dielectric breakdown development was also identified by phase-field simulation.
Experimental section
Materials
Nano-barium titanate (the average particle size of 100 nm), polystyrene (PS, with average Mn of 200000 g mol−1), (3-aminopropyl) triethoxysilane (APTES), and hydrogen peroxide solution (30 wt%) were purchased from Aladdin Industrial, Inc. Xylene, poly(styrene-co-maleic anhydride) with cumene termination (PS-co-mah, with average Mn of 1900 g mol−1) were purchased from Shanghai Macklin Biochemical Co., Ltd.
Preparation of BTO@PS-co-mah nanoparticles and BTO@PS-co-mah/PS composites
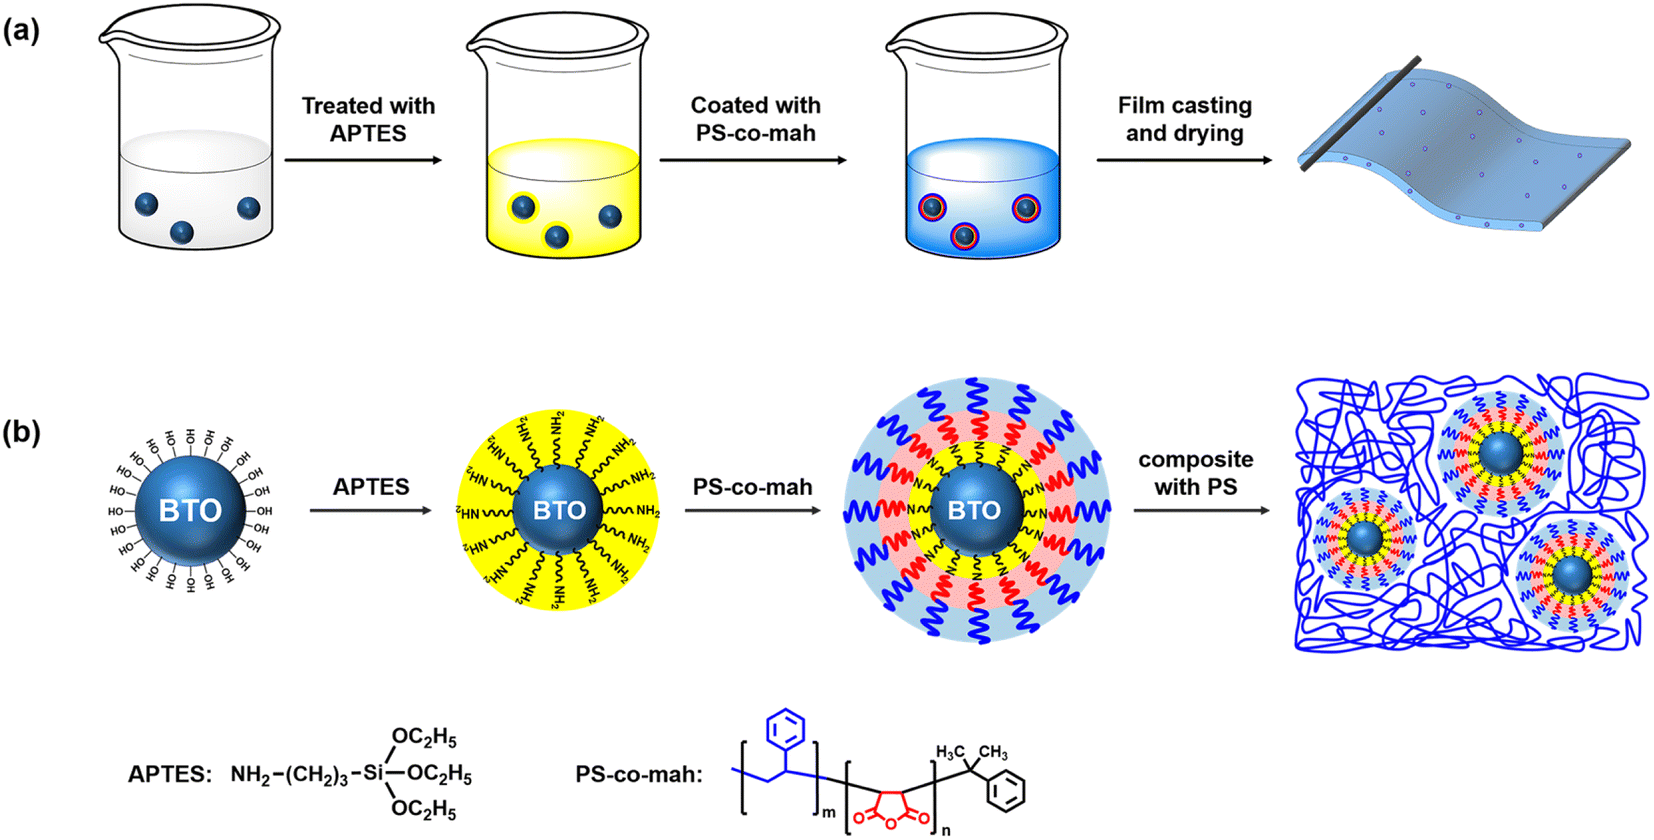
The surface modification of BTO was carried out by following three steps. The first step was the hydroxylation of BTO. In brief, 15 g BTO was dispersed in 80 ml hydrogen peroxide solution (30 wt%) under stirring at 105 °C for 4 h. Afterwards, the nanoparticles were centrifuged, washed, dried, and ground in a sequence to obtain hydroxylated BTO. The second step was to disperse 15 g BTO in 80 ml of the ethanol solution under stirring with 0.225 g APTES added to the mixture. After reacting at 60 °C for 2 h and post-process similar to the first step, the aminated BTO nanoparticles (BTO-NH2) were obtained. Thirdly, 15 g BTO-NH2 nanoparticles were dispersed in xylene solution under tip sonication for 30 min, then 0.2714 g PS-co-mah was added to the mixture reacting at 60 °C for 2 h to produce surface-modified BTO. Subsequently, PS particles were poured into the above xylene suspension and stirred until PS was completely dissolved to obtain BTO@PS-co-mah/PS suspension. A solution casting operation was conducted to prepare a wet film with a blade gap of 100 μm after vacuum defoaming treatment. The solvent would be taken away while thermally baking in an oven at 40 °C for 1 h and 80 °C for 2 h. Finally, flexible and free-standing PS composite films with a thickness of about 20 μm (for the breakdown test) or 40 μm (for all other characterizations) were acquired. The fabrication process and schematic illustration of BTO@PS-co-mah nanoparticles as well as BTO@PS-co-mah/PS composites are shown in Fig. 1. In addition, the pure PS film and the BTO-NH2/PS (5 wt%) film were also prepared for comparison.
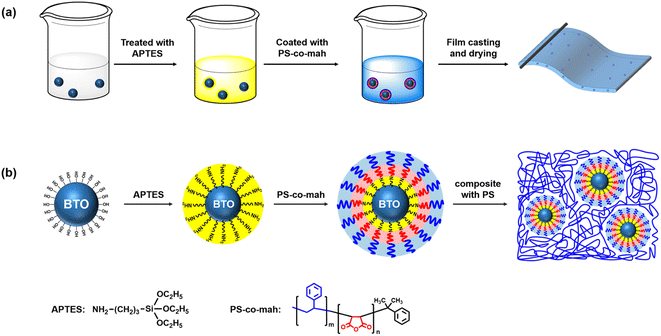 |
| | Fig. 1 (a) Fabrication process and (b) schematic illustration of BTO@PS-co-mah nanoparticles and BTO@PS-co-mah/PS composites. | |
Characterization
Transmission electron microscopy (TEM) images of nanoparticles were obtained by JEOL JEM-2100. Scanning electron microscope (SEM) images were taken on a Tescan Mira 3 LMH, Oxford Instrument. The thermal gravimetric analysis (TGA) of nanocomposites films was performed on a TGA/DSC 3+, Mettler Toledo, with a heating rate of 10 °C min−1 from 30 to 600 °C in an air atmosphere. Fourier transform infrared (FTIR) spectroscopy measurements of nanoparticles and composites were carried out on a Bruker Vertex 70, the infrared wavelengths ranged from 500 cm−1 to 4000 cm−1. The X-ray diffraction (XRD) analysis was carried out on a D8 Advance Bruker diffractometer with Cu Kα radiation, operating at 40 kV and 40 mA. A WDW-1 electronic universal testing machine was used to conduct tensile on the composite film with a span of 50 mm and a tensile of 10 mm min−1. The Ag electrodes (10 mm and 8 mm in diameter) were evaporated on the two sides of the PS-based composite film for the following electrical measurements. Permittivity and dissipation factors were recorded using the E4980A instrument from, Keysight Technologies. DC breakdown test was conducted on a Chang Sheng CS9920B instrument under a voltage ramp of 500 V s−1. The isothermal surface potential decay (ISPD) method was adopted to determine the surface trap density and trap energy level. In the experiment, the composite film was charged with a direct voltage of −800 V for 1 min, and then was quickly moved to the kelvin electrostatic probe (Trek-6000B) for a surface potential test. The whole measurement was conducted at a temperature of (25 ± 1) °C and relative humidity of 32% ± 5%.
Results and discussion
Structure and properties of BTO@PS-co-mah/PS composites
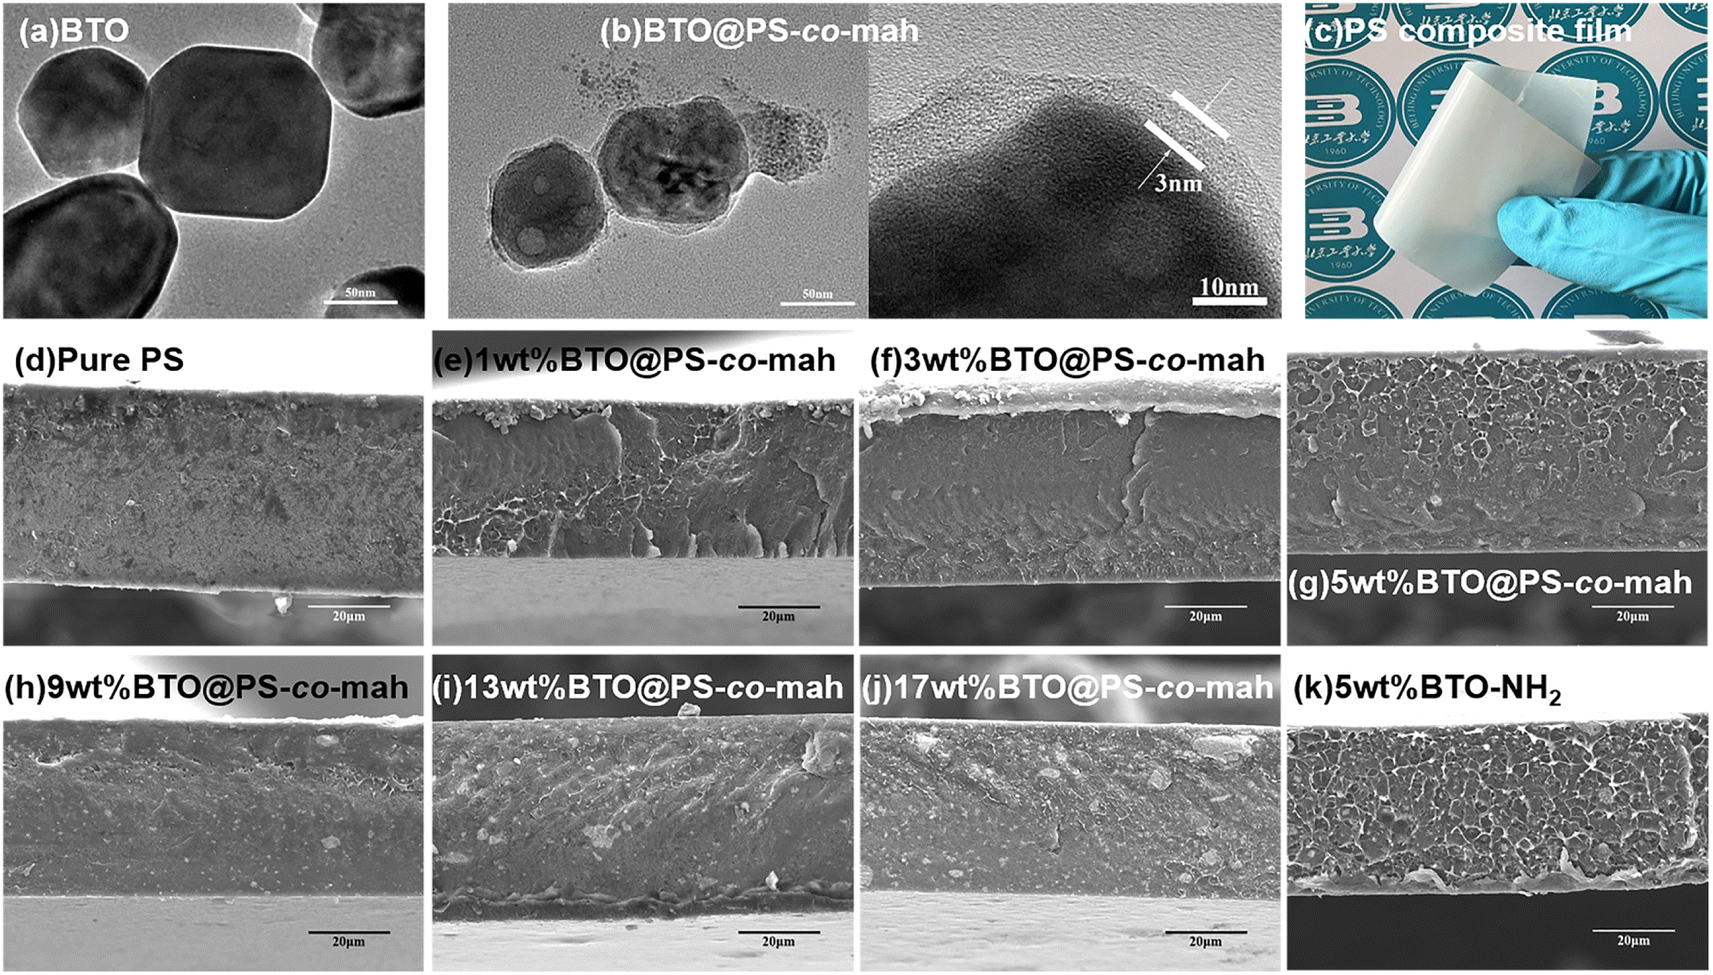
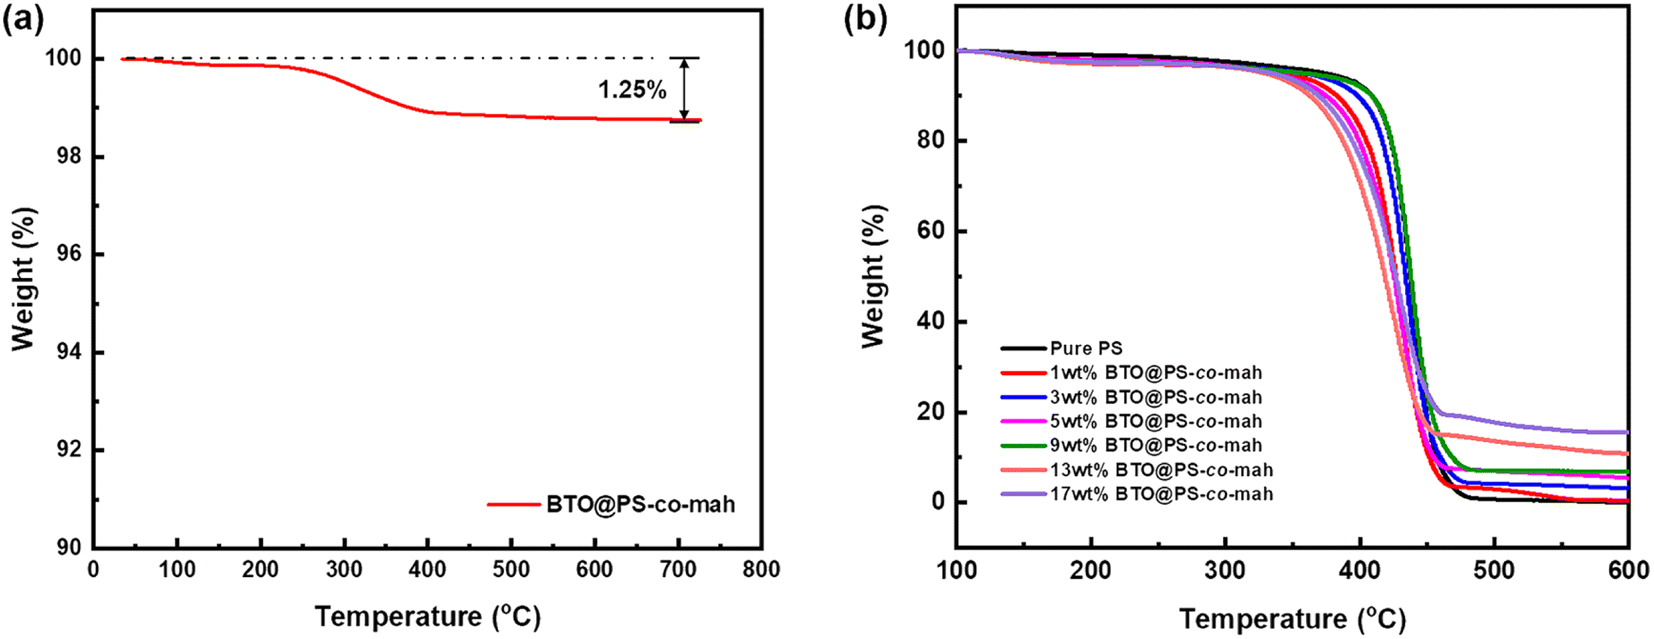
As shown in Fig. 1, the surface-modified procedure consists of three steps. The first was to strengthen the number of hydroxyl groups on the BTO surface by treating it with an H2O2 solution. The silane coupling agent APTES reacts with hydroxyl groups, yielding the amino-functionalized BTO nanoparticles (BTO-NH2). Afterward, a chemical reaction occurs between the anhydride groups in the copolymer of PS-co-mah and the amino group on the BTO surface so as to produce BTO nanoparticles coated with PS molecular segments (BTO@PS-co-mah). The TEM images shown in Fig. 2a and b indicate that a core–shell structure was formed after the surface modification of BTO nanoparticles, and a uniform coating with a thickness of about 3 nm was obtained. From the TGA curve shown in Fig. 3a, it can be confirmed that the residual weight of BTO@PS-co-mah was 98.75%, thus the weight fraction of the organic coating was 1.25%. As shown in Fig. 2c, uniform and defect-free film of PS-based composite was obtained in which the coating layer of PS-co-mah would present excellent compatibility with the polymer matrix because of the same composition of PS. Consequently, as the cross-section images of SEM (Fig. 2d–k) indicate that compared with the unmodified BTO-NH2, BTO@PS-co-mah nanoparticles are uniformly dispersed in the PS matrix when the filler content is no more than 5 wt%. A little agglomeration occurred in the composite with higher filler loadings of 9 wt%, 13 wt%, and 17 wt%. The TGA analysis was conducted to identify the filler content of the nanocomposites (Fig. 3b). The results show that the residual weight was consistent with the initial dosage of inorganic fillers.
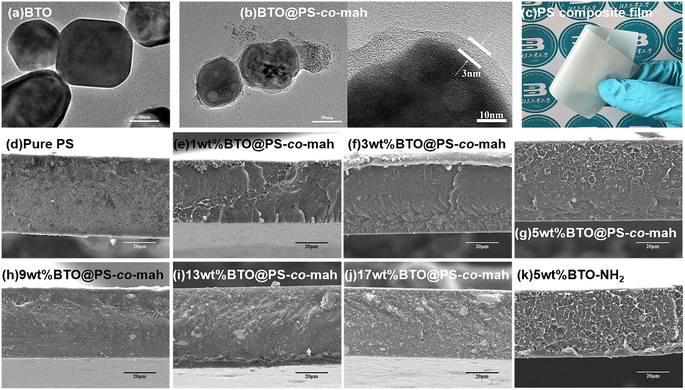 |
| | Fig. 2 TEM images of (a) BTO (b) BTO@PS-co-mah; (c) optical photo of BTO@PS-co-mah/PS composite film with 5 wt% filler content; cross-sectional SEM images of PS-based nanocomposites with different BTO@PS-co-mah contents (d) pure PS, (e) 1 wt%, (f) 3 wt%, (g) 5 wt%, (h) 9 wt%, (i) 13 wt%, (j) 17 wt% and (k) nanocomposite with 5 wt% BTO-NH2. | |
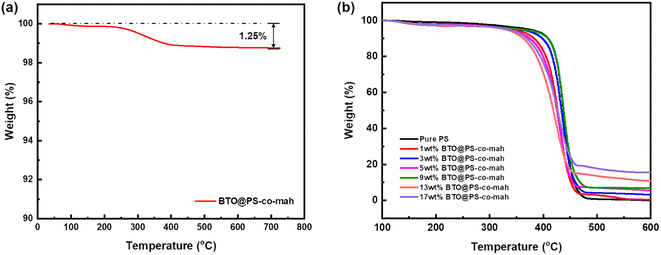 |
| | Fig. 3 TGA curves of (a) BTO@PS-co-mah nanoparticles and (b) BTO@PS-co-mah/PS composites. | |
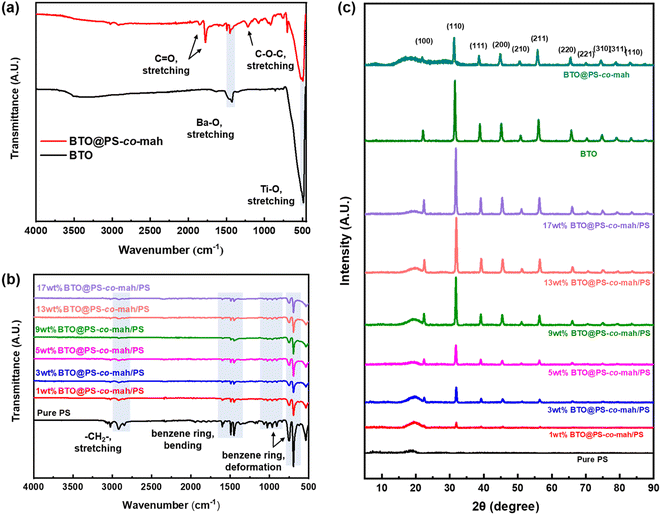
The infrared spectra of BTO and PS-co-mah coated BTO were measured and are shown in Fig. 4a. The characteristic absorption peaks of the Ba–O bond and Ti–O bond can be seen clearly at wavenumbers of 1427 cm−1 and 490 cm−1, respectively. In BTO@PS-co-mah, the absorption peaks at 1850 cm−1 and 1780 cm−1 originated from symmetric and asymmetric stretching vibrations of C![[double bond, length as m-dash]](https://www.rsc.org/images/entities/char_e001.gif) O, and the strong and broad absorption peak at 1215 cm−1 is responsible for the stretching vibration of C–O–C in maleic anhydride. The bending vibrations of the benzene ring in polystyrene at 1452 cm−1 and 1490 cm−1 were also observed, which coincide with the peak of Ba–O to a certain extent. In the spectra of composites shown in Fig. 4b, the characteristic peaks for polystyrene can be clearly observed. In addition, as the filler content increases, the characteristic absorption peaks for polystyrene weakens because of its decreased proportion.
O, and the strong and broad absorption peak at 1215 cm−1 is responsible for the stretching vibration of C–O–C in maleic anhydride. The bending vibrations of the benzene ring in polystyrene at 1452 cm−1 and 1490 cm−1 were also observed, which coincide with the peak of Ba–O to a certain extent. In the spectra of composites shown in Fig. 4b, the characteristic peaks for polystyrene can be clearly observed. In addition, as the filler content increases, the characteristic absorption peaks for polystyrene weakens because of its decreased proportion.
 |
| | Fig. 4 FTIR spectra of (a) BTO and BTO@PS-co-mah and (b) nanocomposites with different contents of BTO@PS-co-mah; (c) XRD patterns of BTO, BTO@PS-co-mah and nanocomposites with different contents of BTO@PS-co-mah. | |
The crystal structures of the modified inorganic nanoparticles and composite films were characterized using XRD, as shown in Fig. 4c. It can be found that the peaks of BTO conform to the expected standard pattern, which is a typical cubic perovskite structure. The surface-modified BTO nanoparticles, i.e., BTO@PS-co-mah, exhibit a similar pattern with the unfunctionalized BTO, except for decreased peak strength and additional amorphous halo due to the interface-modified polymer of PS-co-mah. When it comes to the composites, it can be obviously seen that the characteristic peaks of BTO were strengthened while the amorphous halo of PS weakened with the augmentation of BTO@PS-co-mah loading in the composite film.
The mechanical properties of the composite are presented in Fig. 5. The data demonstrated that with the increase of the filler content, the tensile strength displayed a trend of increasing first and then decreasing. The highest value of the tensile strength (17.0 MPa) was obtained at the BTO@PS-co-mah loading of 5 wt%. The particles would occupy the voids and decrease the free volume in the composite, resulting in a compact structure. At low filler content of no more than 5 wt%, the reinforcement effect plays a major role in the composite leading to the enhancement of tensile strength. While as the filler content continues to increase, a slight decrease in the mechanical property occurs due to the micro-agglomeration of the filler particles and increased defects in composite. In addition, it can also be seen that the elongation rate of the PS-based composite material is negatively correlated with the mass fraction of the filler.
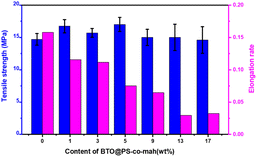 |
| | Fig. 5 Tensile strength and elongation rate of BTO@PS-co-mah/PS nanocomposites at different filler contents. | |
Dielectric performance of BTO@PS-co-mah/PS nanocomposite films
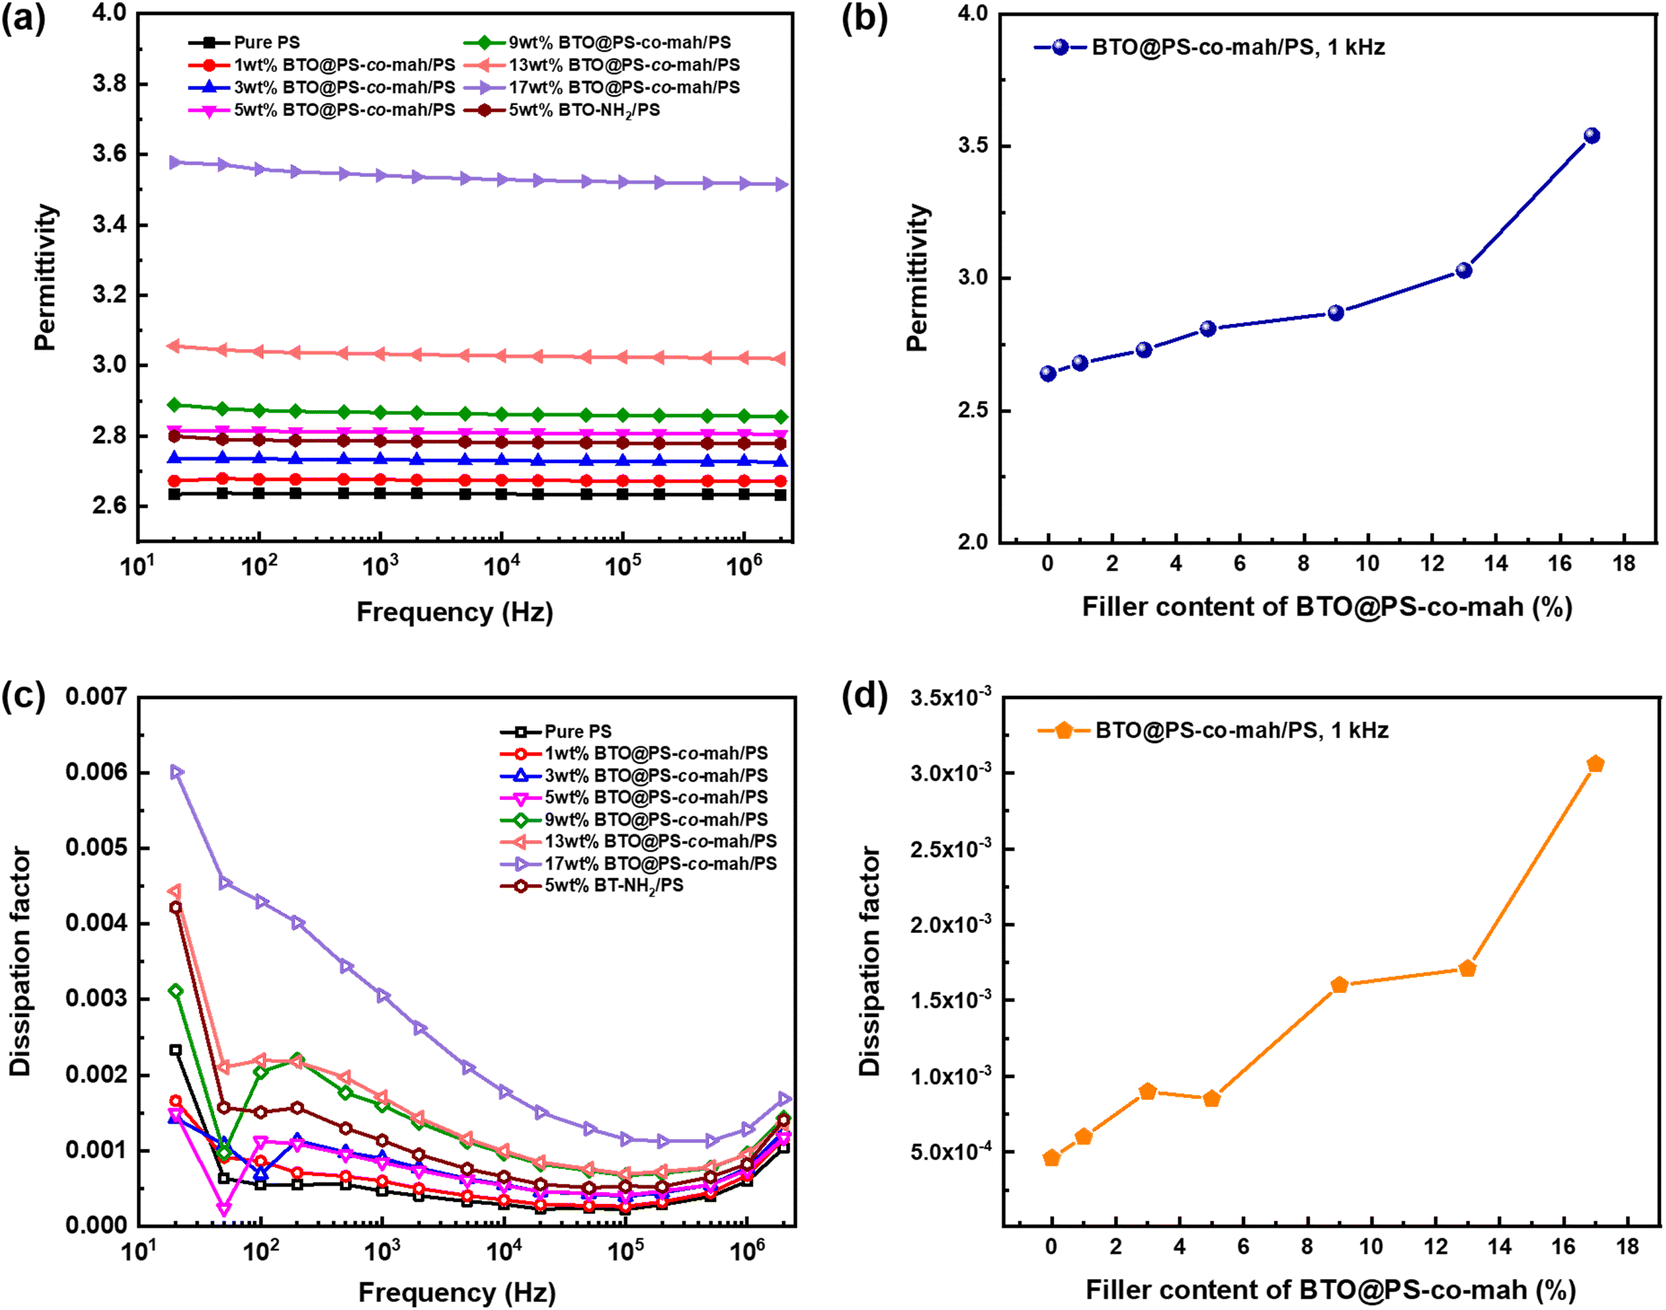
The dielectric performance of BTO@PS-co-mah/PS composites was investigated systematically. Fig. 6a indicates that the permittivity of BTO@PS-co-mah/PS nanocomposites remained highly stable at a wide frequency of 20 Hz to 2 × 10⁶ Hz, thanks to the non-polar nature of the polymer matrix of PS. Additionally, the εr values of nanocomposites increased linearly as the content of BTO@PS-co-mah increased owing to the enhanced filler content of high permittivity, as well as the enlarged amount of interfacial polarization, as shown in Fig. 6b. As a result, the permittivity at 103 Hz falls within the range of 2.68–3.54 (Table 1) as the filler loading increased from 1 wt% to 17 wt%.
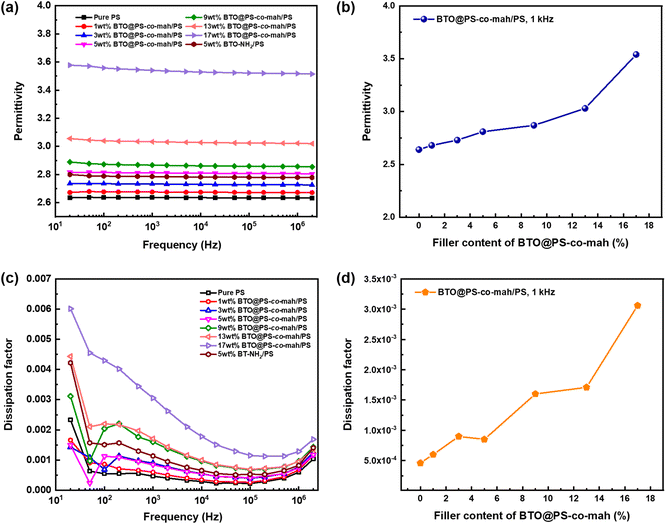 |
| | Fig. 6 Dependence of permittivity on (a) frequency and (b) BTO@PS-co-mah content, respectively; dependence of dissipation factor on (c) frequency and (d) BTO@PS-co-mah content, respectively. | |
Table 1 Dielectric properties of PS-based nanocomposites with different filler contents. Pure PS and PS/BTO-NH2 were also investigated for comparison
| Content of filler |
ε (@kHz) |
tanδ (@kHz) |
Eb (MV m−1) |
Ue (J cm−3) |
| 0 |
2.64 |
0.00046 |
430 |
2.16 |
| 1 wt% |
2.68 |
0.00060 |
429 |
2.18 |
| 3 wt% |
2.73 |
0.00090 |
477 |
2.75 |
| 5 wt% |
2.81 |
0.00085 |
507 |
3.20 |
| 9 wt% |
2.87 |
0.00160 |
453 |
2.60 |
| 13 wt% |
3.03 |
0.00171 |
427 |
2.44 |
| 17 wt% |
3.54 |
0.00306 |
359 |
2.02 |
| 5 wt% (BTO-NH2/PS) |
2.78 |
0.00114 |
358 |
1.58 |
The BTO@PS-co-mah/PS nanocomposites also displayed impressive dielectric loss, as shown in Fig. 6c. The peak of dissipation factor (tanδ) values in the frequency range of 102 Hz to 103 Hz can be attributed to the rotation of the side-chain structure or other small units in the PS matrix and the interface modifier of PS-co-mah. Moreover, the dissipation factors increase again after 105 Hz because of the movement of the polymer segment in PS and PS-co-mah. From Table 1 and Fig. 6d, it can be concluded that the tanδ values at 103 Hz increase from 0.00060 to 0.00306 with the augmentation of the filler content. The dissipation factors are quite low due to the non-polar polymer matrix and the reasonable interface modulation compared with polymer composites reported in the literature. The effect of the interface modification can be revealed evidently by comparing BTO@PS-co-mah/PS with BTO-NH2/PS. Obviously, nanocomposites, including modulated BTO by PS-co-mah demonstrate higher permittivity and lower dissipation factor at the same filler content of 5 wt% in the entire investigated frequency. Specifically, the polar maleic anhydride segment in PS-co-mah on the surface of BTO is beneficial to orientating polarization so as to enhance permittivity. At the same time, the interface modification would improve the compatibility between the inorganic filler and polymer matrix and suppress the transport of space charge. Therefore, conductivity loss is suppressed and the dissipation factor was reduced. Therefore, tanδ at 103 Hz of BTO@PS-co-mah/PS (0.00085) decreases by 25% compared with that of BTO-NH2/PS (0.00114). Thus, the judicious interface modification by PS-co-mah contributes to the improvement of dielectric properties as well as the decoupling in dielectric parameters of εr and tanδ.
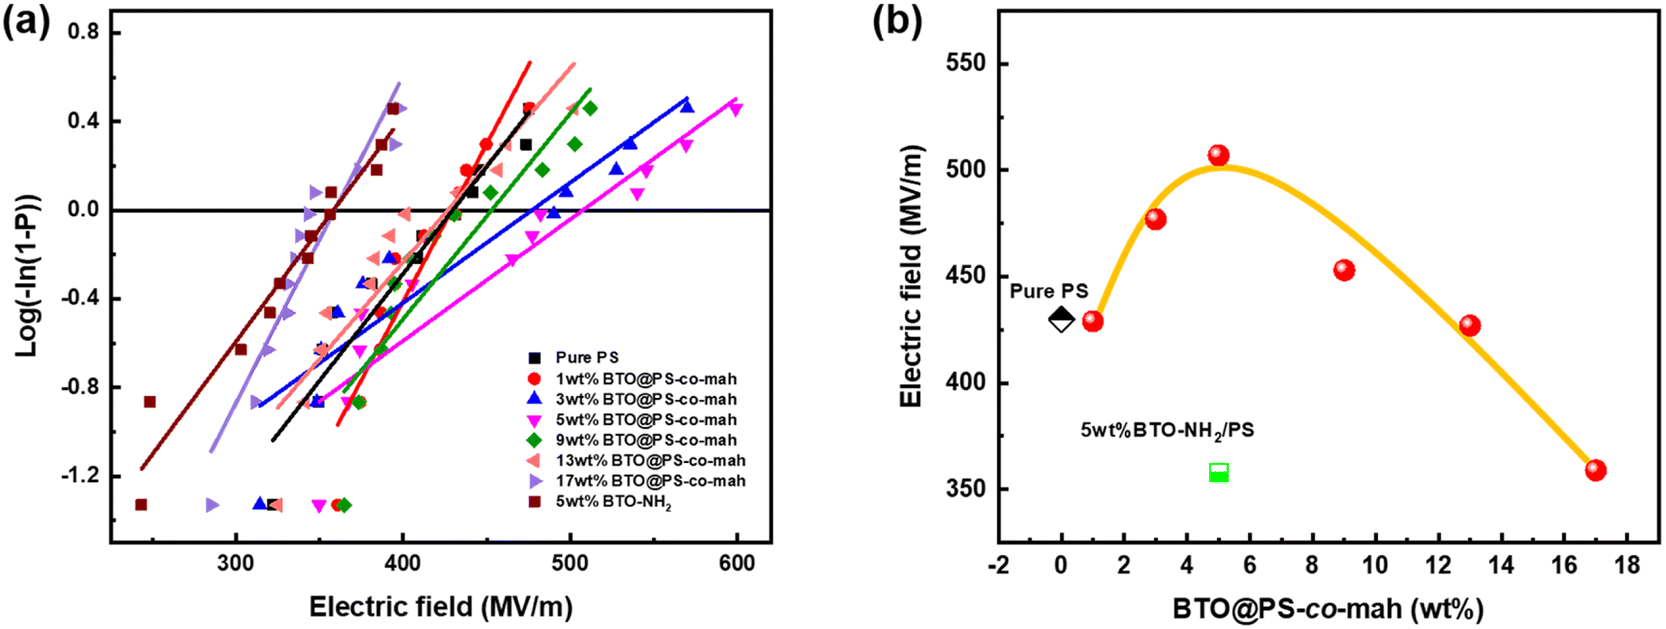
Breakdown strength (Eb) is another critical parameter because the energy density is proportional to the square of Eb. The breakdown strength of the nanocomposite films was analyzed by a two-parameter Weibull statistic distribution function, which can be expressed as:
| |
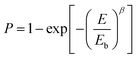 | (1) |
where
P is the cumulative probability of breakdown,
E is the experimentally measured probability of breakdown strength,
Eb is the cumulative breakdown probability at 63.2% and
β is the shape parameter related to the scatter of data. The Weibull distribution image and corresponding
Eb values are shown in
Fig. 7 and
Table 1. Compared with the pure PS (
Eb = 430 MV m
−1), the
Eb of BTO@PS-
co-mah/PS increases from 429 MV m
−1 to a maximum of 507 MV m
−1 and then decreases to 359 MV m
−1 as the filler content varied from 1 wt% to 17 wt%. At low filler content of no more than 5 wt%, the interface layer of PS-
co-mah introduces chemical traps of deep energy, which would reduce the carrier mobility and suppress the space charge accumulation resulting in the delayed dielectric breakdown, thus the enhanced
Eb values. While as the filler content continues to increase, the effect of deep traps is weakened and a large number of charges are injected from the electrode leading to increased electrical conductivity and reduced breakdown strength. Moreover, the
Eb of BTO-NH
2/PS with 5 wt% filler content declined compared to that of pure PS due to the poor compatibility and defects between the filler and PS matrix. On the other hand, the breakdown strength of BTO@PS-
co-mah/PS with the same filler loading was significantly upgraded, owing to the superior compatibility derived from the PS segment in the interface-modified reagents and the PS matrix as well as the deep energy traps originating from the interface coating. As a result, with the same filler content of 5 wt%, the
Eb of BTO@PS-
co-mah/PS was 18% higher than that of pure PS and 42% higher than that of BTO-NH
2/PS.
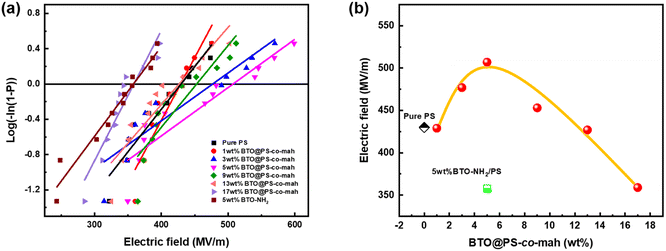 |
| | Fig. 7 (a) Weibull distribution fitting and (b) breakdown strength of PS-based nanocomposite films with different BT@PS-co-mah contents at room temperature. | |
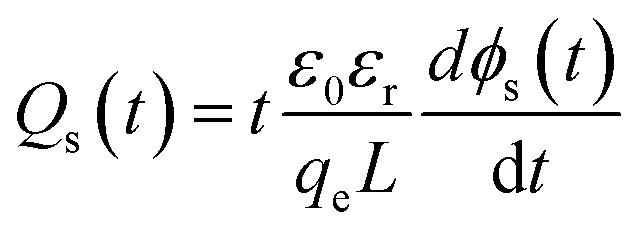
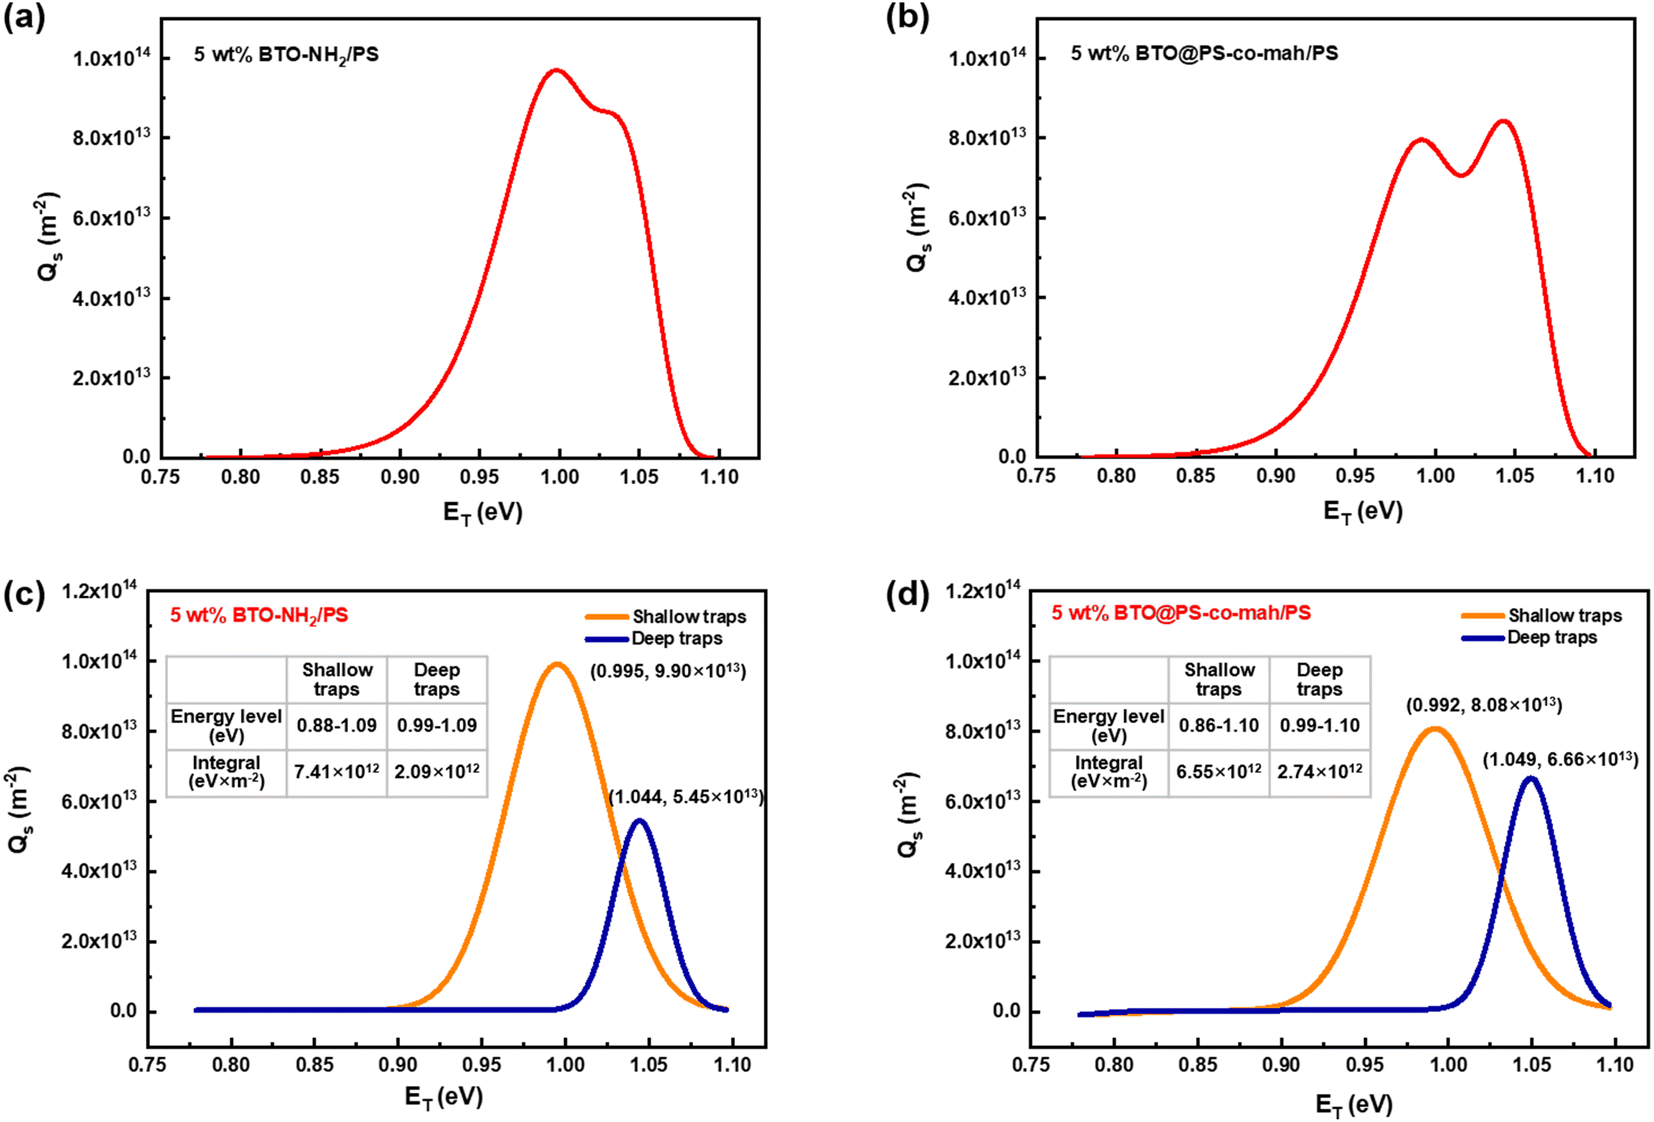
The characteristics of the energy traps in the PS-based composites were probed by the isothermal surface potential decay (ISPD) method to confirm the effect of the coating layer of PS-co-mah. According to the isothermal current decay theory, the energy level of traps (ET) and the trapped charge density (Qs) can be calculated as follows:
| | |
ET = kBTln(νATEt)
| (2) |
| |
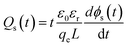 | (3) |
In eqn (2), kB is the Boltzmann constant, T is the temperature of the sample, νATE is the escape frequency of the trapped charge (4.17 × 10¹³ s−1), and t is the time of potential decay. In eqn (3), ε0 is the vacuum permittivity, εr is the relative permittivity, qe is the elementary charge of 1.6 × 10⁻¹⁹ C, L is the thickness of the sample, ϕ(t) is the time-dependent surface potential of the sample. The carriers would escape from the traps when gaining energy. It is easier for the charges in shallow traps than that in deep traps to escape because of the lower energy barrier. Fig. 8a and b illustrate the energy level and the density distribution of traps in BTO-NH2/PS (5 wt%) and BTO@PS-co-mah/PS (5 wt%), respectively. The corresponding peak-splitting curves are shown in Fig. 8c and d. Compared with BTO-NH2/PS, BTO@PS-co-mah/PS exhibits a decreased number of shallow traps with an integral decline from 7.41 × 10¹² eV m−2 to 6.55 × 10¹² eV m−2 because of the reduction in the trapped charge density. When it comes to the deep traps, owing to the enhanced value of Qs, the number of deep traps in BTO@PS-co-mah/PS increases to 2.74 × 10¹² eV m−2, which is 31% higher than that of BTO-NH2/PS (2.07 × 10¹² eV m−2). In addition, the center of the energy level also increased from 1.044 eV to 1.049 eV. It can be concluded that in the interfacial-modified BTO@PS-co-mah/PS, the depth, as well as the number of deep traps, were enhanced, thanks to the coating layer of PS-co-mah, though the shallow traps were decreased. It is well agreed that the deep energy traps at the interfacial region could capture charge carriers, thus resulting in a weakened local electric field, suppressed transporting rate of charge carriers, and delayed dielectric breakdown. Consequently, the value of Eb is significantly enhanced in BTO@PS-co-mah/PS (507 MV m−1) compared with BTO-NH2/PS (358 MV m−1).
 |
| | Fig. 8 Charge density distribution in (a) BTO-NH2/PS (5 wt%) and (b) BTO@PS-co-mah/PS (5 wt%); the peak-splitting results of charge density distribution in (c) BTO-NH2/PS (5 wt%) and (d) BTO@PS-co-mah/PS (5 wt%). | |
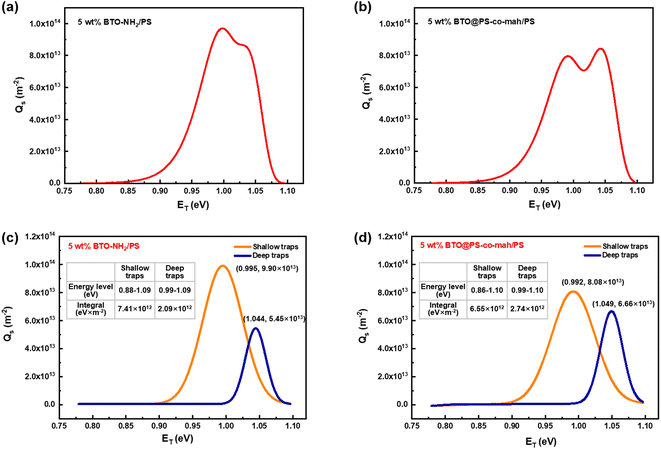
Furthermore, COMSOL Multiphysics was adopted to identify the effect of the interfacial coating on the local electric field distribution and dielectric breakdown development. The preset permittivities of BTO, PS-co-mah, and PS are 3000, 3, and 2, respectively. The simulated results of the electric field distribution and polarization distribution are presented in Fig. 9. It is revealed that the nanocomposite of BTO/PS without the interface modulation manifests a severe concentration of local electric field at the interface between BTO particles and the PS matrix, stemming from the strong polarization around the surface of BTO parallel to the direction of the electric field. The locally distorted and excessively high electric fields around the interface would result in a higher probability of occurrence of dielectric breakdown than that in the pure polymer matrix. While in composites of BTO@PS-co-mah/PS with interface modification, there is something different. PS-co-mah would exhibit stronger polarity and higher permittivity than pure PS due to the large dipole moment (3.95 Debye) derived from the copolymerized maleic anhydride segment. Therefore, chemical traps with deep energy are introduced at the interfacial region to trap space charge and suppress severe electric field distortion. As a result, enhanced Eb was acquired in the interfacial-modified BTO@PS-co-mah/PS nanocomposite, which is consistent with the results from Weibull breakdown and ISPD measurement.
 |
| | Fig. 9 Finite element simulation of electric field distribution of (a) BTO/PS, (b) BTO@PS-co-mah/PS, and polarization distribution of (c) BTO/PS, (d) BTO@PS-co-mah/PS. | |
The theoretical energy density (Ue) was explored using the following equation:
| |
 | (4) |
where
εr is the relative permittivity,
ε0 is the dielectric constant in free space (8.85 × 10
−12 F m
−1) and
Eb is the breakdown strength. The energy density indicates a similar changing trend with breakdown strength because
Eb has a greater impact on
Ue. The highest energy density achieved was 3.20 J cm
−3 (
Table 1) at the BTO@PS-
co-mah content of 5 wt%, which is 1.5 times that of the pure PS and 2 times BTO-NH
2/PS. The increased energy density is owing to the enhanced breakdown strength and permittivity which are associated with effective interfacial modification.
Conclusions
In summary, a series of composite films of BTO@PS-co-mah/PS with brilliant mechanical and dielectric properties were designed and fabricated by the solution casting method. The BTO@PS-co-mah/PS nanocomposites present permittivity of 2.68–3.54, dissipation factor of 0.00060–0.00306, Weibull breakdown strength of 359–507 MV m−1 and calculated maximum energy density of 2.02–3.20 J cm−3 with the filler content varying from 1 wt% to 17 wt%. The optimal dielectric performance was obtained at the BTO@PS-co-mah loading of 5 wt%. It is demonstrated that the interface layer of PS-co-mah contributes to the significantly upgraded properties. The copolymer of PS-co-mah would not only take a reaction with the aminated BTO resulting in strong chemical bonds but also benefit from the uniform dispersion of the inorganic particles in the PS matrix because of the same polystyrene composition. Therefore, the compatibility between the inorganic filler and polymer matrix is improved effectively. More importantly, the deep traps introduced by the interface layer of PS-co-mah would trap the space charges leading to the weakened local electric field and reduced carrier conductance so as to acquire enhanced Eb and decreased tanδ. The composite dielectrics of BTO@PS-co-mah/PS with high energy density and low dielectric loss are promising for applications such as film capacitors.
Conflicts of interest
The authors declare no competing interests.
Acknowledgements
The authors would like to acknowledge the financial support from the National Natural Science Foundation (Grant No. 51907187) and the Institute of Electrical Engineering, CAS (E155440301). The authors thank Dr Chuansheng Zhang and Prof. Cheng Zhang of the Institute of Electrical Engineering, Chinese Academy of Sciences for their great help in ISPD measurement.
References
- H. Luo, X. Zhou, C. Ellingford, Y. Zhang, S. Chen, K. Zhou, D. Zhang, C. R. Bowen and C. Wan, Chem. Soc. Rev., 2019, 48, 4424–4465 RSC.
- L. Sun, Z. C. Shi, H. L. Wang, K. Zhang, D. Dastan, K. Sun and R. H. Fan, J. Mater. Chem. A, 2020, 8, 5750–5757 RSC.
- X. Lin, M. Salari, L. M. R. Arava, P. M. Ajayan and M. W. Grinstaff, Chem. Soc. Rev., 2016, 45, 5848–5887 RSC.
- M. M. Thackeray, C. Wolverton and E. D. Isaacs, Energy Environ. Sci., 2012, 5, 7854–7863 RSC.
- T. M. Gur, Energy Environ. Sci., 2018, 11, 2696–2767 RSC.
- H. Li, B. Yao, Y. Zhou, W. Xu, L. Ren, D. Ai and Q. Wang, ACS Appl. Energy Mater., 2020, 3, 8055–8063 CrossRef CAS.
- Y. Zhou, C. Yuan, S. Wang, Y. Zhu, S. Cheng, X. Yang, Y. Yang, J. Hu, J. He and Q. Li, Energy Storage Materials, 2020, 28, 255–263 CrossRef.
- J. J. Wei and L. Zhu, Prog. Polym. Sci., 2020, 106, 101254 CrossRef CAS.
- D. Q. Tan, Adv. Funct. Mater., 2019, 30, 1808567 CrossRef.
- C. Ding, X. Tang, S. Yu, S. Chen, Z. Liu, H. Luo and D. Zhang, J. Mater. Chem. C, 2022, 10, 6323–6333 RSC.
- G. He, Z. Liu, C. Wang, S. Chen, H. Luo and D. Zhang, ACS Sustainable Chem. Eng., 2021, 9, 8156–8169 CrossRef CAS.
- A. F. Baldwin, T. D. Huan, R. Ma, A. Mannodi-Kanakkithodi, M. Tefferi, N. Katz, Y. Cao, R. Ramprasad and G. A. Sotzing, Macromolecules, 2015, 48, 2422–2428 CrossRef CAS.
- H. Tong, J. Fu, A. Ahmad, T. Fan, Y. Hou and J. Xu, Macromol. Mater. Eng., 2019, 304, 1800709 CrossRef.
- R. Ma, V. Sharma, A. F. Baldwin, M. Tefferi, I. Offenbach, M. Cakmak, R. Weiss, Y. Cao, R. Ramprasad and G. A. Sotzing, J. Mater. Chem. A, 2015, 3, 14845–14852 RSC.
- H. Tong, A. Ahmad, J. Fu, H. Xu, T. Fan, Y. Hou and J. Xu, J. Appl. Polym. Sci., 2019, 136, 47883 CrossRef.
- R. G. Lorenzini, W. M. Kline, C. C. Wang, R. Ramprasad and G. A. Sotzing, Polymer, 2013, 54, 3529–3533 CrossRef CAS.
- A. Ahmad, H. Tong, T. Fan and J. Xu, J. Polym. Sci., 2021, 59, 1414–1423 CrossRef CAS.
- G. He, Y. Liu, C. Wang, S. Chen, H. Luo and D. Zhang, Chem. Eng. J., 2022, 446, 137106 CrossRef CAS.
- A. Ahmad, G. Liu, S. Cao, X. Liu, J. Luo, L. Han, H. Tong and J. Xu, Macromol. Rapid Commun., 2022, e2200568, DOI:10.1002/marc.202200568.
- Q.-K. Feng, J.-B. Ping, J. Zhu, J.-Y. Pei, L. Huang, D.-L. Zhang, Y. Zhao, S.-L. Zhong and Z.-M. Dang, Macromol. Rapid Commun., 2021, 42, 2100116 CrossRef CAS PubMed.
- A. Ahmad, H. Tong, T. Fan and J. Xu, J. Appl. Polym. Sci., 2021, 138, 50997 CrossRef CAS.
- L. Chen, Y. Ding, T. Yang, C. Wan and H. Hou, J. Mater. Chem. C, 2017, 5, 8371–8375 RSC.
- Z. Pan, L. Yao, J. Liu, X. Liu, F. Pi, J. Chen, B. Shen and J. Zhai, J. Mater. Chem. C, 2019, 7, 405–413 RSC.
- H. Tang, P. Wang, P. Zheng and X. Liu, Compos. Sci. Technol., 2016, 123, 134–142 CrossRef CAS.
- W. Zhou, T. Li, M. Yuan, B. Li, S. Zhong, Z. Li, X. Liu, J. Zhou, Y. Wang, H. Cai and Z.-M. Dang, Energy Storage Materials, 2021, 42, 1–11 CrossRef.
- W. Peng, W. Zhou, G. Cao, Y. Yang, J. Cao, F. Kong, G. Wang, A. Feng and L. Luo, High Perform. Polym., 2022, 34, 1177–1192 CrossRef CAS.
- J. Fu, Y. Hou, M. Zheng, Q. Wei, M. Zhu and H. Yan, ACS Appl. Mater. Interfaces, 2015, 7, 24480–24491 CrossRef CAS PubMed.
- C. J. Shuai, G. F. Liu, Y. W. Yang, F. W. Qi, S. P. Peng, W. J. Yang, C. X. He, G. Y. Wang and G. W. Qian, Nano Energy, 2020, 74, 104825 CrossRef CAS.
- C. Shuai, G. Liu, Y. Yang, F. Qi, S. Peng, W. Yang and Z. Liu, Ceram. Int., 2019, 45, 20234–20242 CrossRef CAS.
- X. Zhang, C. Zhang, Y. Lin, P. Hu, Y. Shen, K. Wang, S. Meng, Y. Chai, X. Dai, X. Liu, Y. Liu, X. Mo, C. Cao, S. Li, X. Deng and L. Chen, ACS Nano, 2016, 10, 7279–7286 CrossRef CAS PubMed.
- C.-L. Ding, S.-Q. Yu, X.-X. Tang, Z.-J. Liu, H. Luo, Y. Zhang, D. Zhang and S. Chen, Composites, Part A, 2022, 163, 107214 CrossRef CAS.
- L. Zhang, J. Zhao, E.-Q. Huang, J.-W. Zha and Z.-M. Dang, J. Appl. Polym. Sci., 2015, 132, 41398 Search PubMed.
- F. Amaral, C. P. L. Rubinger, F. Henry, L. C. Costa, M. A. Valente and A. Barros-Timmons, J. Non-Cryst. Solids, 2008, 354, 5321–5322 CrossRef CAS.
- F. He, K.-H. Lam, J. Fan and L. H. Chan, Carbon, 2014, 80, 496–503 CrossRef CAS.
- S. Moharana and R. N. Mahaling, J. Aust. Ceram. Soc., 2020, 56, 751–760 CrossRef CAS.
- D. Wang, M. Huang, J.-W. Zha, J. Zhao, Z.-M. Dang and Z. Cheng, IEEE Trans. Dielectr. Electr. Insul., 2014, 21, 1438–1445 CAS.
- C. Yang, C. Marian, J. Liu, Q. Di, M. Xu, Y. Zhang, W. Han and K. Liu, Polymers, 2019, 11, 638 CrossRef PubMed.
- K. Yang, X. Huang, L. Xie, C. Wu, P. Jiang and T. Tanaka, Macromol. Rapid Commun., 2012, 33, 1921–1926 CrossRef CAS PubMed.
- S. Li, D. Min, W. Wang and G. Chen, IEEE Trans. Dielectr. Electr. Insul., 2016, 23, 2777–2785 CAS.
- C. Ren, C. Zhang, D. Hu, C. Zhang, F. Kong, T. Shao and P. Yan, Plasma Sci. Technol., 2020, 22, 044002 CrossRef CAS.
|
| This journal is © The Royal Society of Chemistry 2023 |
Click here to see how this site uses Cookies. View our privacy policy here. 
 Open Access Article
 This Open Access Article is licensed under a Creative Commons Attribution-Non Commercial 3.0 Unported Licence
 *b,
Jinpeng Luob,
Jiafeng Zhub,
Shimo Caobc,
Ju Xubc and
Yudong Hou
*b,
Jinpeng Luob,
Jiafeng Zhub,
Shimo Caobc,
Ju Xubc and
Yudong Hou