 Open Access Article
Creative Commons Attribution 3.0 Unported Licence
Vat photopolymerization-based 3D printing of polymer nanocomposites: current trends and applications
Mussadiq Shah
 abc,
Abid Ullah
 *abd,
Kashif Azher
 ab,
Asif Ur Rehman
 abe,
Wang Juan
f,
Nizami Aktürkab,
Celal Sami Tüfekcig and
Metin U. Salamci
 abg
abg
aAdditive Manufacturing Technologies Application and Research Center-EKTAM, Ankara, Turkey. E-mail: abid.ullah@gazi.edu.tr; Web: abidmech95@gmail.com
bDepartment of Mechanical Engineering, Faculty of Engineering, Gazi University, Ankara, Turkey
cState Key Laboratory for Mechanical Behavior of Materials, School of Materials Science and Engineering, Xi'an Jiaotong University, P. R. China
dCAS Key Laboratory of Mechanical Behavior and Design of Materials, Department of Modern Mechanics, University of Science and Technology of China, P. R China
eERMAKSAN, Bursa, 16065, Turkey
fDepartment of Industrial Engineering, Nanchang Hangkong University, Nanchang, P. R China
gAdvanced Manufacturing Technologies Center of Excellence-URTEMM, Ankara, Turkey
First published on 6th January 2023
Abstract
The synthesis and manufacturing of polymer nanocomposites have garnered interest in recent research and development because of their superiority compared to traditionally employed industrial materials. Specifically, polymer nanocomposites offer higher strength, stronger resistance to corrosion or erosion, adaptable production techniques, and lower costs. The vat photopolymerization (VPP) process is a group of additive manufacturing (AM) techniques that provide the benefit of relatively low cost, maximum flexibility, high accuracy, and complexity of the printed parts. In the past few years, there has been a rapid increase in the understanding of VPP-based processes, such as high-resolution AM methods to print intricate polymer parts. The synergistic integration of nanocomposites and VPP-based 3D printing processes has opened a gateway to the future and is soon expected to surpass traditional manufacturing techniques. This review aims to provide a theoretical background and the engineering capabilities of VPP with a focus on the polymerization of nanocomposite polymer resins. Specifically, the configuration, classification, and factors affecting VPP are summarized in detail. Furthermore, different challenges in the preparation of polymer nanocomposites are discussed together with their pre- and post-processing, where several constraints and limitations that hinder their printability and photo curability are critically discussed. The main focus is the applications of printed polymer nanocomposites and the enhancement in their properties such as mechanical, biomedical, thermal, electrical, and magnetic properties. Recent literature, mainly in the past three years, is critically discussed and the main contributing results in terms of applications are summarized in the form of tables. The goal of this work is to provide researchers with a comprehensive and updated understanding of the underlying difficulties and potential benefits of VPP-based 3D printing of polymer nanocomposites. It will also help readers to systematically reveal the research problems, gaps, challenges, and promising future directions related to polymer nanocomposites and VPP processes.
1. Introduction
Additive manufacturing (AM) is a group of manufacturing technologies that build objects in a layer-by-layer fashion from a CAD model. According to the ISO/ASTM 52900 standard, AM is defined as ‘‘the process of joining materials to make parts from 3D model data, usually layer upon layer, as opposed to subtractive and formative manufacturing methodologies’’.1 This technology was called rapid prototyping in the initial years, whereas nowadays the term 3D printing is widely used in a non-technical context, while the term additive manufacturing is used more formally.1–3 AM technologies can be grouped into seven different types, including material jetting, binder jetting, powder bed fusion, sheet lamination, material extrusion, direct energy deposition and vat photopolymerization.4,5 All these processes follow a common operation using the same steps, i.e., joining 2d layers on top of each other until the 3D final part is built.6AM has the ability to create complex parts in a short lead time, having great design freedom with little human interaction involved. AM as versatile technology has found applications in many fields such as aerospace, biomedical, automotive, energy and consumer products. AM is on the way to digitalization and will soon emerge as key technology in the next few decades in the context of Industry 4.0.7,8 The forecast for the next five years shows tremendous growth in the AM technology. According to Wohler's Report, the global revenue of all AM products and services grew by 19.5% to $15.2 billion.9 This is an increase from 7.5% growth in 2020, which was impacted greatly by the pandemic. The first commercialized method in AM is stereolithography (SLA), which was developed in 1988, followed by rapid advances in the next two decades, giving birth to other AM technologies. The past decade has witnessed significant research on VPP processes using nanoparticles to fine-tune the desired properties.
The use of polymer nanocomposites in VPP processes is a multidisciplinary area of research, which involves the interaction of machines, materials, computer control systems, etc. The synergy of both technologies showed tremendous enhancements in biomedical, structural, functional, electrical and thermal applications. If research and innovations continue at this pace, soon we will enter a new era of revolution where these processes can surpass the traditional manufacturing techniques.
However, not all research is focused on enhancing the desired properties, where technological aspects, filler matrix interfaces, design considerations, curing methods, etc. are also studied in parallel. There are several good in-depth reviews available. Readers who wish to study these detail are referred to the reviews regarding biomedical AM,10–14 current developments in AM,15–18 design for AM,6,19–21 materials in AM,22 polymers and polymerization,23–31 characterizations in AM,32 multi-material 3D printing,33 and nanocomposites in AM.34–36
Alternatively, in this review, we aim to provide a theoretical background and the engineering capabilities of VPP with a focus on the polymerization of nanocomposite polymer resins. Specifically, the configuration, classification and factors affecting VPP are summarized in detail. Furthermore, the different challenges in the preparation of polymer nanocomposites are discussed together with pre and post-processing. Subsequently, several constraints and limitations that hinder the printability and photo curability of nanocomposites are critically discussed. The main focus is the applications of printed polymer nanocomposites and the enhancement in their properties such as mechanical, biomedical, thermal, electrical and magnetic properties. The recent literature in the past three years is critically discussed and their main contributing results in terms of applications are summarized in the form of tables. Finally, the limitations, challenges, and possible approaches are presented for current and upcoming implementations.
2. Vat photopolymerization and nanocomposites
VPP is a general term used to describe several AM technologies. It can be defined as the process by which a liquid polymer resin is selectively cured by a light source in a layer-by-layer manner from a 3D model. The VPP processes include stereolithography (SLA), digital light processing (DLP), continuous digital light projection (CDLP) and two-photon polymerization (2PP). For ease and simplicity, we will discuss SLA and DLP, and further in this study, the term VPP will only describe SLA and DLP. SLA was the first commercial 3D-printing method, which was developed by Charles Hull in 1988. Since then, many advancements in this process have emerged including DLP and CDLP. The high resolution, part strength, and ability to make intricate polymer parts of VPP processes are some of the key features that distinguish them from other AM techniques. The key differences in the common VPP processes are listed in Table 1.| Process | Light source | Lateral resolution x–y res [μm] | Layer thickness z res [μm] | Printing speed [mm h−1] | Main features |
|---|---|---|---|---|---|
| a Stereolithography. b Digital light processing. c Continuous digital light projection. d Digital micromirror device. | |||||
| SLAa | Laser beam | 6.5–25 | 25–300 | 14 | Most common VPP technology |
| Either be a top-down (light source is above) or bottom-up (light source is below the vat) approach | |||||
| Slow but highly accurate | |||||
| Better surface finish | |||||
| UV light is the common light source | |||||
| DLPb | Projector | 33–120 | 25–150 | 25–150 | Printing speed is faster than SLA due to DMDd, but the resolution and accuracy is not as high |
| DMD is used to rotate and reflect the light | |||||
| The image of each layer comprised of rectangular voxels is called the voxel effect | |||||
| Bottom-up approach | |||||
| CDLPc | Projector | 50–100 | 0.4–100 | 500–1000 | A new technique introduced in 2015 |
| Up to 100 times faster than any AM method | |||||
| Bottom-up approach | |||||
| Vat contains an oxygen-permeable window | |||||
| A dead zone is created between the window and the surface of the part being cured, which inhibits the photopolymerization | |||||
| Thus, the part being cured is continuously drawn out of the resin vat | |||||
| Smooth parts with good surface finish are built | |||||
A composite is formed by joining or mixing a reinforcement inside a matrix. Polymer nanocomposites are formed when the reinforcement is a nanomaterial and the matrix is a polymer phase. Nanomaterials can be defined as materials that have at least one internal or external dimension in the range of 1–100 nm.37 The properties of nanomaterials are different from their bulk counterpart such as lower melting point, high specific surface area, high mechanical strength, and specific optical properties. By approaching the nm scale, there is a significant effect on the surface area to volume (SA/V) ratio. This increase in the SA/V ratio of nanomaterials has an important effect on their geometrical integrity, having the ability to fine-tune different properties compared to the same material in bulk form.38 Furthermore, to make use of these unique properties of nanomaterials, they are mixed in polymer resins to enhance the specific desired properties by printing customized 3D objects. The nanocomposites printed by VPP are mostly applied in the health care field, such as drug delivery, tissue engineering, customized bone, and dental implants.10,13,39–46 Similarly, their properties such as mechanical, electrical, optical, and magnetic properties are also widely studied.47–59
3. Configuration, classification and factors affecting vat photopolymerization
3.1 Configuration of stereolithography apparatus
The typical VPP apparatus is shown in Fig. 1(a) and consists of five main parts including a resin vat, recoater blade, build platform, light source, and control systems. The liquid photopolymer resin is placed in the vat. The recoater is used to distribute and swipe the liquid resin when a layer is cured. The build platform attached to an elevator moves upside down and the part is built on it. The light source, usually a laser light of different types (diode, He–Cd, and argon), hits the resin surface from the top. Finally, the control system controls the overall print process, which contains process, beam, and environment controllers.6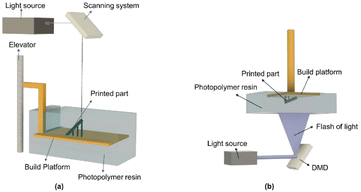 | ||
| Fig. 1 Graphical representation of (a) top down (vector scan) and (b) bottom up (mask projection) approach. | ||
3.2 Classification of printing processes
The printing process in VPP can be classified based on the platform movement and type of light exposure. In this case, the main theme is the same for all, i.e., building a 3D object layer by layer from a CAD model upon exposure to light. However, there are some key differences among them, which are described below.The second configuration is the bottom-up approach, as shown in Fig. 1(b). In this approach, the build platform lies initially at the bottom of a shallow resin tank, which is known as the vat. The bottom of the vat is transparent and the light source hits the resin through this transparent window. Upon exposure to a light source, the first layer is cured, the build platform moves upwards, and a fresh resin comes between the vat window and the already cured layer. This new fresh layer of resin is now exposed to light and the process continues until the part is finished. However, there are some drawbacks related to the top-down approach. Specifically, gravity deteriorates the resin surface, and therefore the layer thickness is difficult to control in this setup. Also, the equilibrium of the photopolymer resin is disturbed as the build platform moves downwards in the resin. Therefore, the recovery of the equilibrium state consumes some extra time, which affects the whole print process given that no printing occurs at that moment. Furthermore, oxygen is always in contact with the fresh resin layer, which inhibits photopolymerization, thus resulting in incomplete curing. Moreover, the sufficient resin is required in this approach as the whole part is built inside the resin. Also, surface tension and viscosity can create a problem when swiping the resin around the part being build.
Some of the problems encountered in the top-down approach can be alleviated by employing the bottom-up approach. The part height is independent of the vat depth, as the part is built facing downwards and built outside the resin, and thus objects with large heights can be printed with less material, resulting in no or little material wastage. Given that the layer thickness is controlled by the platform movement and not by the resin parameters, a smaller layer thickness can be achieved precisely. Also, this approach offers better surface quality and vertical resolution than the top-down approach.
The mask projection method enables a shorter print time but compromises the accuracy. The point-wise approach takes more time but can print a more complex part with intricate details and high resolution. If there are no time constraints, then the point-wise approach is preferable for performing research in academia because of its high accuracy, which may not be obtainable by fast DLP printers. Most of the literature studies used commercially available printers. However, some made their own customized printers,62–64 while some modified existing systems in their research.46,65
3.3 Factors affecting the printing process
VPP-based 3D printing is a complex process and is affected by many parameters. Some factors are technical, which are related to the apparatus, while the others are the resin parameters. The factors related to the apparatus are the layer thickness, laser type, laser power, laser speed, hatch spacing, machine instability, etc.Alternatively, the factors related to the resin are the penetration depth, critical energy, viscosity, etc. All these parameters are important and have a substantial effect on obtaining the desired properties of the final part.
The curing precision determines the printing details and is related to the cure depth, Cd, and cure width, Cw. The cure width at the surface of the resin is the greatest because of the parabolic shape formed by the laser hitting the resin. In modelling the photocuring behaviour in stereolithography, two assumptions are made, i.e., the laser beam hitting the resin is Gaussian and the photopolymer resin obeys the Beer–Lambert law. An important theoretical relationship can be observed based on these assumptions, as shown below. The derivation and more technical details can be found in ref. 66.
Cd = Dp![[thin space (1/6-em)]](https://www.rsc.org/images/entities/char_2009.gif) ln(Emax/Ec) ln(Emax/Ec) |
The photocuring behaviour is characterized by a straight line, which is known as the working curve by plotting the cure depth versus exposure, as shown in Fig. 2.67 The working curve gives information about two key resin constants, i.e., Ec and Dp. The slope of the working curve defines Ec at the laser wavelength, while Dp is the slope of the line at that wavelength. Both the slope and intercept are independent of the laser parameters such as speed and power because Dp and Ec are resin parameters.
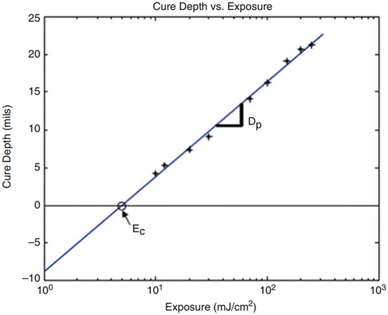 | ||
| Fig. 2 Resin working curve of cure depth vs. exposure (reproduced with permission from ref. 67 Copyright, 2015, Springer). | ||
One of the parameters that affects the printing process is the layer thickness, which is a key factor in describing the part quality and printing speed. Parts with a thick layer thickness are printed faster but at the expense of accuracy, resolution, and surface smoothness, while parts with a small layer thickness take more time to print but have higher resolution, better surface finish with intricate details and improved geometrical accuracy.
4. Feedstock materials
The feedstock material used in the VPP process using a polymer nanocomposite is a mixture of nanoparticles dispersed in a photopolymer resin. The resin serves as the polymer matrix, while the nanoparticles help to enhance the desired properties for some specific applications. Both nano reinforcement and the photopolymer resin are briefly discussed in the following section.4.1 Nano reinforcement
A nano reinforcement, as discussed earlier, is a particle having dimensions less than 100 nm. Among the different nanoparticles, cellulose nanocrystals (CNCs), carbon nanotubes (CNTs), hydroxyapatite (HA) and graphene particles are the most widely used. The resulting enhanced properties include mechanical, electrical, biomedical, magnetic properties, where the tensile strength and Young modulus are the most widely studied and enhanced in the context of mechanical properties.4.2 Photopolymer resin
A photopolymer resin is a polymer matrix that changes its properties when exposed to a light source.26 The physical change that occurs is the hardening of the liquid resin due to cross-linking when a light source hits the surface. Photopolymers mainly consist of photoinitiators, monomers, oligomers, and some additives, which are briefly described in the following sections. The typical SLA resin consists of monomers (∼25%), photoinitiators (∼5%), and oligomers (∼70%).6 Some other additional components such as pigment dyes, inhibitors, dispersion agents, and plasticizers can also be added in low quantities to optimize the properties of the resin.68 More comprehensive details about photopolymer resins can be found in ref. 23, 24, 26, 27, 69 and 70Additives improve the performance of photopolymer resins. Some common additives include diluents, sensitizers, pigments, and inhibitors. Diluents are added to the photopolymer resin to reduce the viscosity and proper wetting behaviour during the printing process. Generally, the incorporation of nanofillers in polymer resins results in an increase in viscosity, whereas diluents can help reduce it. Inhibitors control the gel time and penetration depth. Sensitizers are beneficial for the formation of reactive species from photoinitiators.24 Pigment dyes give colour, coupling agents enhance the nano-filler bond, while chain transfer agents are used to control and modify the crosslinking.67,70,72
Free radical polymerization occurs in acrylate-based resins and was the first type to be developed commercially. The molecular structure of acrylate is shown in Fig. 3. Once the long chains of polymers are very close to each other, after being initiated by photopolymers, cross-linking in acrylate occurs and solidification starts. The fundamental solidification process of free radical polymerization consists of three steps, i.e., initiation, propagation, and termination.69,73
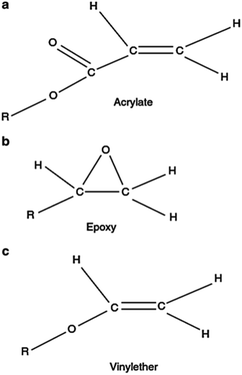 | ||
| Fig. 3 Molecular structure of different monomers. (a) Acrylate, (b) epoxy and (c) vinyl ether (reproduced with permission from ref. 67. Copyright 2015, Springer). | ||
Cationic polymerization occurs in epoxy-based and some vinyl ethers. The epoxy monomer has a ring-type structure, as shown in Fig. 3. Upon reaction, these rings open, forming some sites for other chemical bonds. Because of this ring opening, epoxy-based resins are less susceptible to shrinkage and have less tendency to curl. A photoinitiator catalyst initiates the reaction by generating cations after being exposed to a light source.69,71
5. Nanocomposite preparation
5.1 Preprocessing
Different preparation routes have been established to prepare polymer nanocomposite resins for VPP. The most widely used technique is known as solution mixing or solution intercalation, as shown in Fig. 4. The solution mixing method is the most widely used technique for the preparation of polymer nanocomposites, and hence many researchers employ this route. Typically, three steps are involved in this method, as follows: (1) mixing nanoparticles in a suitable solvent by applying different mechanical dispersing routes such as magnetic stirring, high-pressure homogenizing, and sonication or combination of any two. (2) Mixing the nanoparticle suspension in a polymer matrix by sonication. (3) Removal of the solvent by evaporating it in a vacuum oven or blast furnace.75A magnetic stirrer, high-pressure homogenizer, shear mixer, magnetic stirrer, and ultrasonic sonicator (probe and bath) are all used for mixing nanoparticles in the matrix, depending on the size and shape of the nanofiller, the nature of the solvent and the polymer matrix. The magnetic stirrer is a low-cost, simple lab-scale equipment, where a magnetic rod rotates at a high speed to mix the nanoparticles. However, the mixing efficiency of a magnetic stirrer is not very high and it can cause some bubbles or voids to be formed in the nanocomposite, which directly affects the achievable resolution and printability. Thus, to overcome this problem, a vacuum can be used to help remove the air bubbles from the suspension. Ultrasonication is the most efficient way to disperse nanoparticles in the resin. Two types of lab-scale sonicators are commonly available, which are ultrasonic bath and ultrasonic probes. Both types used acoustic sound waves to agitate the nanoparticles in a liquid. Similarly, a high-pressure homogenizer is also used. There is no specific rule to use one standard method for mixing. Basically, the purpose of all methods is the same, i.e., mix the nanoparticles in the polymer matrix. The main goal is to achieve a nanocomposite resin with a uniform dispersion with the nanoparticles homogenously mixed in the polymer matrix. To achieve a uniform and more homogenous mixture, two methods can be used synergistically. Manual mixing or magnetic stirring can be followed by sonication routes or the use of homogenizers and vice versa.
5.2 Challenges in nanocomposite preparation
The incorporation of nanoparticles in a polymer matrix sounds promising and has the ability to enhance many properties but due to their unique features, there are some challenges associated with the preparation of polymer matrix nanocomposites, as follows.To reduce the viscosity, diluents are mixed with the polymer.77,80 Similarly, an increase in temperature can also help reduce the viscosity but is limited to the resins that are insensitive to heat.27 If the viscosity of the nanocomposite resin is too high, printing will take more time, and due to uneven filling, it is more evident that some defects will appear on the printed part. Therefore, proper and optimized shear mixing or sonication will help control the viscosity by breaking down the clusters of aggregates.
5.3 Post-processing
Post-processing steps are required depending on the geometry of the printed part. Given that VPP processes involve the use of liquid resin, therefore when the printed part is taken from the build platform, it contains some uncured and unexposed resin. Thus, post-processing is required including cleaning, curing, polishing, etc. The cleaning process improves the quality by removing the impurities and the unexposed resin stuck to the printed part. This is done by pouring or soaking the printed part in some alcohol for a few minutes, followed by rinsing with the same alcohol. Isopropyl alcohol is preferred for cleaning, although other alcohols can also be used. After cleaning the part with alcohol, the extra support structures need to be cut off, which are necessary to support the already cured part during the printing process.The uncured resin that remains inside the part is completely cured by curing, which allows further crosslinking of the polymer part.74 Curing can be done by placing the part in front of a UV light or curing it thermally by placing it in an oven. Both processes enhance the desired properties.81 The mechanical and thermal properties of lignin-coated cellulose nanocrystal (L-CNC) nanocomposites were greatly improved when thermally post-cured at a temperature of 120 °C for 40 min.82 Nowadays, different commercial suppliers provide all-in-one UV cure, which can undergo both types of processing.83,84 Sometimes an additional step is required after curing to make the part smooth by polishing its surface. This is done using sandpaper with increasing grit in the range of 1500–200. A fine smooth surface is obtained after polishing but this process is very time-consuming and parts with complex and intricate surfaces cannot be polished easily.
6. Applications
Nanoparticles mixed with polymer matrices can achieve many desired properties and applications. The synergy of nanotechnology and VPP processes provides an efficient combination of applications compared to other AM methods. In this section, we focus on the recent literature from the past three years. Biomedical and mechanical applications are mostly studied, with a focus on electrical, magnetic and thermal properties. Some of the enhanced properties and their use in terms of applications are described below.6.1 Biomedical applications
One of the most promising applications of VPP processes and polymer nanocomposites is their use in the biomedical industry due to the achievable architecture, topography, geometry, wettability, and controlled pore size.11,13 The patient-specific medical needs in the healthcare market are increasing daily and are the most important applications of VPP. The health-care field acts as an important driving factor in the development of printing nanocomposites by VPP. Many nano-reinforcement materials are mixed with different types of resins to achieve the desired properties.3D bioprinting by VPP processes is an advance technique for the fabrication of patient-customized implants and scaffolds for tissue engineering, etc. The use of 3D bioprinting to produce customizable artificial tissue matrices with hierarchical structures shows significant potential. SLA-based VPP processes have been widely used to produce tissue engineering scaffolds.85–91 Compared to parts printed by FDM, VPP-printed parts provide enhanced fitting, higher resolution, and more comfort to patients.13,43
The nanofillers such as hydroxyapatite (HA), chitosan (CH) and zirconia (ZrO2) are the most widely studied and their resulting properties in terms of biomedical applications are summarized in Table 2.
| Polymer matrix/Nanofiller | Additives and reinforcements | Highlights | Properties enhanced | Applications | Ref. |
|---|---|---|---|---|---|
| Poly(ethylene glycol) diacrylate (PEGDA) + graphene oxide (GO) | GO conc. (0.05, 0.1, 0.25, 0.5, 1 wt%) | Self-prepared printer | Collagen II synthesis increased up to 66% | Human bone marrow scaffolds, cartilage, regenerative medicine | 63 |
| Irgacure 2959 (Photoinitiator PI) 0.5 wt% | Laser diameter 200 μm | GAG secretion increased up to 71% | |||
| Energy output 25 μJ | Total collagen level increased up to 43% | ||||
| Printing speed 10 mm s−1 | |||||
| Poly(ethylene glycol) diacrylate (PEGDA) + multi-walled carbon nanotubes (MWCNTs) | MWCNTs conc. (0.02, 0.05, 1 wt%) | Printrbot® printer | Maximum Young's modulus achieved was 1 MPa | Neural regeneration | 88 |
| Z-Axis resolution 110 μm | Maximum porosity achieved 66% | ||||
| Light wavelength 355 nm | Pulse stimulation 500 μA | ||||
| Energy output 20 μJ | |||||
| Laser diameter 190 ± 50 μm | |||||
| Laser frequency 8–30 kHz | |||||
| Printing speed 15 mm s−1 | |||||
| 1,6-Hexanediol diacrylate (HDDA) + hydroxyapatite (HA) | HA conc. (40, 45, 50 vol%) | AutoCera printer | Maximum flexural strength achieved 36.5 MPa | Bone tissue engineering | 92 |
| Diphenyl(2,4,6-trimethyl benzoyl) phosphine oxide (TPO) (PI) 1 wt% | Light wavelength 405 nm | Maximum compression strength achieved 161.9 MPa | |||
| Light intensity 8000 μW cm−2 | Maximum porosity achieved 54% | ||||
| Exposure time 8 s | Optimal sintering temp 1250 °C | ||||
| Layer thickness 25 μm | |||||
| Sintering temp 1200–1300 °C | |||||
| Acrylate resin + zirconia/hydroxyapatite (ZrO2/HA) | ZrO2/HA conc. (0, 10, 20, 30 wt%) | Layer thickness 0.02 mm | Maximum compression strength achieved was 52 MPa (HA) | Cancellous bone repair | 46 |
| Sintering temp 1400 °C | Maximum compressive modulus achieved was 4.7 GPa (HA) | ||||
| Maximum compression strength achieved was 39.99 MPa (ZrO2) | |||||
| WaterShed XC 11122 acrylate + hydroxyapatite (HA) | HA conc. (10, 20, 30, 40, 45 wt%) | LAYING II 1510P printer | Minimum shrinkage in XY and Z axis was 36.5% and 13.8%, respectively | Bone scaffolds | 89 |
| Layer thickness 0.02 mm | Volume shrinkage of 65.2% | ||||
| Print speed 20 mm s−1 | Maximum compressive strength achieved was 12.8 MPa | ||||
| Sintering temp 1200 °C | Proliferation of cells with 500% viability for 48 h | ||||
| Polylactic acid–polyurethane (PLA–PUA) + graphene | Graphene conc. (0.5 wt%) | Photon, ANYCUBIC printer | Maximum tensile strength achieved was 68 MPa (62% than casting) | Gyroid scaffold for bone tissue engineering | 39 |
| TEGDMA 37% | Light wavelength 405 nm | Maximum flexural strength achieved was 115 MPa | |||
| PLA-PUA 62 wt% | Light intensity 20 W | Maximum flexural modulus achieved was 5.8 GPa | |||
| Irgacure 819 (PI) 1 wt% | XY resolution 47 μm | ||||
| Z resolution 1.25 μm | |||||
| Urethane dimethacrylate (UDMA) + silver-carrying halloysite nanotubes (Ag-HNT) | Ag-HNT conc. (1, 2, 3 wt%) | Light wavelength 405 nm | Maximum flexural strength achieved was 105 MPa (increase in strength up to 25%) | Dentistry | 45 |
| UDMA 60 wt% | Shear strain 0.1 wt% | Maximum flexural modulus achieved was 2.3 GPa | |||
| Triethylene glycol dimethacrylate (TEGDMA) 40 wt% | Frequency 10 Hz | Relative cell viability of up to 75% | |||
| (TPO) 1 wt% | Irradiation power 1 mW cm−2 | ||||
| Layer thickness 0.25 mm | |||||
| Exposure time 12 s | |||||
| Z axis resolution 50 μm | |||||
| Methacrylate resin + zirconia (ZrO2) | ZrO2 conc. 78% | No data given | Maximum shrinkage in Z-axis was 28% | Dental implants | 93 |
| Dispersant 2 wt% | Optimal sintering temp of 1450 °C | ||||
| PI 5 wt% | Vickers hardness at surface was 1542 | ||||
| Vickers hardness at sides was 1268 | |||||
| Maximum bending strength achieved was 1268 MPa | |||||
| 1,6-Hexanediol diacrylate (HDDA) + hydroxyapatite (HA) | HA conc | Light wavelength 405 nm | Maximum compressive strength achieved was 22.5 MPa (CPS scaffolds) | Bone regeneration | 94 |
| TPO | Layer thickness 30 μm | Maximum compressive modulus was 4 GPa (CPS scaffolds) | |||
| Energy 10 mJ cm−2 | Maximum porosity achieved was 70% | ||||
| Exposure time 1.5 s | |||||
| Formlabs clear methacrylate resin + boron nitride (BN) | BN conc. (0, 0.5, 1 wt%) | Form 1+ printer | Maximum micro hardness was 135 MPa | Bone scaffolds | 95 |
| Light wavelength 405 nm | Maximum compressive strength achieved was 40.2 MPa | ||||
| Maximum compressive modulus was 438 MPa | |||||
| Loss tangent value was 0.14–24 | |||||
| Damping constant was 15.4 s−1 | |||||
| Methacrylic anhydride resin + chitosan (CH) | CH conc. (0.5, 1, 2, 4 wt%) | FLASHFORGE printer | Maximum tensile strength achieved was 82 kPa (increase in strength up to 20%) | Tissue engineering, nose architectures | 96 |
| Irgacure 2959 (PI) | Light wavelength 405 nm | Compressive modulus was 910 kPa | |||
| Irradiation power 15 mW cm−2 | Relative cell viability of up to 95% | ||||
| Exposure time 15 s | |||||
| Methacrylate resin + hydroxyapatite (HA) | HA conc. (20 and 40 wt%) | No data given | Proliferation rate of 400% | Bone repair, tissue engineering | 97 |
| TPO-L (PI) | Swelling was 9% after 28 days | ||||
| Photopolymer resin + iron oxide (IO) | IO conc. (1, 3, 5 wt%) | No data given | Relative cell viability of up to 95% | Bone regeneration | 98 |
| Magnetization range was 22.42–66.76 emu g−1 | |||||
| Maximum compression strength achieved was 70 N m−2 | |||||
| Young's modulus was 275 N m−1 | |||||
| Poly(ethylene glycol) diacrylate (PEGDA) + hydroxyapatite (HA) | HA conc. (0, 5, 10, 15 vol%) | Anycubic photon printer | Tensile strength was 30 MPa (increase in strength y up to 58%) | Repair and reconstruction of load bearing bone defects | 99 |
| Light wavelength 405 nm | Young's modulus 1.9 GPa (increase in modulus by up to 144%) | ||||
| Layer thickness 50 μm | Yield strength of 7% | ||||
| Exposure time 50 s | Maximum toughness achieved was 1.87 MPa | ||||
| 1,6-Hexanediol diacrylate (HDDA) + ZrO2–AlO2 | ZrO2 80 wt% | CeraBuilder 100 printer | Maximum linear shrinkage was up to 23% | Dental restorations | 100 |
| AlO2 20 wt% | Light wavelength 355 nm | Maximum density achieved was 5.9 g cm−3 | |||
| TPO 1 wt% | Layer thickness 0.04 mm | Vickers hardness was 16 GPa | |||
| Dispersant 2–5 wt% | Scanning speed 2000 mm s−1 | Fracture toughness was 6.8 MPa m−1/2 | |||
| Optimum sintering temperature was 1600 °C | |||||
| LithaBone HA 480 E acrylate resin + hydroxyapatite (HA) | — | CeraFab 7500 printer | Intrinsic permeability was 0.75–1.74 × 10⁻⁹ m2 | Bone replacement and bone tissue engineering | 101 |
| Light wavelength 460 nm | Compressive strength was 1.60 MPa | ||||
| X–Y resolution 40 μm | Elastic modulus was 513 MPa | ||||
| Layer thickness 25 μm | Maximum porosity obtained was 80% | ||||
| Poly(ethylene glycol) diacrylate (PEGDA) + hydroxyapatite (HA) | HA conc. (40–42 wt%) | XY resolution 200 μm | Max compressive strength achieved was 61 MPa (increase in strength by up to 1700%) | Bone regeneration | 102 |
| PI conc. (0.1, 0.25, 0.5, 0.75 wt%) | Layer thickness 30 μm | Elastic modulus was up to 2.3 GPa | |||
| Laser power 70 mW | Maximum cell viability was 115% | ||||
| Scanning speed 3.9 m s−1 | |||||
| 1,6-Hexanediol diacrylate (HDDA) + biphasic calcium phosphate (BCP) | BCP conc. (50.60, 65, 70, 75 wt%) | No data given | Shrinkage at 1300 °C was 22% | Bone tissue engineering | 103 |
| TPO conc. (0.5–2 wt%) | Maximum porosity achieved was 68% | ||||
| Maximum compressive strength achieved was 20 MPa | |||||
| Vickers hardness was 6 GPa | |||||
| Optimal sintering temperature 1300 °C | |||||
| Poly(ethylene glycol) diacrylate (PEGDA) + hydroxyapatite (HA) | HA conc. 40 vol% | Home-built printer | Viscosity achieved 200 mPa s | Personalized bone implants | 64 |
| Light wavelength 380–420 nm | Optimal sintering temperature 1300 °C | ||||
| Irradiation power 0.5 mW cm−2 | Tensile strength was 5 MPa | ||||
| Energy per layer 5–10 mJ cm−2 |
Zhou et al. investigated the effects of graphene oxide (GO)-based gelatin nanocomposite scaffolds on chondrogenic differentiation of human bone marrow mesenchymal stem cells. They successfully produced GO-incorporated a polymer nanocomposite (GelMA–PEGDA–GO) with a hierarchical structure using SLA 3D printing. The resultant scaffolds possessed superior mechanical properties and outstanding biocompatibility. The GelMA–PEGDA–GO scaffolds exhibited a significantly higher protein adsorption capacity than that without GO. In addition, following the GO-induced chondrogenic differentiation of hMSCs, the resulting nanocomposite scaffolds significantly increased the amounts of glycosaminoglycan (GAG) by up to 71%, total protein, and collagen, and thus are a potential option for use in the future of cartilage regenerative medicine applications.63
In another study, Se-Jun et al. printed scaffolds for nerve regeneration and produced well-dispersed multi-walled carbon nanotube (MWCNT) hydrogel-based nanocomposites with controllable porosity. They showed that customizable MWCNT scaffolds are great candidates for fostering neural differentiation, making them a promising approach for upcoming neural regeneration applications. This study found that scaffolds containing MWCNTs significantly boosted neural stem cell proliferation and early neuronal differentiation compared to the specimens having no MWCNTs. Additionally, biphasic pulse stimulation with a 500 μA current increased neuronal maturity, as measured by quantitative polymerase chain reaction protein expression analyses. The findings of this study showed that electrical stimulation and an electro conductive MWCNT scaffold may be combined to promote neurite outgrowth for therapeutic use in nerve regeneration.88
Owning to its high biocompatibility, 3D printing of hydroxyapatite (HA) bioceramic has been widely investigated for application in bone tissue engineering and bone defect healing. Numerous studies have used HA nanoparticles due to their biocompatibility and usefulness in patient-specific needs. Hydroxyapatite is a bioceramic material, making bone contents of up to 65%.104,105 HA-reinforced biocompatible composite resin is a perfect replica for making synthetic bone scaffolds compared to natural bone.
Feng et al. successfully fabricated HA bioceramic scaffolds by using SLA 3D printing. The major issues associated with HA bioceramic scaffolds, such as dispersion, sintering, mechanical characteristics, and biocompatibility, were examined in their findings. To fabricate HA bioceramic scaffolds, various solid loading slurries were used. Different concentrations of nanofiller (40, 45, and 50 vol%) were used in this study. Increasing the HA concentration resulted in a higher viscous resin, which produced more defects in the printing process, worse dispersion of the nanocomposite slurry, and less homogeneous microstructure. A highly dispersed HA-resin slurry was produced using Solsperse 17000 as the dispersant. The optimum solid loading and dispersant dose were determined to be 2 wt% and 50 vol%, respectively. The sintering of the HA bioceramic scaffold was also investigated. Here, 50 vol% solid loading and 1250 °C were chosen as the optimum values. The study of the mechanical properties and biocompatibility of the HA bioceramic scaffolds showed that these scaffolds have good potential for bone tissue engineering.92
Cao et al. reported the fabrication of porous scaffolds of zirconia/hydroxyapatite (ZrO2/HA) nanocomposites for application in bone repair by using DLP and evaluated their performance in detail. This study demonstrated that by varying the proportion of the two ceramic materials, the scaffolds may reach a specific range of controlled mechanical properties. According to the reported results, the compressive strength of the scaffold improved to 52.25 MPa when HA (10 wt%) was introduced compared to 39.99 MPa for the ZrO2 scaffold. However, as the quantity of HA increased to 20 wt%, the compressive strength started to decrease. Also, in the healing phase of bone damage, these nanocomposite scaffolds could maintain good mechanical properties and reduce the effect on the function of the damaged part.46
Tissue engineering is an interdisciplinary area that uses engineering applications in the field of biological sciences to find solutions to dysfunctional tissues or damaged bones. Owing to the fact that the printing of biocompatible and biodegradable polymer nanocomposites can be easily achieved using VPP, it is widely used nowadays to print customized scaffolds for tissue engineering applications.39–41,46,92,96,106 In this case, the function of a scaffold is to support a defective part and is not a permanent solution.13
Zeng et al. printed HA scaffolds for personalized tissue substitutes with excellent mechanical and biocompatible properties. The HA concentrations of 10, 20, 30, 40, and 45 wt% were used in this study. It was found that increasing the nanofiller concentration has a direct effect on the viscosity, as reported by ref. 92. The compressive strength of a bioceramic scaffold is an important index to evaluate the performance of scaffolds. After the sintering of the scaffolds, the shrinkage in the XY direction was larger than that in the Z direction. Overall, the volume shrinkage after sintering was found to be 65.2%. The biological properties of the scaffold were determined by in vitro cell culture. According to the cell proliferation results, these nanocomposite scaffolds were found to be biocompatible and suitable for cell growth and proliferation.89
Feng et al. investigated the bone tissue engineering applications of a graphene-based nanocomposite resin printed by SLA. They used a solvent-free approach for the preparation of a biodegradable nanocomposite resin and studied the mechanical properties of the 3D-printed test specimens with the direct cast method. It was found that the printed specimens had a high tensile strength of 68 MPa, which was almost 62% higher than that of the direct-casted specimens. Similarly, a high flexural strength of 115 MPa and modulus of 5.8 GPa were achieved. The effects of the printing parameters were also investigated, and it was found that a thinner printing layer had high resolution and excellent mechanical properties. Different porous bone structures such as jaw bone, sternum with different architectures and gyroid scaffold for bone tissue engineering were successfully printed, as shown in Fig. 5, which show great potential in biological tissue engineering in comparison to traditional mould-based casting methods.39
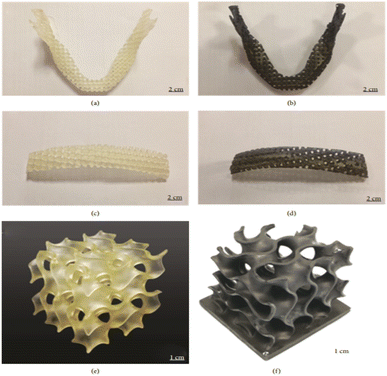 | ||
| Fig. 5 Images of (a) pure UV-cured resin and (b) graphene-reinforced nanocomposite jawbone with a square architecture. Images of (c) pure UV-cured resin and (d) graphene-reinforced nanocomposite sternum with a round architecture. Images of (e) pure UV-cured resin and (f) graphene-reinforced nanocomposite gyroid scaffold for bone tissue engineering (reproduced with permission from ref. 39. Copyright 2018, Hindawi). | ||
In another study, Liang et al. printed hydroxyapatite (HA)-based scaffolds with different porous architectures by DLP 3D printing. The mechanical properties, cell proliferation and morphology of these printed scaffolds were comparatively investigated. In addition, the rheological properties, curing abilities of the nanocomposite resin, debinding, and sintering strategy of the printed part were also systematically investigated. In this study, different types of porous structures such as triply periodic minimal surface-Schwarz primitive (P), body-centered cubic (BCC), and cubic pore-shaped (CPS) nanocomposite scaffolds with ∼70% porosity were printed. According to their results, the CPS scaffolds showed high compressive strength and modulus of up to 22.5 MPa and 400 MPa, respectively, as shown in Fig. 6. Also, the CPS scaffolds performed best in terms of active cell metabolism in comparison to the BCC and P-type scaffolds. These excellent performances of the CPS-based scaffolds were attributed to their small substrate curvature and large pore size, as shown in Fig. 7. This study provided guidance for the selection of different porous scaffolds and printing by DLP.94
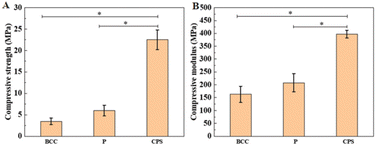 | ||
| Fig. 6 (A) Compressive strength. (B) Compressive modulus. * represents P < 0.05 (reproduced with permission from ref. 94. Copyright 2022, WHOICE). | ||
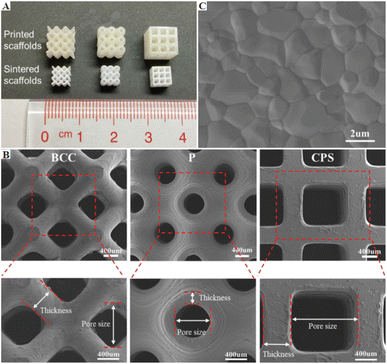 | ||
| Fig. 7 Image of the scaffolds. (A) Printed (upper row) and sintered (lower row) scaffolds. (B) Scanning electron microscopy (SEM) image of surface grains in sintered scaffolds. (C) SEM of the body-centered cubic, primitive, and cubic pore-shaped scaffolds in the top view and their magnified views. Mechanical properties of body-centered cubic, primitive and cubic pore-shaped scaffolds (reproduced with permission from ref. 94. Copyright 2022, WHOICE). | ||
Bustillos et al. studied boron nitride (BN) nanocomposites and compared the effect of nanofiller addition on the curing of the resin, micro-hardness, damping, and mechanical properties. Different concentrations of BN (0, 0.5, and 1 wt%) were used in this study. Subsequently, it was found that 1 wt% BN filler had a greater effect on the damping response and mechanical properties. It was found that the damping response in the 1 wt% nanocomposite exhibited loss tangent values two folds that of the controlled specimens, as shown in Fig. 8. Similarly, the compressive strength of the 1 wt% nanocomposite was found to be 23.8% more than that of the 0.5 wt% composite. The addition of increased BN concentrations increased the Tg of the resulting nanocomposites by up to 50 °C. The resulting nanocomposites showed their potential in bone tissue engineering applications.95
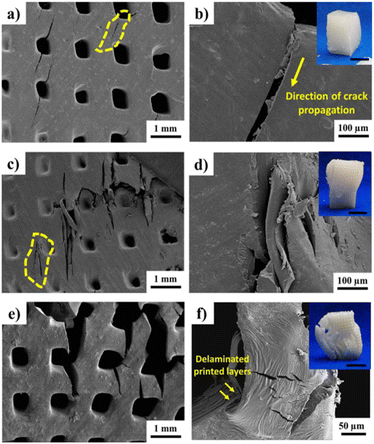 | ||
| Fig. 8 (a) Propagation of oriented (45°) cracks initiated in the walls of larger pores of pure PSP scaffolds. (b) Magnified view of the crack propagation from the pore corner. (c) Brittle fracture of 0.5 wt% boron nitride (BN) scaffolds, (d) sharp cleavage features in the propagation of cracks. (e) Propagation and opening of cracks in 1 wt% BN scaffolds. (f) Buckling and debonding of printed layers due to reduced cross-linking on scaffold structure. Insets show macroscopic images of SLA-printed scaffolds after compressive failure, where all scales are 1 cm (reproduced with permission from ref. 95. Copyright 2017, Wiley Online Library). | ||
Shen et al. proposed the use of a chitosan (CH)-based biocompatible nanocomposite for tissue engineering applications by DLP 3D printing. Different parameters including the concentration of nanofiller, rheology and curing of the nanocomposite resin, and mechanical properties of the 3D printed specimens were investigated in detail. The nanofiller concentration had a direct effect the on mechanical properties, where increasing the CH concentration from 2 to 3 wt% resulted in an increase in compressive modulus from 315 kPa to 910 kPa. According to the cytotoxicity tests, the chitosan-incorporated nanocomposite had excellent biocompatibility. Furthermore, a comparative study was done on the nanocomposite resin with extrusion-based 3D printing and it was found that its compatibility with DLP 3D printing makes this nanocomposite hydrogel an excellent feedstock material with high resolution, and good biocompatibility to print geometric constructions, noses, etc., as shown in Fig. 9.96
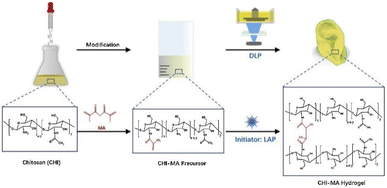 | ||
| Fig. 9 Chitosan-based nanocomposite preparation route. The schematic representation shows the chemical functionalization of chitosan with methacrylate groups and the photo curing process of CHI-MA hydrogels (reproduced with permission from ref. 96. Copyright 2022, Elsevier). For better illustration, visit the online version of this manuscript. | ||
Guillaume et al. studied the bone repair applications of scaffolds printed with hydroxyapatite (HA)-based polymer nanocomposites and investigated their osteopromotive properties in the absence of biologics. Multiple experiments were conducted to check the effects of HA concentration on the osteogenic differentiation of bone marrow stem cells in vitro and bone healing kinetics in vitro. Different concentrations of HA of 20 and 40 wt% were used in this study. According to their findings, when the nanofiller concentration was 20 wt%, the bone regeneration improved together with osteogenesis and degree of implant osseointegration. In short, this study showed the impacts of biomaterial fabrication in vitro and in vivo osteogenesis.97
Cojocaru et al. also studied the bone repair applications of biomimetic scaffolds incorporated with magnetic nanoparticles. Iron oxide (IO) nanofillers were loaded in the polymer resin together with other organic and inorganic fillers. Different mechanical and magnetic tests together with in vivo and in vitro assessments on the magnetic scaffolds were carried out. Their study revealed that the magnetic susceptibility, mechanical properties and biological fluid retentions were dependent on the final composition of the scaffolds and in the recommended range for bone regeneration applications. The porosity of the scaffolds could be altered by changing the nanofiller concentration in the polymer matrix. The magnetization value of the nanocomposite scaffolds was in the range of 22.42–66.76 emu g−1, which is an acceptable value for magnetically loaded materials for application in bone regeneration. Similarly, any printed scaffold should fulfil the requirement of mechanical properties to influence cell functions in tissues. In this case, the compression stress was found to be 70 N m−2 and the Young modulus was found to be 275 N m−2. The in vivo and in vitro studies of the nanocomposite scaffolds showed that they are promising feedstock materials for bone repair and regeneration.98
In another study, Mondal et al. printed acrylated epoxidized soybean oil-based hydroxyapatite (HA) nanocomposites for bone repair applications. Different concentrations of HA nanofillers were used in this study. Increasing the nanofiller concentration increased the strength and toughness of the 3D-printed nanocomposite. When 10 vol% of HA filler concentration was used, the tensile strength, modulus, and fracture toughness increased by 58%, 144% and 42%, respectively, in comparison with the control specimens. The resulting nanocomposite did not show any significant degradation in terms of hydrolytic, enzymatic, or oxidative when incubated for 4 weeks, thus proving its mechanical and chemical stability in the early stages of implantation. Furthermore, the excellent cell viability and proliferation make this nanocomposite efficient for application in bioactivity and bone defect repair.99
Baino et al. printed different scaffolds using hydroxyapatite (HA) nanofillers in a photopolymer resin and studied their permeability and mechanical properties. According to their findings, the porosity of the printed scaffolds obtained after sintering was nearly 80%. Similarly, the compression strength and modulus were found to be 1.60 MPa and 513 MPa, respectively, which are in the acceptable range of trabecular bone. These printed nanocomposites showed great potential in the development of porous scaffolds with mass transport properties and bone-like architectures, as shown in Fig. 10.101
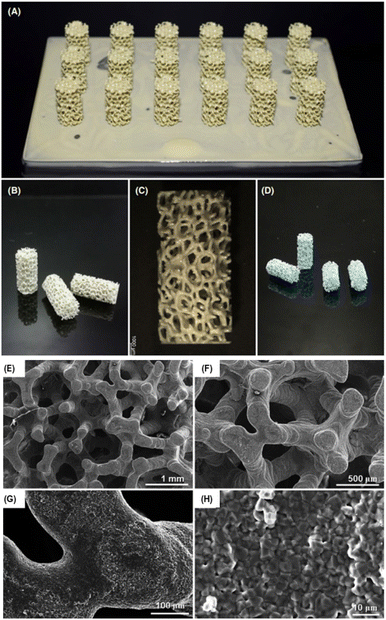 | ||
| Fig. 10 Results of the printing process: green cylindrical samples (A) attached to the building platform just after being printed and (B and C) after being cleaned from the uncured slurry. (D) Sintered nanocomposite scaffolds (E and F) SEM micrographs displaying the 3D trabecular architecture of HA scaffolds, (G) trabecular cross-section and (H) detail of the sintered walls at higher magnification (reproduced with permission from ref. 101. Copyright 2022, MDPI). | ||
Achieving optimal conditions in the pre- and post-processing of nanofiller-based bio ceramics is a significant challenge in ceramic-based nanocomposites. Wang et al. studied this issue and printed bone tissue engineering scaffolds using a biphasic calcium phosphate (BCP)-based bioceramic slurry. Different parameters and properties such as nanofiller concentration, sintering temperature, hardness, mechanical properties, and in vitro performance of the nanocomposites were systematically investigated. Their results showed that when the scaffolds were sintered at 1300 °C, excellent mechanical properties and in vitro cytocompatibility were obtained. This study demonstrated porous scaffolds with excellent bioactivity, fidelity and accuracy for bone tissue regeneration.103
VPP processes are extensively used in dentistry for the fabrication of orthodontic and prosthetic applications. Normally, when wearing a temporary dental product such as a crown and bridge, saliva is generated by the less tight integration of the dental product and teeth surface. Consequently, bacteria grows in that free space area, causing problems, and eventually the implants need to be removed or replaced, which is costly. Thus, to overcome this problem, antibacterial nanoparticles can be added to the photopolymer resin. Sa et al. studied this issue and prepared a dental composite resin with sustainable antibacterial ability using silver carrying halloysite nanotubes (Ag-HNT). Different mechanical, antibacterial and cytotoxicity tests were performed on the resulting nanocomposites. According to their results, the bending strength increased to 25% by using 3 wt% of nanofiller compared to the control specimens. The continuous antibacterial ability of the cured nanocomposite resins was evidenced by culturing Streptococcus mutans in the leached resin solution. After 48 h in the leaching solution, the nanocomposite resin showed good cytocompatibility.45
Similarly, ZrO2 is often used as dental restorative ceramic material due to its excellent mechanical properties, biocompatibility, corrosion resistance, and wear resistance.
Zhao et al. investigated a zirconia (ZrO2)-based nanocomposite resin for dental implants by DLP 3D printing and studied its fatigue performance simulations. Different parameters were studied to see the effects of heat treatment on the sintering quality of the nanocomposite-based resin. After different testing and microscopy analyses, sintering at 1450 °C for 1.5 h was determined to be the optimum condition. The relative density of the printed nanocomposite was found to be 99.4% and the flexural strength in the horizontal direction was found to be 600 MPa. After the fatigue simulations, it was found that when the pre-angle was smaller, the stress was maximum, and the safety factor was high. The hardness and surface roughness of the nanocomposite-based printed samples were found to meet the requirements of implant abutment.93
Chen et al. prepared a nanocomposite resin for dental restoration by using ZrO2–AlO2 nanofillers in a polymer matrix for SLA 3D printing. A fixed loading of 45 vol% nanofiller was used in this study together with 4 wt% dispersant. When the nanocomposite was sintered at 1600 °C, its relative density was found to be 99%, and Vickers hardness was 16.66 GPa. To study the biological properties and biosafety of the nanocomposite resin, rat bone marrow mesenchymal stem cells (rBMSCs) were seeded on its the surface. After their experiments, it was found that rBMSCs have excellent adhesion and proliferation capability on the surface of the nanocomposite. Based on their excellent mechanical properties and biocompatibility, these nanocomposites have broad applications in dental restorations. In short, the biocompatibility of ZrO2–AlO2 was verified for the first time in SLA-based printed nanocomposites for use in dentistry.100
Due to their biocompatibility and excellent mechanical properties, Wang et al. used different nanoparticles (GO, titania, sepiolite, and silica) with epoxy-based resin to print dental implants. All the printed parts achieved good dimensional accuracy, as shown in Fig. 11. The nanocomposites printed with sepiolite showed high tensile strength and hardness in comparison to the other printed nanocomposites, which facilitated the fabrication of dental model implants.107
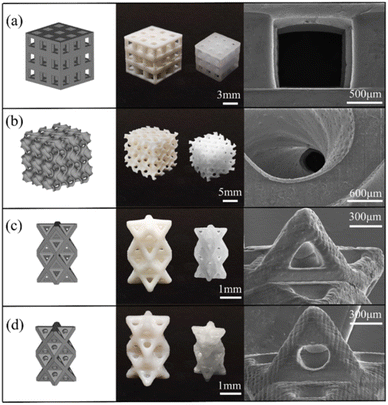 | ||
| Fig. 11 3D models (left column), green bodies, 1300 °C-sintered BCP scaffolds (middle column), and SEM images of various scaffolds (right column): (a) cubic (used for compression test); (b) triply periodic minimal surface (TPMS-G); and (c and d) 3D scaffolds with triangular and circular pores (reproduced with permission from ref. 107. Copyright 2022, Elsevier). | ||
AM gained attention in the delivery of customized drugs when the first 3D-printed pill was officially approved by the US Food and Drug Administration (FDA) in 2015.108 To date, AM has been used in creating different complex structures. Nowadays, this technology enables the production of customized drug products with appropriate release designs and profiles.44 The incorporation of nanomaterials in scaffolds is a feasible route to deliver different drugs to their target.109 Abdelrasoul et al. mixed gold nanoparticles with a biodegradable polymer polypropylene fumarate (PPF) resin and printed them by the MPExSL technique. Subsequently, the scaffolds were implanted in mice. The results from their experiment proved that gold nanoparticles are promising non-toxic nanocarriers, which can transport genes, drugs, and proteins to deliver them to the target sites.109
Owing to the biocompatibility of CNCs, they are widely used in biomedical applications and have the potential for tissue engineering applications.43,110 Palaganas et al. mixed CNCs derived from the abaca plant with a polymer matrix (PEGDA). The results showed the improved thermomechanical and physicochemical properties of the nanocomposite resin, which can affect the toughness of the printed part. These enhanced properties show the potential of the formulations for tissue engineering applications. To be specific for the patient's specified needs, a human ear, as shown in Fig. 12, was printed which shows the capability for reconstructive anotia and microtia surgery.111
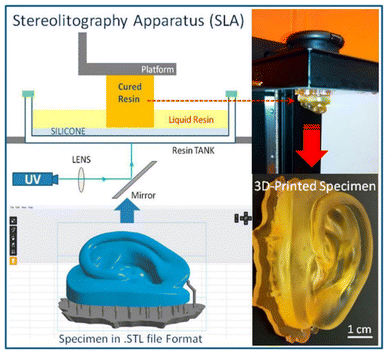 | ||
| Fig. 12 3D printing of human ear construct using PEGDA–CNC hydrogel via SLA, which is potentially suitable for tissue engineering applications (reproduced with permission from ref. 111. Copyright 2017, ACS). | ||
6.2 Mechanical applications
Recently, the significant research on polymer materials in VPP makes them a hot topic. 3D-printed polymer nanocomposites become more brittle with an increase in nanofiller content. The main challenge in this case is to retain the ductility, while increasing the mechanical properties. Mechanical properties are the most widely studied properties in the literature. Regarding mechanical properties, the tensile strength and Young's modulus are more studied. The tensile strength is the maximum stress that a material can withstand just before its failure. In the design of new materials and machine parts, the tensile test plays a significant role. Generally, the ASTM D-638 standard is followed to print tensile test specimens for polymer nanocomposites.112 The Young's modulus or elastic modulus is one of the most important material properties, which helps to determine the material response to any applied stress. The polymer parts produced by VPP-based 3D printing have poor mechanical properties compared to injection molding, etc. In this case, the addition of nanofillers to the photopolymer resin can help improve its mechanical properties. The nanofillers such as graphene oxide, CNC, and CNTs are the most widely studied and their resulting properties in terms of mechanical applications are summarized in Table 3. This section is organized in terms of nanoparticles used such as 0-dimensional, 1-dimensional and 2-dimensional particles.| Polymer matrix/nanofiller | Additives and reinforcement | Highlights | Properties enhanced | Applications | Ref. |
|---|---|---|---|---|---|
| Methacrylate + graphene oxide (GO) | GO conc. (0, 0.05, 0.1, 0.5 wt%) | MakeX printer | Increase in flexural modulus by up to 70% at 0.10 wt% modified GO | Rapid prototyping | 59 |
| Light wavelength 518 nm | |||||
| Exposure time 20 s per layer | |||||
| Layer thickness 60 μm | |||||
| 60 micron layer thickness | |||||
| Methacrylate + graphene oxide (GO) | GO conc. (0, 0.2, 0.6, 1.0 wt%) | Form 2 printer | Maximum tensile strength achieved was 60 MPa (46% improved) | Drone parts | 48 |
| Light wavelength 405 nm | Maximum compressive strength achieved was 76 MPa | Manufacturing, medical equipment | |||
| XY resolution 25 μm | Compressive modulus was 1.4 GPa | ||||
| Power rating 250 mW | Ductility improved by 66% | ||||
| Build volume 14.5 × 14.5 × 17.5 cm | Increase in toughness by 186% | ||||
| Pic 100 resin (EnvisionTEC) + single-layer GO | GO conc. (0.20, 0.5 wt%) | GO X- and Y-dimensions range 300 nm to 10 μm | Tensile strength achieved was 12.99 MPa (45.3% improvement) | Lattice structures | 79 |
| Thickness range 0.9 ± 0.2 nm | Tensile strength achieved was 14.49 MPa (62.2% improvement) by heat treatment post-curing | ||||
| Strain increased by 12.8% | |||||
| Anycubic epoxy resin/TiO2 | TiO2 conc. (0.25, 0.5, 1.0 wt%) | 47, 1.25, and 25 l DPI in x-, y-, and z-axes | Maximum tensile strength achieved was 31 MPa | Optical devices | 113 |
| Layer thickness 25–100 μm | Maximum elasticity modulus achieved was 694 MPa (20% higher than the pure polymer) | ||||
| Maximum impact resistance achieved was 12.78 kJ m−2 | |||||
| Acrylate-based “high temperature V2” resin + MWCNTs, GNP, carbon black (CB) | MWCNTs, GNP, CB con. (0.1 wt%) | Light wavelength 395 nm | Relative permittivity increased by 18% for GNP | Piezo-electronics | 120 |
| Layer thickness 60 μm | Relative permittivity decreased by 12% for CB | ||||
| Only MWCNTs increased the dielectric properties | |||||
| Tween 20 photopolymer-resin/GNP | GNP con. (0, 1, 2 wt%) | Light wavelength 405 nm | Maximum tensile strength achieved was 35.7 MPa | Solar cells, LEDs, optical devices | 123 |
| Layer thickness 6–8 μm | |||||
| Printer dimensions 1 inch × 14 inch × 22.5 inch | |||||
| Flexible polyurethane + polyaniline (PANI) and a graphene sheet (GS) | PANI conc. (1–6 wt%) | IM-96, Carima Printer | Maximum tensile strength achieved was 44.5 MPa (PANI) | Conducting polymers (CPs) with conjugated structures | 49 |
| GS conc. (0.33–2 wt%) | Maximum tensile strength achieved was 69.3 MPa (GS) | ||||
| Sheet resistance improved to 1.19 × 10⁶ ohm sq−1 | |||||
| Spot-HT ABS- photopolymer + CNT | CNTs conc. (0.25 wt%) | Light wavelength 405 nm | Maximum tensile strength achieved was 48 MPa (improved by 70%) post-curing | Functional materials | 119 |
| Cure depth dimension 1 mm × 1 mm | Maximum elongation achieved was 20% (improved by 46%) | ||||
| Layer thickness 6–8 μm | Maximum modulus achieved 885 MPa (post-curing) | ||||
| Formlabs grey resin + GO | GO conc. (0.01–0.1 wt%) | Form 2 printer | Maximum tensile strength achieved was 88 MPa (post-curing) | Aerospace, automotive and sports equipment | 47 |
| Layer thickness 15–25 μm | Maximum modulus achieved was 2180 MPa 48.3% (post-curing) | ||||
| Light wavelength 405 nm | Tensile strength was reduced by 17% (solvent addition) | ||||
| Young's modulus decreased by 72.4% (solvent addition) | |||||
| Polyurethane + lignin/GNP | Polyurethane acrylate 45–47 wt% | Wanhao 3D printer | Maximum tensile strength achieved was 27.35 MPa (increase in strength by up to 27%) | High strength applications | 124 |
| Morpholine 34–36 wt% | Light wavelength 405 nm | Maximum Young's modulus achieved was 12.68 MPa | |||
| Tripropylene glycol diacrylate 15–17 wt% | Maximum hardness achieved was 92 MPa (increase in hardness by up to 238%) | ||||
| GNP conc. (0.2, 0.4, 0.6, 0.8, 1.0, 3.0 wt%) | |||||
| PIC 100 from Envision TEC + GO | GO conc. (1, 2, 3 wt%) | Light intensity 3900 μW cm2 | Maximum sheet resistance achieved was 40 × 103 Ω per square | Electronics | 125 |
| Layer thickness 30 μm | Electrical conductivity and mechanical strength were enhanced two-fold with pyrolysis | ||||
| Curing time 7, 11, 18 s | |||||
| Polylactic acid polyurethane oligomer (PLA–PUA) + GO | Triethylene glycol dimethacrylate (TEGDMA) 39% | Photon, Anycubic printer | Maximum flexural modulus achieved 3.06 GPa (increase in modulus by up to 14%) | Tissue engineering, personalized medical devices | 81 |
| (Irgacure 819) TPO 3% | Light wavelength 405 nm | Maximum flexural strength achieved was 93 MPa (increase in toughness by up to 28%) | |||
| XY resolution 47 μm | |||||
| GO conc. (0, 0.5 wt%) | Z axis resolution 1.25 μm | ||||
| Build volume 115 × 65 × 155 mm3 | |||||
| Printing speed 0.020 m h−1 | |||||
| Formlabs flexible acrylate resin + GO | GO conc. (0, 0.1, 0.2, 0.3 wt%) | Layer thickness 15–25 μm | Maximum Young's modulus achieved was 6.18 MPa | 78 | |
| Light wavelength 405 nm | No significant increase in mechanical or thermal properties due to non-uniform dispersion of GO | ||||
| Polylactic acid polyurethane PLA–PUA resin + GO | GO conc. (0.5 wt%) | Photon, Anycubic printer | Maximum tensile strength achieved was 68 MPa (increase in strength by up to 62%) | Porous scaffolds, tissue engineering | 39 |
| (Irgacure 819) TPO 1 wt% | Light wavelength 405 nm XY resolution 47 μm | Maximum flexural strength achieved was 115 MPa | |||
| Triethylene glycol dimethacrylate (TEGDMA, 37 wt%) | Z axis resolution 1.25 μm | Maximum flexural modulus achieved was 5.8 GPa | |||
| UV light intensity 20 W | |||||
| Printing speed 0.020 m h−1 | |||||
| Formlabs grey acrylic resin + GO | GO conc. (0.1, 0.5, 1 wt%) | Form 1+ Formlabs printer | Tensile strength was 23 MPa (50 °C post-curing) | Rapid prototyping | 126 |
| Light wavelength 405 nm | Tensile strength was 50 MPa (100 °C post-curing). Increase in strength by up to 673.6% (for 1 wt% GO) | ||||
| Laser power 120 mW | |||||
| Layer thickness 50 μm | |||||
| Formlabs clear acrylic resin + GNP | GNP conc. (0, 0.5, 1, 2, 2.5, 3, 5 wt%) | Form 1+ Formlabs printer | Before thermal post-curing | ESD prevention, semiconductors | 127 |
| Light wavelength 405 nm | Tensile strength was 48.8 MPa | ||||
| Laser power 120 mW | Young's modulus was 1.28 GPa | ||||
| Spot size 140 μm | Elongation at break was 35% | ||||
| After thermal post-curing | |||||
| Tensile strength was 54.8 MPa | |||||
| Young's modulus was 1.8 GPa | |||||
| Elongation at break was 7% | |||||
| Electrical conductivity was 10−6 S cm−1 | |||||
| Sheet resistance was 107 ohm sq−1 | |||||
| Formlabs standard clear resin + Cu | Cu conc. (0.5, 1, 2 wt%) | Form 2 Formlabs printer | Maximum tensile strength was 77.2 MPa (increased by 33.7% at 1 wt%) | High-end medical applications | 117 |
| Urethane dimethacrylate 55–75% | Light wavelength 405 nm | Maximum Young's modulus was 36.4 MPa (increased 19.4% at 0.5 wt%) | |||
| Methacrylate monomers 15–25% | Laser power 120 mW | Maximum flexural strength was 109.2 MPa (increased by 33.4% at 1 wt%) | |||
| Irgacure 819 (TPO) 0.9% | Spot size 150 μm | Maximum flexural modulus was 1.9 GPa (increased by 20.3% at 1.0 wt%) | |||
| Maximum tensile toughness was 12.4 MJ m−3 (increased by 68.5% at 1 wt%) | |||||
| Maximum flexural toughness was 3.2 MJ m−3 (increased by 34.2% at 1 wt%) | |||||
| Maximum impact toughness was 11.2 kJ m−2 (increased by 30.3% at 1 wt%) | |||||
| Formlabs methacrylate resin + lignin-coated cellulose nanocrystals (L-CNC) | L-CNCs conc. (0, 0.1, 0.5, 1 wt%) | Form 1+ Formlabs printer | Before thermal post-curing | Electronic components, packages and tissue engineering | 82 |
| Light wavelength 405 nm | Tensile strength was 36 MPa | ||||
| Laser power 120 mW | Young's modulus was 0.67 GPa | ||||
| Spot size 140 μm | Elongation at break was 11% | ||||
| After thermal post-curing | |||||
| Tensile strength was 37 MPa (slightly increased) | |||||
| Young's modulus was 0.67 GPa (almost the same) | |||||
| Elongation at break was 11% | |||||
| Tetra function polyester acrylate (TPA) + carbon black (CB) | CB conc. (0.5, 1, 1.5, 2 wt%) | Ultrahigh voltage mercury lamp 200 W | Increase in hardness by up to 76% | Visible-light RP machine | 118 |
| 1,6-Hexanediol di-acrylate (HDDA) 50% | 2000ANSI lumen | Increase in tensile strength by up to 81% | |||
| TEGO Dispers 680 UV (dispersant) 1.5% | Z-axis resolution 0.02 mm | Increase in decomposition temperature by up to 80% | |||
| IRGACURE 784 (PI) | |||||
| Epoxy resin + cellulose nanocrystals (CNCs) | CNCs conc. (0.5, 2, 5, 10, 15 wt%) | 15 wt% CNC modulus increased by 100%, glass transition temperature (Tg) increased from 66.5 °C to 75.5 °C and tensile strength increased from 40 MPa to 60 MPa | Reinforcing fillers in structural materials and coatings | 128 | |
| Acrylate + hydroxyapatite (HA) | 1,6-Hexanediol diacrylate (HDDA) | Light wavelength 405 nm | The highest compressive strength achieved was 22.5 MPa | Bone engineering | 94 |
| Diphenyl (2,4,6-trimethylbenzoyl)phosphine oxide (TPO) | Layer thickness 30 μm | The highest compressive modulus achieved was 400 MPa | |||
| Energy dose 10 mJ cm−2 | Porosity level was up to 70% | ||||
| Exposure time 1.5 s | |||||
| Formlabs clear acrylate resin + graphene oxide (GO) | GO conc. (0.1–2.5 wt%) | Form 1+ Formlabs printer | Before thermal post-curing | Biosensing, tissue engineering | 122 |
| Light wavelength 405 nm | Tensile strength was 34 MPa | ||||
| Laser power 120 mW | Young's modulus was 1.5 GPa | ||||
| Spot size 140 μm | Elongation at break was 7% | ||||
| Layer height 100–200 μm | After thermal post-curing | ||||
| Tensile strength was 75 MPa (increased up to 100%) | |||||
| Young's modulus was 2.7 GPa (increased up to 90%) | |||||
| Elongation at break was 22% | |||||
| Methacrylate resin + cellulose nanocrystals (CNCs) | CNCs conc. (0.5, 1, 5, 10 wt%) | 3D systems VIPER printer | Maximum tensile strength achieved was 82 MPa (2.0 wt%) | Rapid prototyping | 121 |
| Light wavelength 355 nm | Maximum young modulus achieved was 4.1 GPa (5 wt%) | ||||
| Laser power 100 mW | Maximum elongation at break was 3.7% (0.5 wt%) with an increase in modulus by up to 57% | ||||
| Maximum flexural modulus achieved was 3.3 GPa | |||||
| Poly(ethylene glycol)diacrylate, PEGDA + graphene oxide (GO) | GO conc. (0, 0.3, 0.5 wt%) | HD 2.0 (Robot Factory) printer | Maximum tensile strength achieved was 10.4 MPa (post-cured) | Electronics | 129 |
| Irgacure 819 (PI) 2 wt% | XY resolution 50 μm | Maximum compression strength achieved was 11.1 MPa (post-cured) | |||
| Layer thickness 30 μm | Maximum conductivity achieved was 109.5 × 10⁻⁹ S cm−1 | ||||
| Printing time 1.5–2 s per layer | |||||
| Light intensity 10 mW cm−2 | |||||
| Methacrylic (MA) resin (FLGPCL04) + cellulose nanocrystals (CNCs) | CNCs conc. (0.1, 0.5, 1 wt%) | AUTOCERA printer | Maximum tensile strength achieved was 18.8 MPa (increase in strength by up to 43.5%) | Dental model, tissue engineering | 130 |
| Light wavelength 405 nm | Maximum Young's modulus achieved was 240 MPa | ||||
| Laser intensity 7500 μW cm−2 | Maximum elongation at break was 34% | ||||
| Exposure time 10–30 s | |||||
| Laser power 100 mW | |||||
| Bisphenol-A epoxy diacrylate (E-44) + graphene oxide (GO) | GO conc. (0.01–0.12 wt%) | Hygieo WIZART printer | Maximum tensile strength achieved was 78.3 MPa | Prototypes etc. | 131 |
| Irgacure 250 1.5 wt% | Maximum Young's modulus achieved was 2.64 GPa | ||||
| PAS 33 (sensitizer) 0.75 wt% | Maximum elongation at break was 7.6% | ||||
| Maximum bending strength achieved was 87.3 MPa | |||||
| Maximum flexural modulus achieved was 2.02 GPa | |||||
| Maximum impact strength achieved was 77.4 J cm−1 | |||||
| Minimum volume shrinkage was 0.12% |
Guo et al. produced fine lattice structures using TiO2 nanoparticles in a homemade DLP 3D printer. By optimizing the sintering and debinding, different structures of porosity of up to 80% were obtained. The compressive strength of the structures was affected with a decrease in their porosity. Alternatively, the compressive strength increased from 1.13 MPa to 1.50 MPa with an increase in porosity. By comparing the as-sintered and before-sintered samples, it was found that the X–Y–Z axis shrinkage direction of as sintered structures was anisotropic. These printed nanocomposites showed potential applications in bone tissue engineering, filters, and radiators.114
In another study, Mubarak et al. proposed a novel approach to improve the mechanical and thermal properties of TiO2 nanocomposites by SLA 3D printing. Different crystalline phases of TiO2 (anatase and rutile) were used in this study. The annealed anatase printed nanocomposites had a low energy bandgap, high strength of 47 MPa, and modulus of 2.2 GPa. The strength and modulus of the printed nanocomposites improved by 103% and 32% compared to the control specimens, respectively. Due to the low energy bandgap, a good dispersion of nanofiller in the photopolymer matrix was obtained.115
Billings et al. investigated TiO2-based nanocomposites for public health applications. A fixed content of 1 wt% of nanofiller was used throughout to avoid an increase in viscosity. A tensile strength of 29 MPa was obtained in this study. The resulting nanocomposite was clear and transparent and the dispersion of the nanofiller was partially evidenced.116
In another study, Vidakis et al. investigated the biocidal performance of copper-enhanced polymer nanocomposites with excellent mechanical properties. The agar-well diffusion technique was used to assess the antibacterial activity of the nanocomposites. Compared to the control specimens, the results of the tensile tests for the nanocomposites filled with 1.0 wt% ratios showed an improved mechanical performance of about 33.7%, as shown in Fig. 13. This concentration also demonstrated a sufficient antibacterial performance compared to lower filler loadings, making it an efficient nanocomposite for use in medical applications using the SLA process.117
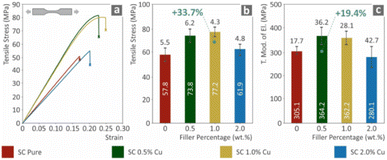 | ||
| Fig. 13 Typical mechanical properties of the control, 0.5, 1, and 2 wt% specimens. (a) Tensile stress. (b) Tensile stress at break. (c) Tensile elastic modulus (reproduced with permission from ref. 117. Copyright 2022, MDPI). | ||
Chiu et al. investigated the mechanical and thermal properties of a carbon black (CB)-incorporated photopolymer nanocomposite. Their findings demonstrated that the prototype made from pure photopolymer tended to have poor mechanical and thermal stability. However, with the addition of different concentrations of CB and dispersant in a suitable composition, the resulting nanocomposite exhibited a reduced curing time, enhanced mechanical properties, and thermal and dimensional stability. The resulting nanocomposite showed excellent thermal stability with an increase in its decomposition temperature by up to 80%, enhanced hardness of up to 76.6% and tensile strength of up to 81%.118
The mechanical and biological properties of scaffolds are significantly influenced by their morphologies and structures. Liang et al. printed nano-hydroxyapatite (HA) bone scaffolds with multiple porous structures by DLP 3D printing. Different properties such as rheological, curing abilities, debinding, and sintering strategy were systematically investigated. The compressive qualities and in vitro cell assessments of the scaffolds, including cell growth and attachment morphology, were comprehensively evaluated. According to their findings, the scaffolds had a high modulus (400 MPa) and compressive strength (22.5 MPa). Additionally, the CPS scaffolds had the most active cell metabolisms compared to the other two structures, which may explain the smaller curvature and bigger pore size of the substrate.94
CNTs are desirable nanofillers because of their high strength and Young's modulus. Polymer parts produced by VPP methods have poor mechanical properties compared to injection molding, etc. In this case, the addition of nanofillers to the photopolymer resin for SLA can help improve their mechanical properties. Eng et al. developed a CNT-based photopolymer resin for SLA 3D printing. Nanofillers agglomerate easily in the polymer resin; however, if the nanofiller is well dispersed, it will not agglomerate. Here, examining appropriate dispersion mechanisms and processes is necessary to achieve a good dispersion, which is essential for enhancing the mechanical properties. A fixed concentration of CNTs (0.25 wt%) was used throughout the study. Similarly, thermal post-curing significantly improved the mechanical properties of the printed parts and a maximum tensile strength and modulus of 46 MPa and 885 MPa were achieved, respectively. Overall, the tensile stress and elongation of the 3D-printed components were enhanced by 70% and 46%, respectively, compared to the control specimens. The acquired tensile strength was somehow equivalent to the components made using traditional techniques because of the substantial improvement. The addition of CNTs to photopolymers can result in additional desirable qualities other than mechanical properties, such as better thermal and electrical conductivity and a slower rate of deterioration due to the UV-absorbent nature of CNTs.119
Mitkus et al. investigated the post-curing, microstructure, viscosity, cure depth, and dielectric properties of different nanofiller-based composites such as MWCNT, GNP and carbon black (CB). This study revealed how nanoparticle dispersions affect the different properties of printed nanocomposites. Different suspensions of nanofillers were created and a reduction in velocity was observed. Similarly, the addition of 0.1 wt% nanofillers resulted in a poor dispersion, leading to a cure depth of 90% compared to the control specimens. The graphene nanoplatelets (GNP) composite had the biggest increase in relative permittivity by up to 18% (at 1 kHz). However, carbon black (CB) resulted in a 12% reduction in relative permittivity (at 1 kHz). Besides MWCNT composites, where the dissipation factor decreases with frequency, no variations in the dissipation factor were observed. For further research in this area, it was suggested that MWCNTs and GNPs be used in combination with ethanol as a dispersant to improve their dispersion. Similarly, post-curing of the resulting nanocomposites affects some of their properties. Subsequent post-curing showed a slight decrease in relative permittivity and a dramatic decrease in dissipation factor with an increase in post-curing time.120
Cellulose nanocrystals (CNCs) were used in a photopolymer matrix for the first time by Kumar et al., using SLA 3D printing. In their study, different concentrations (0, 0.5, 2, and 5 wt%) were used in the polymer matrix. Increasing the nanofiller concentration up to 5 wt% resulted in an increase in mechanical properties, which subsequently decreased. These excellent mechanical properties were due to the high level of dispersion and the intimate contact of the nanofiller with the polymer matrix.121
In another study, Feng et al. reported the post-curing of lignin-coated cellulose nanocrystal (L-CNC) filled methacrylate-based nanocomposites and investigated their mechanical properties and thermal stabilization. Some small gaps or voids were found between the nanofiller and polymer matrix; however, these gaps decreased after the thermal post-curing at 120 °C for 40 min, where 0, 0.1, 0.5, and 1 wt% concentration of nanofiller was used in this study. In terms of mechanical properties, both the tensile strength and Young's modulus increased with the addition of 0.1 wt% L-CNCs. However, beyond 0.1 wt%, the mechanical properties were reduced by 5–8%. This was due to the insufficient interfacial dispersion caused by the agglomeration of L-CNCs in the methacrylate matrix, which was in accordance with many studies, where increasing the nanofiller concentration beyond its percolation threshold results in a decrease in mechanical properties.122 After post-curing, the addition of 0.1 and 0.5 wt% L-CNCs enhanced the mechanical properties and also improved the thermal stability, as shown in Fig. 14.82
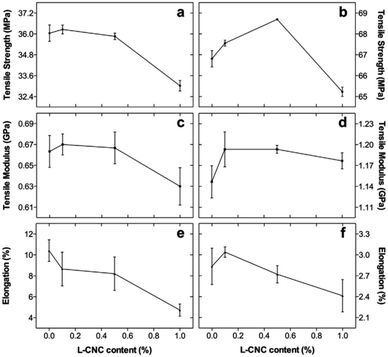 | ||
| Fig. 14 Mechanical properties (a and b) tensile strength, (c and d) tensile modulus, and (e and f) elongation of non-post-cured (a, c, and e) and post-cured (b, d, and f) 3D-ST printed L-CNC/MA nanocomposites (reproduced with permission from ref. 82. Copyright 2017, Elsevier). | ||
In the preparation of polymer nanocomposites, mostly a solvent is used for the dispersion of the nanofiller and polymer matrix. However, removal of the solvent from the resulting composite is necessary, where even small traces of solvent can significantly affect its properties. Therefore, to overcome this issue, Feng et al. proposed an effective solvent-free technique for the fabrication of graphene-reinforced nanocomposites using DLP. The quick curing capability of this method allowed for a very homogenous nanofiller dispersion without the evident agglomerates that may result from the previously reported drawn-out curing of resins. Consequently, ‘the mechanical properties of the graphene-reinforced nanocomposites were significantly enhanced with just 0.5 wt% graphene, resulting in a 14% increase in flexural modulus and 28% increase in fracture toughness. A jawbone with a square architecture and a gyroid scaffold for bone tissue engineering applications were successfully constructed. Using the developed graphene-reinforced resins and DLP, they demonstrated the enormous potential of the current UV-curable nanocomposite resin systems for various applications in fields such as bioengineering.81
León et al. also studied the post-processing of 3D-printed polymer nanocomposites and performed a comparative study with samples having no post-processing involved. Different amounts of graphene (GNP) were mixed in acrylic-based photo polymer resin ranging from 0.5–5 wt%. Their study revealed that even though the nanofiller was well dispersed in the polymer matrix, the degree of cure and mechanical properties were worse compared to the control specimens. The tensile strength and Young's modulus decreased proportionally when the GNP content increased and the elongation at break decreased from 35% to 7–9% strain. However, when thermal post-processing was done on the samples at 60 °C with UV light for 1 h, a significant enhancement by about 90% was achieved in all properties. The mechanical properties were enhanced with up to 1.0 wt% GNP content, and then decreased due to the agglomeration of GNP in the resin. After thermal post-curing, the Young's modulus and tensile strength significantly increased from 1280 MPa and 48.8 MPa to 1880 MPa and 54.8 MPa, respectively, for the 0.5 wt% GNP nanocomposite, as shown in Fig. 15. The Young's modulus also increased to 1600 MPa for the 1.0 wt% GNP nanocomposite. Also, it was noted that post-curing beyond one hour had no effect on the mechanical properties of the nanocomposites. Similarly, electrical properties were also affected by post-curing. Interestingly, a huge increase of nine orders of magnitude was observed when the nanofiller content was increased up to 2.5 wt%, which was in the acceptable conductivity range of 10−6 S cm−1. The sheet resistance value was 107 ohm sq−1, which was in the range of semiconductor dissipative materials (107–109 ohm sq−1). This value makes the nanocomposite a good material for preventing electrostatic discharge (ESD) problems.127
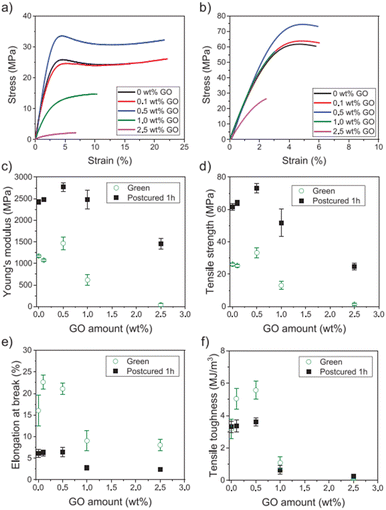 | ||
| Fig. 15 Representative tensile testing curves of nanocomposites containing 0–2.5 wt% GO: (a) after printing (green samples) and (b) after post-curing with UV for 60 min (post-cured samples). Average (c) Young's modulus, (d) tensile strength, (e) elongation at break, and (f) tensile toughness of the nanocomposites (reproduced from ref. 127. Copyright 2020, MDPI). | ||
When dealing with printed polymer nanocomposites, there are a few issues. For instance, their mechanical properties increase when the amount of nanofillers in the polymer matrix increases up to a certain point, but they gradually decrease as the amount of nanofillers is increased further.
Markandan et al. investigated the post-treatment issues and studied the mechanical properties of graphene-based nanocomposite lattice structures at very low graphene concentrations. Different parameters that affect mechanical properties were studied in detail such as nanofiller concentration, solvent addition and post-fabrication baking temperature. Different graphene concentrations (0.01–0.1 wt%) were used in this study. It was found that increasing the graphene concentration beyond 0.05 wt% resulted in significant agglomeration, which had a direct effect on the mechanical properties. Anisotropic behavior was observed across all the graphene–polymer composites. The Young's modulus and yield stress of the composite reinforced with 0.1 wt% graphene decreased by 72.4% and 17%, respectively, when the filler was dispersed in acetone, as shown in Fig. 16. Similarly, the mechanical properties increased with thermal post-curing, as evidenced by ref. 47, 72, 82, 122, 127, 129 and 132 It was observed that the Young's modulus and yield strength in the linear regime were more rapid in graphene nanocomposites compared to the control specimens. The Young's modulus and yield strength increased from 1601 MPa and 77 MPa to 2180 MPa and 88 MPa, respectively, compared to the control specimens. These exceptional mechanical properties of the SLA-based nanocomposites with very low graphene concentrations indicate their potential use in various applications such as aerospace, automotive and sports equipment.47
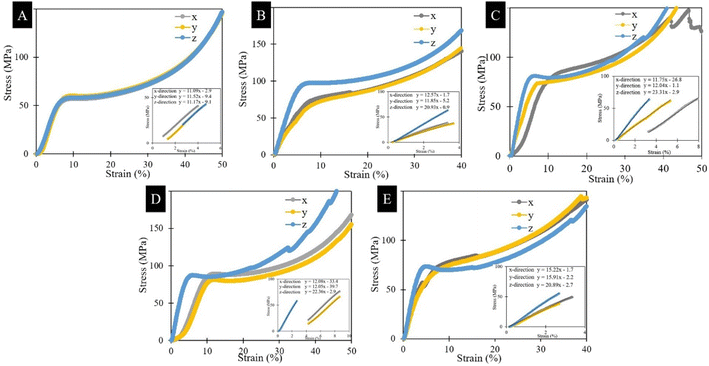 | ||
| Fig. 16 (A–C) Stress–strain curves of graphene polymer composites in different directions with increasing graphene concentration of (A) 0 wt%, (B) 0.01 wt%, (C) 0.02 wt%. (D) 0.05 wt%, and (E) 0.1 wt% (reproduced and adapted with permission from ref. 47. Copyright 2020, Elsevier) (for the interpretation of the references to colour in this figure legend, the reader is referred to the web version of this article). | ||
Korhonen et al. investigated graphene-based 3D structures by SLA 3D printing. Initially, they used a GO nanofiller to print the nanocomposite resin but later the printed sample was pyrolyzed to reduce graphene oxide (rGO) to entirely graphene to make it electrically conductive. This resulted in high shrinkage and brittleness in the 3D-printed parts. Electrical conductivities in the range of semiconductors were attained by partially pyrolyzing the polymer components, and the samples displayed superior dimensional stability and greater mechanical strength than the structures made entirely of graphene.125
The weak thermo-mechanical properties of 3D-printed polymers limit their applications in VPP-based processes. Thermal post-treatment can efficiently enhance the mechanical properties of the resulting polymer nanocomposites, as shown in many studies.47,72,82,122,127,129 It has been proven experimentally by many researchers that post-curing in the form of thermal or UV light enhances the mechanical properties of 3D-printed nanocomposites.
Lin et al. investigated the effect of post-curing and treatment on graphene-based nanocomposites for the first time using SLA 3D printing. They added 0.2 and 0.5 wt% GO to a commercially available resin and studied the effects of heat treatment post-curing. The tensile strength showed an enhancement of 24.9% and 45.3% for 0.2 wt% and 0.5 wt% of GO, respectively, compared to the control specimens. However, when the specimens were thermally treated in a furnace, their mechanical properties improved drastically with a tensile strength enhancement of 62.2%. Their results revealed that the increase in strength and ductility was related to the increase in the crystallinity of the nanofiller-reinforced composite.79
It is evidenced from many studies that post-curing promotes the cross-linking of the free monomers in the polymer matrix, which creates new covalent bonds that increase the strength and stiffness.47,72,82,122,127,129,132 Chiappone et al. showed that the thermal and UV post-curing of graphene oxide-based 3D printed nanocomposites can effectively enhance the thermal, electrical and mechanical properties of the resulting nanocomposites, as shown in Fig. 17 and 18, respectively.129
 | ||
| Fig. 17 Stress–strain curves obtained for the PEGDA MR, PEGDA 0.3 and PEGDA 0.5 samples after different treatments (reproduced with permission from ref. 129. Copyright 2017, Elsevier). | ||
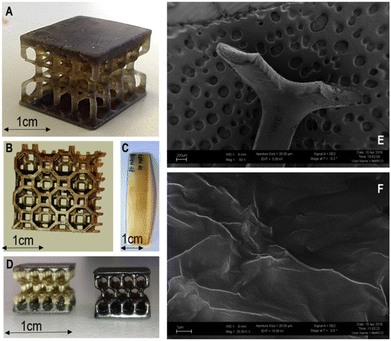 | ||
| Fig. 18 (A) Honeycomb structure used for compression tests produced with formulation PEGDA 0.5. (B) Complex geometry produced with the formulation PEGDA 0.3. (C) Specimen for tensile tests produced with the formulation PEGDA MR. (D) Color change of small honeycomb structures in PEGDA 0.5 before (left) and after (right) UV post-treatment. (E and F) SEM images of a section of a honeycomb structure in PEGDA 0.5 at different magnifications (reproduced with permission from ref. 129. Copyright 2017, Elsevier). | ||
León et al. investigated the thermal post-curing of graphene oxide (GO)-based nanocomposites by SLA 3D printing and investigated their effect on mechanical properties. Increasing the nanofiller concentration up to 1 wt% resulted in an increase in mechanical properties; however, beyond 1 wt%, these properties decreased rapidly. After thermal post-curing, the tensile strength and modulus increased by almost 100% for 0.5 wt% GO compared to the control specimens.122
Manapat et al. also addressed this issue and post-cured the nanocomposites, which resulted in an enhancement in mechanical and thermal properties. A small amount of GO nanofillers was added to a commercially available SLA resin for reinforcement, and it was thermally annealed for 12 hours at 50 °C and 100 °C. At an annealing temperature of 100 °C, tensile testing showed an increase in the strength and modulus, with the maximum tensile strength increase recorded at 673.6% (for 1 wt% GO), as shown in Fig. 19. This enhancement was due to the enhanced cross-linking and decrease in the pore size of the resin with an increase in the annealing temperature. Both differential scanning calorimetry (DSC) and thermogravimetric analysis (TGA) demonstrated the increased thermal stability with an increase in the annealing temperature. The metastable structure of GO, polymer–nanofiller cross-linking through acid-catalyzed esterification, and elimination of intercalated water were all credited for the tremendous improvement in mechanical properties.126
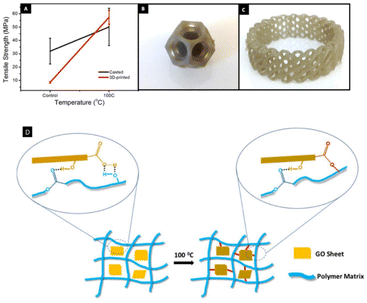 | ||
| Fig. 19 (A) Comparison of the tensile strength of the casted and 3D printed parts. SLA-printed complex structures of (B) nested dodecahedron and (C) diagrid ring. (D) Covalent and non-covalent interaction of 3D-printed GO nanocomposites (reproduced and adapted with permission from ref. 126. Copyright 2017, the American Chemical Society). | ||
The dispersion of nanofillers in the polymer matrix plays an important role in the mechanical and thermal properties of 3D printed nanocomposites. Thus, Tsang et al. studied this behavior in GO-modified flexible polymer nanocomposites and noted that an increase in nanofiller concentration affects the mechanical and thermal properties. The mechanical strength, stiffness, elongation and thermal properties of the resulting nanocomposites decreased with the addition of GO. This phenomenon is in accordance with other studies that GO agglomerates inside the resin affects its properties.47,48 Future development of 3D-printed nanocomposite elastomers was suggested after more thorough research on efficient methods to create homogeneous GO dispersions in SLA resins and the heat treatment of the nanofiller/elastomer nanocomposites for mechanical and thermal applications.78
Agglomeration is a serious problem in dealing with nanocomposites. It is more evident that if the filler concentration increases, it will not properly be dispersed inside the matrix, which results in a decrease in Young's modulus. This is due to the weak interface between the filler and matrix. To help reduce the agglomeration of nanoparticles, their functionalization and proper optimization of their preparation routes can alleviate this problem.48,59
Functionalized graphene oxide (fGO) nanocomposites are suitable materials for numerous applications, including the production of drone parts, due to their exceptional tensile properties. Palaganas et al. printed an fGO nanocomposite by SLA to enhance its mechanical and thermal properties with high quality, printing repeatability, and mechanical integrity. Different concentrations of functionalized nanofiller (0–1.0 wt%) was mixed with commercially available methacrylate polymer resin. The addition of fGO up to 0.2 wt% enhanced the tensile strength and ductility by 46% and 66%, respectively. However, increasing the nanofiller concentration beyond 0.2 wt% degraded the mechanical properties. This phenomenon is in accordance with the principle of the percolation threshold. The production of homogenously distributed fGO in various polymer matrices, which produces high interfacial adhesion due to the efficient transmission of a load from the matrix to the filler, is another significant advancement in the study. The ability of GO to form covalent bonds with different polymer matrices through functionalization to maximize its mechanical properties, together with its well-known good antimicrobial properties, make it a potential material for medical applications such as its use in external and internal medical devices and drone parts manufacturing, as shown in Fig. 20.48
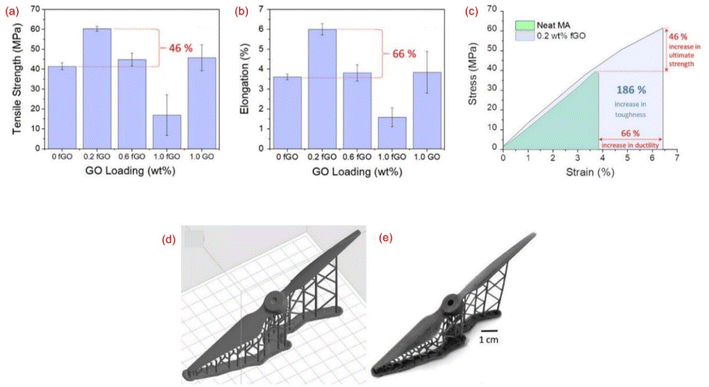 | ||
| Fig. 20 (a) Tensile strength. (b) Elongation of 3D-printed specimens as a function of filler concentration. (c) Stress–strain curves of neat polymer and 0.2 wt% fGO. (d) .stl format of the part to be printed and (e) real 3D-printed part suitable for drone parts manufacturing. In comparison to neat polymer, 0.2 wt% fGO resulted in 66% increase in ductility and 46% increase in tensile strength with the overall toughness increase by 186% (reproduced and adapted with permission from ref. 48. Copyright 2019, ACS). | ||
| Layer thickness ∝ tensile strength/impact and flexural strength |
The intensity of the light source also affects the mechanical properties of a printed part. A light source with a wavelength of 405 nm produces parts with excellent mechanical properties in comparison to a light source with a low wavelength.133 If there are no equipment and material constraints, then a 405 nm light source is best to achieve the maximum properties. Given that there are lots of variations in mechanical properties by different AM methods, it is not possible to make a single standard for mechanical tests that is followed by all methods but there is still a need for a set of rules to standardize the mechanical testing or characterizations of 3D-printed polymer parts made by VPP.1,32
6.3 Thermal, magnetic and electrical applications
The VPP process has great potential in printing magnetic nanocomposites compared to FDM.134 Their applications include sensors, micro-actuators, and other health-related applications.135–137 Different magnetic nanofillers are used in photopolymer resins to increase their mechanical and magnetic properties, etc.138 Iron oxide is the most widely used nanofiller in the literature.50,52 Some of the magnetic fillers studied and their resulting applications in the past three years are summarized in Table 4.| Base material + nanofiller | Additives and reinforcements | Highlights | Properties enhanced | Applications | Ref. |
|---|---|---|---|---|---|
| UV curable resin + MWCNTs | MWCNT conc. (up to 0.6 wt%) urethane acrylate 57.7%, acrylate monomer 38%, photoinitiator 4% | Layer thickness at z-axis (25–100 μm) | Electrical conductivity achieved 0.071 S m−1 | Capacitive sensors, mechanical interfaces | 139 |
| Light wavelength 405 nm | High dimensional accuracy at 0.6 wt% | ||||
| Resolution in XY plane 47 μm | |||||
| Self-prepared resin + graphene + Fe3O4 | G conc. (0.30 g) | Light intensity: 13 mW cm−2 light source (385 nm) | Maximum achieved Young's modulus at 0.8 wt% was 3.1 GPa at 0° angle | Electrical components | 140 |
| Fe3O4 (0.10 g) | UV curing 4 s | Maximum achieved Young's modulus at 1.6 wt% was 2.6 GPa | |||
| Tricyclodecane dimethanol diacrylate (DCPDA) (monomer) | Glass slide spacer thickness 100 μm | Percentage change in modulus was 4% | |||
| Phenyl bis(2,4,6-trimethylbenzoyl) phosphine oxide (TPO) (photoinitiator) sodium dodecylbenzene sulfonate (SDBS) | |||||
| Esun bio-based polyurethane resin + G | G conc. (0.5, 1, 2 wt%) | Resin density 1.07–1.13 g cm−3 | 0.5 wt% G reduced the friction co-efficient by 50% | Friction and wear | 141 |
| Acrylate 30% min | Viscosity of 200–300 mPa s | Vertical and 45° angle orientations resulted in more than 56.5% growth in average surface roughness of 100 μm | |||
| Monomer 30% min | Light wavelength 405 nm | Surface roughness increased by 74.4% | |||
| Photo initiators 5% max | Shore hardness increased as G conc. increased | ||||
| Color pigment 5% max | |||||
| Methacrylate malate photocurable resin + CNCs | CNCs conc. (0.25, 0.5, 0.75, 1 wt%) | Exposure time 25 s | Maximum achieved capacitance improved by 132% with 1 wt% CNCs | Energy storage materials | 142 |
| (Trimethylbenzoyl)phosphine oxide (TPO) 0.5 wt% | Layer thickness 0.05 mm | Maximum achieved dielectric constant was 10.9 at 1 MHz | |||
| Acrylic resin + BaTiO3 | BaTiO3 conc. (10, 20, 30, …, 90 wt%) | Exposure time 2.8 s | Maximum achieved bending strength was 57.9 MPa | Orthopaedics, bone implant materials | 143 |
| Triethanolamine | Layer thickness 35 μm | Maximum compressive strength achieved was 70 MPa | |||
| Tetraethyl orthosilicate | Power density 90 mW cm−2 | Maximum relative density was 94.2% | |||
| Camphor quinone | Optimal sintering temperature 1425 °C for 2 h | Highest piezoelectric coefficient achieved was 241 pC N−1 | |||
| Benzoate | |||||
| HDDA-based commercial UV-curable resin (named JA-01) + GNP | GNP conc. (1, 2, 3, 4 wt%) | Light intensity of 37.49 mW cm−2 | Increase in thermal conductivity by up to 14.6% | Heat sinks | 144 |
| Phenylbis(2,4,6-trimethylbenzoyl) phosphineoxide (BAPO) | Exposure time 5 s | Maximum tensile strength achieved was 14.9 MPa | |||
| 4,4′-Diaminodiphenylmethane (DDM) | Elongation at break was 8% | ||||
| Acrylic photopolymer resin + BaTiO3 | BaTiO3 conc. (70, 75, 80, 82, 84, 86 wt%) | Sintering temperature 1290 °C | Maximum piezoelectric coefficient achieved was 166 pC N−1 at 80% | Ultrasound transducers | 143 |
| Electrochemical coefficient range was 0.73–0.416 | |||||
| Bisphenol A ethoxylate diacrylate (SR349) + Fe2O3 | Fe2O3 conc. (1, 1.5, 2, 4 wt%) | Penetration depth < 50 μm | Theoretical Young's modulus was 23 GPA | Magnetic sensors, MEMS relays | 51 |
| 2,4,6-Trimethylbenzoylphenyl phosphinate (PI) | Resin viscosity 1500−2000 mPa s at 25 °C | Spring constant was 0.16 N m−1 | |||
| Oracet yellow 130 visible dye | Light wavelength 405 nm | ||||
| Power output 30 MW | |||||
| Laser line spacing 0.02 mm | |||||
| EAA (EBECRYL 8413) and aliphatic urethane diacrylate with 33 wt% of isobornyl acrylate resin + MWCNTs | MWCNT conc. 2 to 5 wt% isobornyl acrylate | Light wavelength 405 nm | High mechanical durability (10![[thin space (1/6-em)]](https://www.rsc.org/images/entities/char_2009.gif) 000 cycles), highest sensitivity of 8.939, linearity up to strain of 45% 000 cycles), highest sensitivity of 8.939, linearity up to strain of 45% |
Human motions | 145 |
| (Trimethylbenzoyl) phosphine oxide (TPO) | Power output 30 MW | Strain detection range of ≈60% and low detectable limitation of 0.01% | |||
| Ebecryl 8232 a urethane-acrylate resin + Fe3O4 | Fe304 conc. (0–8 wt%) | Light intensity 10 mW cm−2 | Maximum tensile strength achieved was 7 MPa | Soft robotics, flexible electronics | 52 |
| Phenylbis(2,4,6-trimethylbenzoyl)phosphine oxide (PI) | XY resolution 50 μm | Tensile modulus decreased up to 6 wt% | |||
| Butyl acrylate conc. (0, 25, 50 wt%) | Z resolution 10 μm | ||||
| UV post-curing 10 min | |||||
| 600 clear (E-Shell), ABS 3SP tough (ABS) + Ferucarbotran (FCT) | Acrylic resin conc. (60–80%) | XY resolution 42 μm | MPI performance was 5.6 mg mL−1 | Magnetic particle imaging | 53 |
| Urethane dimethacrylate (5–20%) | Projector resolution 1920 × 1200 pixels | ||||
| Tetrahydrofurfuryl methacrylate (10–25%) | Z resolution range 25–150 μm | ||||
| Diphenyl (2,4,6-trimethylbenzoyl) phosphine oxide (less than 1%) | |||||
| Poly(ethylene glycol) diacrylate (PEGDA) + poly(3,4-ethylenedioxythiophene) polystyrene sulfonate (PEDOT:PSS) | Irgacure 819 (PI) 0.5, 1, 6 wt% | Printer (Microla Optoelectronics) | Maximum electrical conductivity achieved was 0.05 S cm−1 | Biosensors, energy storage | 146 |
| PEDOT:PSS 1, 5 wt% | Laser power density 15 W mm−2 | Maximum Young's modulus achieved was 21 MPa | |||
| Scan velocity 1000 mm s−1 | |||||
| Hatch spacing 50 μm | |||||
| Layer thickness 100 μm | |||||
| Monofunctional EAA (EBECRYL 113) and AUD (EBECRYL 8413) + rGO | rGO conc. 1, 2, 3 wt% | Printer B9 Core 550, B9 Creations | Highest sensitivity of 6.723 at linear detection range of 40% | Strain sensors, human motion detection | 147 |
AUD and EAA ratio 1![[thin space (1/6-em)]](https://www.rsc.org/images/entities/char_2009.gif) : :![[thin space (1/6-em)]](https://www.rsc.org/images/entities/char_2009.gif) 9 9 |
Light wavelength 405 nm | High mechanical durability (10![[thin space (1/6-em)]](https://www.rsc.org/images/entities/char_2009.gif) 000 cycles) 000 cycles) |
|||
| Diphenyl (2,4,6-trimethylbenzoyl) phosphine oxide (TPO) | Power output 200 W | ||||
| Light intensity 30 mW cm−2 | |||||
| Conduct-O-Fil AG CLAD 12 acrylate + silver | Silver conc. 1.0–4.0 wt% | Work again on this reference | Electrical conductivity range was 31–793 S m−1 | EMI shielding, flexible electronics | 138 |
| Poly(ethylene glycol) diacrylate + CNTs | CNTs conc. (0.1, 0.3, 0.5, 1, 1.5 wt%) | Light wavelength 405 nm | Maximum Young's modulus achieved was 10.3 MPa | Electrical components | 148 |
| Bis(2,4,6-trimethylbenzoyl)-phosphineoxide (BAPO) (PI) | Light intensity 22 mW cm2 | Maximum conductivity achieved was 8.00 × 10⁻⁶ S cm−1 | |||
| Exposure time 2–3 s per layer | |||||
| Genesis® Development resin | G conc. up to 2 wt% carbonyl iron | Light wavelength 406 nm | Maximum reflection loss was −54.4 dB | Microwave absorbers | 149 |
| Base (Tethon 3D) + graphene | Light intensity: 33.4 mW cm−2 | Effective absorption bandwidth was 3.41 GHz | Rapid prototyping | ||
| Slice thickness: 50 μm | |||||
| Exposure time: 3, 5, 8, and 12 s | |||||
| 3DSR ultra-high resolution resin + iron oxide (Fe3O4) | Fe3O4 conc. 0.5 wt% | Titan2 SLA printer | Relative grayscale value achieved was 70 | Magnetic sensors, biomedical implants | 150 |
| Isobornyl acrylate (diluent) | Layer thickness 100 μm | Highest magnetic flux density was Norm 1.00 × 10⁻⁴ T | |||
| Exposure time 8–5 s | |||||
| High temp resin V1 (Formlabs) + CNTs | CNTs conc. (0.030, 0.050, 0.075, 0.100, 0.150 wt%) | B9Creator printer | Maximum electrical conductivity achieved was 1 × 10⁻² S m−1 | Strain sensing applications | 151 |
| Layer thickness 30 μm | Maximum Young's modulus achieved was 2.9 GPa | ||||
| Exposure time 5.12–6.84 s | |||||
| Flex resin (Makerjuice Lab) + PZT | PZT conc. 2, 5, 10, 18 wt% | Layer thickness 25 μm | Maximum dielectric permittivity was 120 at 100 Hz | Electronic applications, capacitors | 152 |
| Methacrylate 60–90 wt% | Exposure time 10 s | Dielectric loss was 0.028 at 100Hz | |||
| 1,6-Hexanediol methacrylate 5–15 wt% | Maximum capacitance was 63 Fg−1 at a current density of 0.5 Ag−1 | ||||
| Photoinitiator 0.1–1 wt% | |||||
| Grey resin (Formlabs) + graphene | G conc. 0.02, 0.05, 0.10 wt% | Form 2 Formlabs printer | Maximum tensile strength achieved was 175 MPa | Lattice structures | 58 |
| Light wavelength 405 nm | Maximum modulus was 65 MPa | ||||
| Layer resolution 0.05 mm | Maximum energy absorption was 14 kJ m−3 | ||||
| Printed material density 1.20 g cm−3 | |||||
| TEGORAD 2800 (TRAD), a PDMS acrylate + boron nitride (BN) | BN conc. (0, 0.99, 2.91, 4.76 wt%) | Asiga printer | Maximum conductivity achieved was 0.21 W mK−1 | Electronics | 153 |
| Bis(2,4,6-trimethylbenzoyl)-phosphineoxide (BAPO) (PI) | Light wavelength 405 nm | Maximum tensile strength achieved was 1.24 MPa | |||
| X–Y resolution 50 μm | Maximum elongation at break achieved was 40% | ||||
| Z axis control 1 μm | |||||
| Layer thickness 50–75 μm | |||||
| Light intensity 40 mW cm−2 | |||||
| Exposure time 10–25 s |
Löwa et al. investigated the feasibility of magnetic nanocomposites for the manufacturing of sophisticated magnetic particle imaging (MPI) sensors and phantoms, as shown in Fig. 21. A protocol was developed for the systematic quality evaluation of 3D-printed magnetic nanocomposites to fabricate long-term, complex MPI sensors with defined magnetic properties. To magnetically characterize the liquid resin and the printed photopolymers with embedded nanofillers, the quasi-static and dynamic magnetization behavior were measured.53
 | ||
| Fig. 21 3D-printed demonstrator using E-shell without MNP (a) and with MNP (b) at a concentration of c(Fe) = 3.5 mg mL−1. The evaluation of the process ability of two different photopolymers (E-shell and ABS) with and without MNP (EFH3) was done by visual control of each structure. For each angle, with respect to the printing direction (0°, 30°, 45°, and 90°), the size range in which a successful formation was observed is covered by the bar (c) (reproduced from ref. 53. Copyright 2019, Elsevier). | ||
In another study, Lai et al. studied the viscoelastic and high strain rate response of anisotropic graphene-based polymer nanocomposites by dynamic mechanical analysis and split-Hopkinson pressure bar. Graphene nanoparticles were mixed in a commercial photopolymer resin with a concentration of 0.02 wt% to 0.10 wt%. The storage modulus and dynamic failure strength of the printed nanocomposites improved with an increase in nanofiller concentration up to 0.8 wt% due to the maximum load transfer to the nanofillers. However, increasing the concentration up to 0.10 wt% resulted in worse mechanical properties due to the presence of a weak interface between graphene and the polymer resin. This was due to the agglomeration of the nanoparticles in the polymer matrix. The resulting nanocomposites were also tested for different axes for the alignment of graphene in the polymer. When the nanocomposite was loaded in an axis parallel to the print axis, the composite adopted an isostrain geometry, which offered high dynamic modulus and strength. The printed nanocomposite lattice structures showed better energy absorption capabilities than balsa wood, syntactic ceramic foams and Al foams on a per unit weight basis.58
The strain-sensing performance of printed nanoparticles has been widely studied using the resulting nanocomposites. For example, Cortés et al. studied the mechanical and strain sensing capabilities of carbon nanotube (CNT)-based nanocomposites by DLP 3D printing. Different factors were analyzed including nanofiller concentration and post-curing. It was found that post-treatment significantly improved the Young's modulus and glass transition temperature, Tg. The strain sensitivity was measured by tensile and bending tests. The strain sensing tests showed a linear response of electrical resistance with applied strain with greater sensitivity achieved by decreasing the CNT concentration. Also, the electrical sensitivity of the tensile tests was more than the bending tests due to the compression-subjected face effect. An increase in nanofiller concentration decreased the Young's modulus of the resulting nanocomposites due to the high shielding effect.151
Qian et al. printed a reduced graphene oxide rGO/elastomer nanocomposite resin with structural-modulated sensitivity for monitoring various human motions and flexible strain sensors by DLP 3D printing. The rGO/ER nanocomposite resin was prepared by mixing acrylated aliphatic epoxy (EAA), aliphatic urethane diacrylate (AUD), and rGO in a certain mass proportion. The nanofiller concentration had a direct effect on the electrical conductivity of the nanocomposite. The incorporation of less than 2 wt% rGO did not make the composite conductive, whereas above 2 wt% increased the viscosity, thus making it difficult for printing. In this case, 2 wt% rGO was used throughout the study. The resulting nanocomposite had a sensitivity of 6.723 at a strain rate of 40% and good stability and mechanical durability of more than 10![[thin space (1/6-em)]](https://www.rsc.org/images/entities/char_2009.gif) 000 stretching–relaxing cycles, as shown in Fig. 22. A flexible strain sensor and rhombic structure as electrodes were printed, demonstrating its potential use for human motion detection.147
000 stretching–relaxing cycles, as shown in Fig. 22. A flexible strain sensor and rhombic structure as electrodes were printed, demonstrating its potential use for human motion detection.147
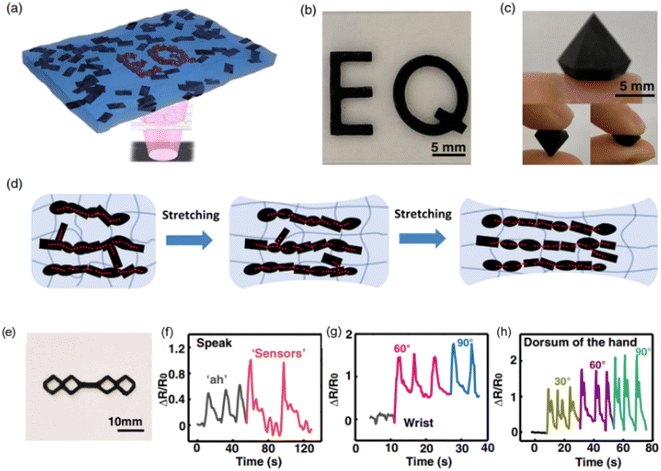 | ||
| Fig. 22 (a) Schematic diagram of the DLP-based 3D printing process. (b) Photograph of 3D-printed letters “E” and “Q” based on RGO/ER. (c) Photograph of RGO/ER-based diamond by DLP-based 3D printing. (d) Conductive path variation in the RGO/ER composite during mechanical deformation. (e) Photograph of an all 3D-printed flexible strain sensor based on RGO/ER. (f) Electrical responses of the strain sensor for pronunciation test. (g) Electrical responses of the device for the bending of the wrist. (h) Electrical responses of sensor under the bending of the dorsum of the hand (reproduced and adopted with permission from ref. 147. Copyright 202, Wiley Online Library). | ||
Xiao et al. developed flexible strain sensors by DLP 3D printing using UV-curable multi-walled carbon nanotube (MWCNT)-based nanocomposites. Different concentrations of MWCNTs (2–5 wt%) were used in this study. Increasing the concentration of MWCNTs increased the elastic modulus, which was attributed to the high stiffness of the nanofillers and their strong interfacial bonding with the polymer matrix. Similarly, to achieve the maximum dispersion of nanofillers, introducing a magnetic field in the printing process or using surfactant-encapsulated MWCNTs was suggested for future study. Accordingly, 2 wt% of the nanocomposite delivered a sensitivity of 8.939 with linearity of up to 45% strain. The strain sensor had a detectable strain range from 0.01% to 60%, high mechanical durability (10![[thin space (1/6-em)]](https://www.rsc.org/images/entities/char_2009.gif) 000 cycles), and linear responses to humidity and temperature, as shown in Fig. 23. The 3D-printed flexible strain sensor arrays showed efficiency in detecting various external deformations.145
000 cycles), and linear responses to humidity and temperature, as shown in Fig. 23. The 3D-printed flexible strain sensor arrays showed efficiency in detecting various external deformations.145
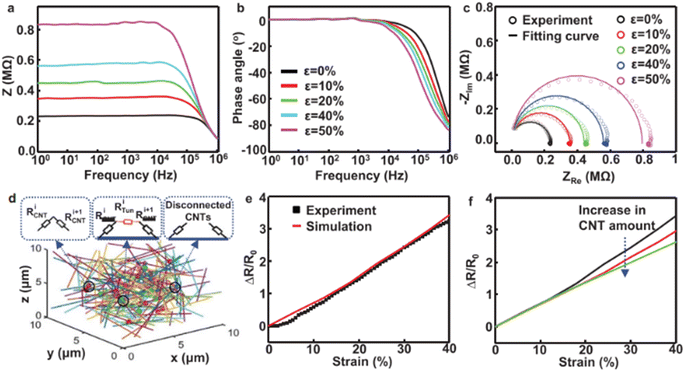 | ||
| Fig. 23 (a) Total impedance (Z)–frequency curves of the MWCNT/EA-2-based sensor at various strain. (b) Phase angle (θ)–frequency curves of the MWCNT/EA-2-based sensor at various strain. (c) Cole–Cole plots of the MWCNT/EA-2-based sensor at various strain and the fitting curve with an equivalent circuit model. (d) Schematic for the random distribution MWCNTs in a unit cell and the different interconnections between two MWCNTs. (e) Electrical response of the MWCNT/EA-2-based sensor to the applied strain by experimental measurement and numerical simulation. (f) Numerical simulation of relative resistance variation in response to the strain at different numbers of MWCNTs in a 3D unit cell (reproduced with permission from ref. 145. Copyright 2020, Online Wiley Library). | ||
Safaee et al. investigated field-assisted DLP to print functionally graded nanocomposites embedded by magnetic nanoparticles. Black iron oxide (Fe3O4) nanoparticles were mixed in a commercial high-resolution polymer resin. The nanofiller concentration was fixed at 0.5 wt% together with a control sample having no fillers. Some parts of the printed specimens did not experience a magnetic field due to the strong aggregation of the nanoparticles. The concentration of the nanoparticles was dependent on the surface area and strength of the magnets as well as the distance between the printing bed and the magnets. A finite element model was also developed to verify the experimental results and the effect of magnet location on the nanoparticle concentration.150
Zuo et al. studied the microwave absorption characteristics of graphene-based methacrylate nanocomposites by DLP 3D printing. Different concentrations of graphene and carbonyl iron were used to adjust the resin composition to achieve the maximum properties. The nanocomposite produced with 1 wt% graphene had a maximum reflection loss (RL) of 54.4 dB at a thickness of 2.1 mm and an efficient absorption (RL: −10 dB) bandwidth as wide as 3.41 GHz. The magnetic loss of the microspheres and the many dielectric resonances from the interfacial polarization and accompanying relaxation were the underlying determinants of the enhanced microwave absorbing properties, as shown in Fig. 24. Thus, these nanocomposites can be used in multiple applications including microwave absorbers.149
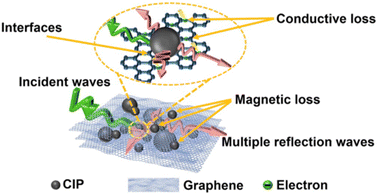 | ||
| Fig. 24 Schematic diagram of microwave absorption mechanism of graphene/CIP/PMMA composites (reproduced with permission from ref. 149. Copyright 2019, Elsevier). | ||
Lantean et al. studied the magneto-responsive behavior of 3D-printed polymer nanocomposites with tunable mechanical and magnetic properties. The magnetic response of the printed structures could easily be altered with nanofiller loadings of up to 6 wt%. The stability of the nanofillers in the resin was also checked for printing as a result of their homogenous dispersion. Dynamic mechanical thermal analysis (DMTA) was used to examine the thermo-mechanical properties of the fabricated specimens. The mechanical properties of the magneto-responsive polymers were tailored from stiff to soft by combining acrylate resins with butyl acrylate and the magnetic response of the printed parts was tuned by changing the Fe3O4 loading. Different samples were printed and showed varying stiffness, and their magnetic response probed by rolling, translation, stretching, folding and unfolding, as shown in Fig. 25.52
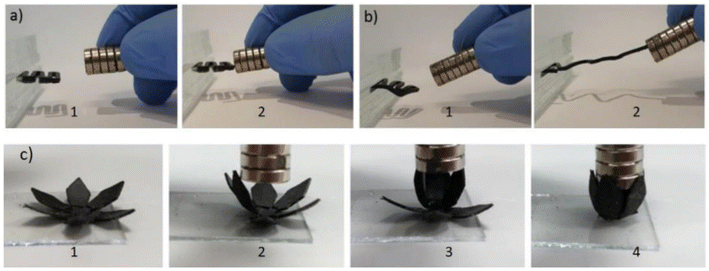 | ||
| Fig. 25 Different 3D printed magnetic objects. Spring printed with (a) 2 wt% filler concentration and (b) 6 wt% filler concentration. (c) Printed flower that closes when exposed to a magnetic field (reproduced and adapted with permission from ref. 52. Copyright 2019, Wiley Online Library). | ||
Similarly, Credi et al. printed cantilever-based microstructures by using magnetite nanoparticles in the polymer matrix. High printing formulations were characterized by small critical energy and reduced penetration depth of less than 50 μm, which enabled fast printing of cantilever microstructures. Bisphenol A ethoxylate diacrylate (SR349) resin was used in this study. The magnetic sensitivity of the microstructures was characterized by tip deflection when an external magnetic field was applied magnetically actuated. The micro-sensing actuators were quantitatively studied by static flexural behavior versus the magnetic field applied. The results showed larger deformations for the nanocomposites printed entirely with ferromagnetic nanoparticles, and thus they can be potentially used in sensing applications.51
In another study, Jiang et al. printed piezoelectric scaffolds using barium titanate (BaTiO3) nanoparticles and investigated their effects on mechanical and piezoelectric properties. The liquid photopolymer resin and different concentrations of BaTiO3 nanoparticles (10% and 20% up to 90%) were used to form different slurries. An increase in nanofiller concentration directly affected the density of the sintered nanocomposites. The electrical properties of the resulting nanocomposite were analyzed by printing ceramic disks with a diameter of 10 mm and thickness of 0.6 mm. The piezoelectric coefficient increased from 96 to 166 pC N−1 when 82 wt% content of nanofiller was used but then decreased beyond 82 wt%. By changing the porosity of the scaffold, the desired electrical and mechanical properties were achieved. An increase in porosity made the BaTiO3 scaffolds more uniform and easier to print. The maximum compressive strength piezoelectric coefficients were achieved at 10% porosity, as shown in Fig. 26. These nanocomposites have found applications in orthopedics and bone implants.143
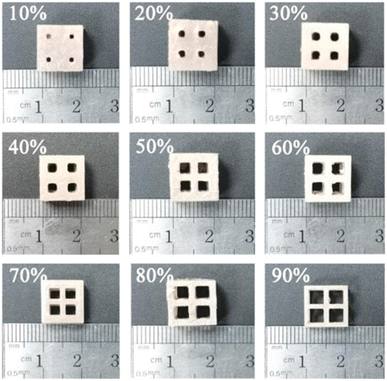 | ||
| Fig. 26 Porous structure of BaTiO3 ceramics and samples with different porosity (reproduced with permission from ref. 143. Copyright 2022, Elsevier). | ||
Introducing a magnetic field inside the polymer resin affects different properties of the resulting nanocomposite. This idea was implemented by Younes et al., who prepared a magnetic nanofiller-based nanocomposite, where the magnetic Fe3O4@graphene inside the polymer was aligned with a magnetic field. The mechanical properties of the nanocomposites were significantly enhanced by the alignment of the nanofillers and the angle of the magnetic field. It was evident from their results that 0° alignment of the nanofillers improved the mechanical properties more compared to 90° alignment at the concentrations of 0.4, 0.8, and 1.6 wt%. This enhancement was due to the excellent orientation and good dispersion of the nanofiller in the polymer matrix. The Young modulus showed a significant improvement at a concentration of 0.8 wt% and 0° magnetic field angle. An increase in the nanofiller concentration up to 1.6 wt% resulted in a decrease in the Young modulus despite the alignment of the filler materials. This was due to the incomplete polymerization caused by the aggregation of Fe3O4@graphene inside the polymer matrix, as evident somewhere, as too high concentration of nanoparticles blocks the incoming light source, which results in incomplete polymerization.140
The tribology of the nanocomposites was investigated by Hanon et al., who studied the tribological characteristics of graphene-based nanocomposite by accessing different parameters such as the surface roughness, microstructure, friction, wear, and hardness properties of the tested materials. Here, in this study, low-concentration graphene contents in the polymer matrix were sufficient for the enhancement of the friction coefficient as it was reduced by 50% compared to the control samples. Furthermore, the impact of graphene on the tribological behavior of the nanocomposite and its difference with varying nanoparticle concentrations and different printing parameters were studied. Vertical and 45° angle orientations had substantial effects on the tribological properties.141
Recently, VPP processes such as SLA and DLP have found their way into many magnetic property-related applications, such as micro-actuators, fluidics, strain sensors, and functionally graded materials, i.e., smart polymers, which are responsive to any external stimuli.51,154 Magnetic nanofiller-based composites printed with VPP are more feasible than that with the material extrusion and material jetting methods in terms of resolution, inhomogeneous magnetic response, and processing temperatures.52 Due to the ease of printability and the ability to build complex structures, VPP processes can be used for different smart applications using magnetic nanofillers. Some new modifications in the machine to stabilize the fillers inside the resin, investigating new materials as fillers and the matrix and proper optimization of the nanocomposite preparation routes are some suggestions for future research.
The electrical and thermal properties of polymer nanocomposites printed by VPP processes are also studied in parallel. There are many factors that affect their electrical and thermal conductivity, including filler concentration and matrix type.155
Pezzana et al. printed polydimethylsiloxane (PDSM)-based polymer nanocomposites with enhanced thermal conductivity using boron nitride nanofillers by DLP 3D printing. Before printing, the viscosity and reactivity of different formulations were checked. It was found that with an increase in nanofiller concentration, the viscosity increased and a delay in crosslinking occurred. The viscoelastic and thermomechanical properties of the 3D-printed nanocomposites had a slight effect on the Tg, and an increase in the elastic modulus of the polymer matrix occurred with an increase in the nanofiller concentration. Similarly, the thermal conductivity showed an improvement in terms of k values with an increase in the filler by about 46% and the thermal diffusion had a 78% enhancement.153
Gonzalez et al. developed a nanocomposite resin using carbon nanotubes (CNTs) with enhanced electrical conductivity. The viscosity and dispersion stability were adjusted by adding a reactive diluent to the polymer matrix. The incorporation of the nanoparticles in the polymer matrix increased the viscosity due to the aggregation and agglomeration of the nanoparticles. A too viscous resin cannot be printed, and therefore proper attention was given to adjust the viscosity. Similarly, with the addition of nanofiller concentration, the glass transition temperature (Tg) decreased, which was because of the reduction in crosslinking density due to the high absorption of the nanofillers. The mechanical properties also decreased by increasing the CNT concentration. When 0.1 wt% CNTs was used, the resulting elastic modulus was 70% higher than that of the control specimens but then it decreased with the addition of CNTs. The reverse trend was found for electrical measurements, as shown in Fig. 27. The addition of 0.1 wt% CNTs enhanced the conductivity by two orders of magnitude compared to the neat specimens and further increased with a high amount of nanofiller.148
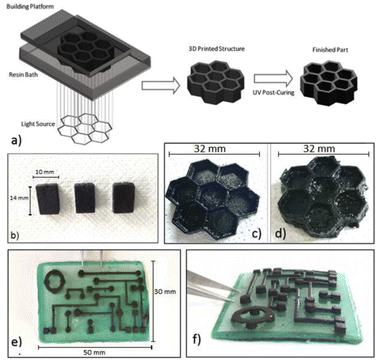 | ||
Fig. 27 (a) Representative scheme of the DLP 3D printing process. (b) 3D printed cubes (14 × 10 × 3 mm of dimensions) obtained using DLP printer with PEGDA![[thin space (1/6-em)]](https://www.rsc.org/images/entities/char_2009.gif) : :![[thin space (1/6-em)]](https://www.rsc.org/images/entities/char_2009.gif) PEGMEMA 1 PEGMEMA 1![[thin space (1/6-em)]](https://www.rsc.org/images/entities/char_2009.gif) : :![[thin space (1/6-em)]](https://www.rsc.org/images/entities/char_2009.gif) 1.5 wt/wt formulation containing 0.3 wt% CNTs. (c) 3D hexagonal structure (thickness of 5 mm) containing, 0.1 wt% CNTs and (d) 0.3 wt% CNTs. (e and f) Circuit-like structure built on an insulating base (PEGDA 1.5 wt/wt formulation containing 0.3 wt% CNTs. (c) 3D hexagonal structure (thickness of 5 mm) containing, 0.1 wt% CNTs and (d) 0.3 wt% CNTs. (e and f) Circuit-like structure built on an insulating base (PEGDA![[thin space (1/6-em)]](https://www.rsc.org/images/entities/char_2009.gif) : :![[thin space (1/6-em)]](https://www.rsc.org/images/entities/char_2009.gif) PEGMEMA 1 PEGMEMA 1![[thin space (1/6-em)]](https://www.rsc.org/images/entities/char_2009.gif) : :![[thin space (1/6-em)]](https://www.rsc.org/images/entities/char_2009.gif) 1.5 wt/wt with brilliant green as colorant) with suspended elements containing 0.1 wt% CNTs (reproduced with permission from ref. 148 Copyright 2017, Elsevier). 1.5 wt/wt with brilliant green as colorant) with suspended elements containing 0.1 wt% CNTs (reproduced with permission from ref. 148 Copyright 2017, Elsevier). | ||
In another study, Niendorf et al. combined SLA 3D printing and the ultrasound-directed self-assembly approach to produce polymer nanocomposites with anisotropic electrical conductivity. The electrical conductivity of the printed specimens was related to different process parameters including transducer power, the filler concentration and alignment as these parameter are critical for a long-range percolated network of conductive fillers. The electrical conductivity of the printed specimens was in the range of 31–793 S m−1. The process parameters had a direct effect on conductivity and are critical in predicting the conductive or insulating properties of the samples, as shown in Fig. 28. The practical applications of this approach have some engineering applications such as electromagnetic interface shielding, flexible electronics, and embedded electrical wiring materials.138
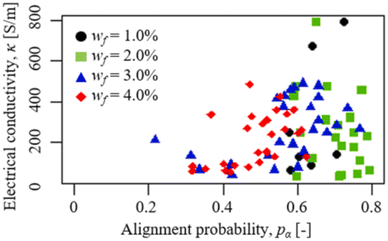 | ||
| Fig. 28 Electrical conductivity, κ, as a function of microfiber alignment probability, pα, for different values of the microfiber weight fraction, wf (reproduced with permission from ref. 138. Copyright 2021, Elsevier). | ||
Scordo et al. prepared a high-conductive nanocomposite resin for SLA using poly(ethylene glycol) diacrylate (PEGDA) enriched with the conductive nanofiller poly(3,4-ethylenedioxythiophene):polystyrene sulfonate (PEDOT:PSS). The photoinitiator (PI), surfactant and nanofiller concentration were optimized to get a conductive resin. When the PI concentration was increased up to 6 wt%, the conductivity decreased, and the samples became well-polymerized and solid; however, the nanocomposite resin was very unstable and prone to unwanted polymerization. When the concentration of nanofiller used was 5 wt%, excellent mechanical properties of 21 MPa and remarkable electrical conductivity of 0.05 S cm−1 were achieved, thus resulting in a suitable material for use in miniature systems such as microsensors and microfluidic devices. The good mechanical and electrical properties were preserved as the 3D printed materials obtained their structural integrity and conductivity for 30 days.146
In another study, Yang et al. proposed a polymer nanocomposite resin for the printing of dielectric capacitors by projection-based stereolithography. In this study, PZT nanoparticles were coated with Ag, and then mixed in a photo-curable polymer resin to fabricate dielectric capacitors. The dielectric permittivity was remarkably enhanced by the effective coating and MWS effect. Similarly, the low loss of 0.028 at 100 Hz was attributed to the blockage of charge transfer by the nanocomposite resin and suppression of electric distortion. The maximum specific capacitance achieved was about 63 F g−1 at a current density of 0.5 A g−1.152
Park et al. fabricated graphene nanoplatelet (GNP)-based nanocomposites with enhanced thermal conductivity. A commercially available HDDA-based resin was used with some additional additives with varying GNP concentrations (0, 1, 2, 3, 4 wt%). Increasing the GNP concentration in the polymer matrix to a certain extent enhanced the thermal conductivity by 14.6% compared to the random distribution of GNP, as shown in Fig. 29. Greater than 4 wt% GNP concentration reduced the thermal conductivity and mechanical properties as excessive nanoparticles agglomerated, which blocked the light source and resulted in incomplete curing. In comparison with epoxy, the 3D-printed HDDA nanocomposite showed poor performance in mechanical properties with a value of 14.9 MPa.144
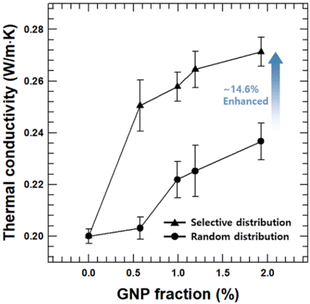 | ||
| Fig. 29 Thermal conductivity of HDDA/epoxy composites with varying amounts of selectively distributed GNP, and epoxy composites with varying amounts of randomly distributed GNP. Selectively distributed GNPs enhanced the conductivity by 14% (reproduced with permission from ref. 144. Copyright, 2021 Elsevier). | ||
Lim et al. improved the electrical conductivity of the resulting nanocomposite by adding multi-walled carbon nanotubes (MWCNT) by solution intercalation method. Given that the efficient dispersion of nanoparticles in the host matrix is critical for customized properties, proper attention was paid to this issue. MWCNTs were dispersed in a polyurethane-based commercial resin using tip sonication, maintaining high dimensional accuracy and good electrical conductivity. Complex structured metamaterials and different capacitive sensors were fabricated from the resulting conductive nanocomposite. It was observed that high dimensional accuracy and electrical conductivity of up to 0.071 S m−1 were achieved using a nanofiller concentration of 0.6 wt%, as shown in Fig. 30. This is the first study of its kind to provide a correlation between nanofiller concentration and printing quality by quantitatively measuring the dimensional accuracy.139
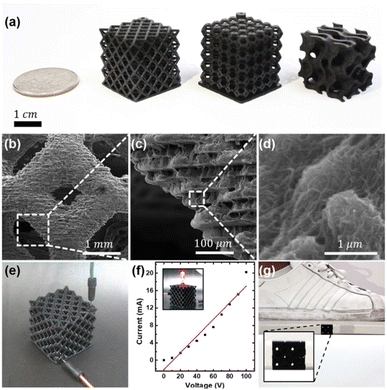 | ||
| Fig. 30 3D-printed conductive complex metamaterial: (a) mechanical metamaterials constructed using 0.6 wt% MWCNT nanocomposites (left), Kelvin foam (center), and gyroid (right). (b–d) SEM images of Kelvin foam with 0.6 wt% MWCNT. (e) Wiring with jumper cables in metamaterial structure. (f) Current versus voltage curves from 3D-printed conductive structure. (g) Gyroid structure with mechanical load of up to 70 kg (reproduced with permission from ref. 139. Copyright 2022, Elsevier). | ||
Wang et al. prepared an industrially feasible approach for preparing a UV photo-curable nanocomposite by using cellulose nanocrystals (CNCs) as a nanofiller. The CNCs were grafted to the methacrylate malate photocurable resin to improve their uniform dispersion in the matrix, as shown in Fig. 32. Increasing the CNC concentration up to 1 wt% increased the dielectric constant from 4.0 to 10.9 at 1 MHz. This was attributed to the excellent interfacial effects between the nanoparticles and polymer resin and the presence of abundant (–OH) groups. This prepared nanocomposite resin was used in an energy storage application, where the capacitance of the 1 wt% CNC ring-shaped capacitor improved by 132% compared to the control specimens.142
The thermal conductivity of halloysite nanoclay was found to be greater than that of silver and copper nanoparticles, with the addition of 0.3 wt% and increased from 0.681 W mK−1 to 0.721 W mK−1 compared to the clear resin.156 This increase in conductivity was due to the good interface between the nanofiller and the polymer matrix, which created conductive paths, increasing the conductivity. In a similar study, the electrical conductivity increased by decreasing the nanofiller content and was found to be greater than that of silver nanoparticles. This was because the electrical resistance showed by copper was greater than that of silver nanoparticles.157 The long-term stability of boehmite wires improved the mechanical properties of the resulting nanocomposites, as shown in Fig. 31.137
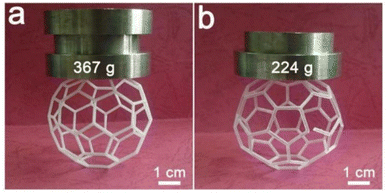 | ||
| Fig. 31 Long-term stability of 3D printed objects by compression test. (a) HDDA resin with β-CEA-AlOOH (4 wt%) and (b) neat HDDA resin. The weights of stainless steel plates on top of model was 367 g (a) and 224 g (b), respectively (reproduced with permission from ref. 137. Copyright 2018, Elsevier). | ||
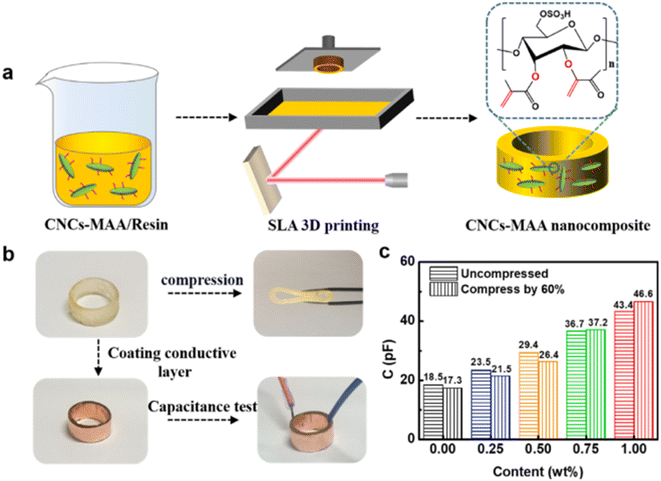 | ||
| Fig. 32 (a) Diagram of 3D printing process of a ring capacitor. (b) Assembly process of a ring capacitor by 3D-printed composites and this printed module had good flexibility. (c) Capacitance without compression (left) and 60% compression (right) at various CNC-MAA contents (reproduced with permission from ref. 142. Copyright 2022, Elsevier). | ||
Post-treatment in the form of thermal curing or UV curing also affects the electrical properties. In fact, thermal curing is more feasible than UV curing in terms of enhancements in electrical conductivity.60 In the study by Chiappone et al., the electrical conductivity of 0.3 wt% GO in an acrylate mixture increased from 50.8 nS cm−1 to 109.5 nS cm−1 by applying thermal post-curing, while the conductivity decreased to 15.72 nS cm−1 when it was post-cured by UV treatment.153
7. Challenges, proposed solutions, and future directions
Despite the many benefits of VPP using nanocomposites, there are several challenges in VPP-based 3D printing when dealing with nanofillers, which hinders the expansion of this technology. The problems that need to be addressed and require further research and development are as follows:(1) VPP has a greater advantage in terms of resolution, surface quality, design flexibility, etc. in comparison to other AM processes but due to the limited material selection of only photopolymer resins, there is a strong need to develop a variety of new materials with excellent properties that are less expensive than current materials.
(2) Viscosity becomes a problem when dealing with photopolymer resins using nanofillers. The incorporation of nanofillers in the photopolymer resin tends to increase in its viscosity, which affects the print process, and consequently affects the desired properties of the printed part. Some photopolymer resins with increased viscosity have high toughness, elasticity, and other desirable properties. However, due to the fact that the current VPP processes cannot print high-viscosity resins, the properties of the photopolymer resins are greatly limited. Therefore, new developments in materials and machines are important to alleviate this issue.
(3) Generally, in the preparation of nanocomposites, the solution intercalation method is applied, which needs a solvent for premixing and filler dispersion. However, the removal of the solvent is difficult and even small traces of solvent molecules can affect the printability and the resulting properties. Some researchers tried a solvent-free approach in the preparation of nanocomposites. Similarly, the aggregation of the nanofillers inside the polymer matrix is also a serious issue, which increases the viscosity, scatters the light, and affects the mechanical properties. Thus, it is necessary to develop enhanced nanocomposite preparation routes to enable the nanofiller to be homogeneously dispersed in the polymer matrix without containing any solvent molecules. In this case, the functionalization of the nanofillers or an optimized sonication route can help reduce agglomeration.
(4) Most nanofillers studied in AM are used to enhance the mechanical properties. However, as there is a lot of variation in mechanical properties by different AM methods, it is not possible to make a single standard for tests and characterizations that is followed by all methods but still there is a need for a set of rules to standardize the mechanical testing/characterizations of 3D-printed polymer parts made by VPP.
(5) The presence of nanofillers in the resin scatters or absorbs the incoming light source at the expense of resolution. Research on new photoinitiators PI and nanofillers is a current requirement to enable photoinitiators to absorb maximum light, while the nanofillers minimize the light scattering or absorbing phenomena.
(6) The utmost aim of any technology or modification in technology is to serve humans. Nanofillers in VPP can help in many ways by enhancing the desired properties. However, nanofillers are not very common in VPP and are mostly limited to lab-scale use as most nanofillers are very expensive and their laboratory preparation requires a skilful and difficult route. Therefore, less expensive nanofillers and photopolymer resins are strongly needed to benefit from the synergy of VPP and nanotechnology.
(7) The integration of nanofillers in VPP involves a lot of complex reactions, different designs, printing parameters, etc. Therefore, to fully address these complexities, comprehensive knowledge about the photopolymerization, curing kinetics, light source, design of experiments, etc. is required, which will aid successful printing with the desired properties.
Conflicts of interest
There are no conflicts to declare.Acknowledgements
This work has received financial support from the European Union's Horizon 2020 research and innovation programme under the Marie Skłodowska-Curie grant agreement No. 101034425. This work was also supported by the National Natural Science Foundation of China (Grant No. 51974224, 52174372), and the Natural Science Foundation of Shaanxi Province (Grant No. 2020JM-047).References
- A. International, ISO/ASTM52900-15 Standard Terminology for Additive Manufacturing – General Principles – Terminology, West Conshohocken, PA, 2015 Search PubMed.
- I. Gibson, D. Rosen and B. Stucker, in Additive Manufacturing Technologies: 3D Printing, Rapid Prototyping, and Direct Digital Manufacturing, ed. I. Gibson, D. Rosen and B. Stucker, Springer New York, New York, NY, 2015, pp. 1–18 Search PubMed.
- Y. Wang, R. Blache and X. Xu, Rapid Prototyp. J., 2017, 23, 434–447 CrossRef.
- A. International, ASTM F2792-12a, Standard Terminology for Additive Manufacturing Technologies, 2012 Search PubMed.
- A. Ullah, A. Ur Rehman, M. U. Salamci, F. Pıtır and T. Liu, Rapid Prototyp. J., 2022, 28, 1796–1807 CrossRef.
- S. Zakeri, M. Vippola and E. Levänen, Addit. Manuf., 2020, 35, 101177 CAS.
- M. Khorasani, J. Loy, A. H. Ghasemi, E. Sharabian, M. Leary, H. Mirafzal, P. Cochrane, B. Rolfe and I. Gibson, Rapid Prototyp. J., 2022, 1462–1475 CrossRef.
- R. Godina, I. Ribeiro, F. Matos, B. T. Ferreira, H. Carvalho and P. Peças, Sustainability, 2020, 12(17), 7066 CrossRef.
- T. Wohlers, Wohler's Report, 3d printing and Additive Manufacturing, Global state of the industry, 2022 Search PubMed.
- X. Xu, A. Awad, P. Robles-Martinez, S. Gaisford, A. Goyanes and A. W. Basit, J. Controlled Release, 2021, 329, 743–757 CrossRef CAS PubMed.
- T. Kuhnt and S. Camarero-Espinosa, Carbohydr. Polym., 2021, 252, 117159 CrossRef CAS PubMed.
- C. Yu, J. Schimelman, P. Wang, K. L. Miller, X. Ma, S. You, J. Guan, B. Sun, W. Zhu and S. Chen, Chem. Rev., 2020, 120, 10695–10743 CrossRef CAS PubMed.
- N. Poomathi, S. Singh, C. Prakash, A. Subramanian, R. Sahay, A. Cinappan and S. Ramakrishna, Rapid Prototyp. J., 2020, 26, 1313–1334 CrossRef.
- Q. Zhang, H.-P. Bei, M. Zhao, Z. Dong and X. Zhao, Biomaterials, 2022, 286, 121566 CrossRef CAS PubMed.
- J. J. Beaman, D. L. Bourell, C. C. Seepersad and D. Kovar, J. Manuf. Sci. Eng., 2020, 142, 110812 CrossRef.
- T. D. Ngo, A. Kashani, G. Imbalzano, K. T. Q. Nguyen and D. Hui, Composites, Part B, 2018, 143, 172–196 CrossRef CAS.
- R. P. Chaudhary, C. Parameswaran, M. Idrees, A. S. Rasaki, C. Liu, Z. Chen and P. Colombo, Prog. Mater. Sci., 2022, 128, 100969 CrossRef CAS.
- M. Picard, A. K. Mohanty and M. Misra, RSC Adv., 2020, 10, 36058–36089 RSC.
- T. Vaneker, A. Bernard, G. Moroni, I. Gibson and Y. Zhang, CIRP Ann., 2020, 69, 578–599 CrossRef.
- G. A. Appuhamillage, N. Chartrain, V. Meenakshisundaram, K. D. Feller, C. B. Williams and T. E. Long, Ind. Eng. Chem. Res., 2019, 58, 15109–15118 CrossRef CAS.
- M. K. Thompson, G. Moroni, T. Vaneker, G. Fadel, R. I. Campbell, I. Gibson, A. Bernard, J. Schulz, P. Graf, B. Ahuja and F. Martina, CIRP Ann., 2016, 65, 737–760 CrossRef.
- M. Peerzada, S. Abbasi, K. T. Lau and N. Hameed, Ind. Eng. Chem. Res., 2020, 59, 6375–6390 CrossRef CAS.
- H. Wu, W. P. Fahy, S. Kim, H. Kim, N. Zhao, L. Pilato, A. Kafi, S. Bateman and J. H. Koo, Prog. Mater. Sci., 2020, 111, 100638 CrossRef CAS.
- L. J. Tan, W. Zhu and K. Zhou, Adv. Funct. Mater., 2020, 30, 2003062 CrossRef CAS.
- H. Quan, T. Zhang, H. Xu, S. Luo, J. Nie and X. Zhu, Bioact. Mater., 2020, 5, 110–115 CrossRef PubMed.
- A. Bagheri and J. Jin, ACS Appl. Polym. Mater., 2019, 1, 593–611 CrossRef CAS.
- S. C. Ligon, R. Liska, J. Stampfl, M. Gurr and R. Mülhaupt, Chem. Rev., 2017, 117, 10212–10290 CrossRef CAS PubMed.
- G. Gonzalez, I. Roppolo, C. F. Pirri and A. Chiappone, Addit. Manuf., 2022, 55, 102867 CAS.
- A. K. Pal, A. K. Mohanty and M. Misra, RSC Adv., 2021, 11, 36398–36438 RSC.
- L. Strohmeier, H. Frommwald and S. Schlögl, RSC Adv., 2020, 10, 23607–23614 RSC.
- H. Xue, X. Li, J. Xia and Q. Lin, RSC Adv., 2020, 10, 44323–44331 RSC.
- J. R. C. Dizon, A. H. Espera, Q. Chen and R. C. Advincula, Addit. Manuf., 2018, 20, 44–67 CAS.
- K. L. Sampson, B. Deore, A. Go, M. A. Nayak, A. Orth, M. Gallerneault, P. R. L. Malenfant and C. Paquet, ACS Appl. Polym. Mater., 2021, 3, 4304–4324 CrossRef CAS.
- W. Xu, S. Jambhulkar, Y. Zhu, D. Ravichandran, M. Kakarla, B. Vernon, D. G. Lott, J. L. Cornella, O. Shefi, G. Miquelard-Garnier, Y. Yang and K. Song, Composites, Part B, 2021, 223, 109102 CrossRef CAS.
- A. Al Rashid, S. A. Khan, S. G. Al-Ghamdi and M. Koç, J. Mater. Res. Technol., 2021, 14, 910–941 CrossRef CAS.
- A. Al Rashid, W. Ahmed, M. Y. Khalid and M. Koç, Addit. Manuf., 2021, 47, 102279 CAS.
- European Commission, Scientific Basis for the Definition of the Term Nanomaterial, 2010 Search PubMed.
- S. Horikoshi and N. Serpone, Microwaves Nanopart. Synth., 2013, 1–24 CAS.
- Z. Feng, Y. Li, L. Hao, Y. Yang, T. Tang, D. Tang and W. Xiong, J. Nanomater., 2019, 2019, 1–13 CrossRef.
- A. Ronca, L. Ambrosio and D. W. Grijpma, J. Appl. Biomater. Funct. Mater., 2012, 10, 249–258 CAS.
- A. Kumar, S. Kargozar, F. Baino and S. S. Han, Front. Mater., 2019, 6, 313 CrossRef.
- T. Tariverdian, A. Behnamghader, P. Brouki Milan, H. Barzegar-Bafrooei and M. Mozafari, Ceram. Int., 2019, 45, 14029–14038 CrossRef CAS.
- R. M. A. Domingues, M. E. Gomes and R. L. Reis, Biomacromolecules, 2014, 15, 2327–2346 CrossRef CAS PubMed.
- S. J. Trenfield, A. Awad, C. M. Madla, G. B. Hatton, J. Firth, A. Goyanes, S. Gaisford and A. W. Basit, Expert Opin. Drug Delivery, 2019, 16, 1081–1094 CrossRef CAS PubMed.
- L. Sa, L. Kaiwu, C. Shenggui, Y. Junzhong, J. Yongguang, W. Lin and R. Li, J. Mater. Sci., 2019, 54, 3309–3318 CrossRef CAS.
- Y. Cao, T. Shi, C. Jiao, H. Liang, R. Chen, Z. Tian, A. Zou, Y. Yang, Z. Wei, C. Wang and L. Shen, Ceram. Int., 2020, 46, 2300–2308 CrossRef CAS.
- K. Markandan and C. Q. Lai, Composites, Part A, 2020, 129, 105726 CrossRef CAS.
- J. O. Palaganas, N. B. Palaganas, L. J. I. Ramos and C. P. C. David, ACS Appl. Mater. Interfaces, 2019, 11, 46034–46043 CrossRef CAS PubMed.
- H. Joo and S. Cho, Polymers, 2020, 12, 67 CrossRef CAS PubMed.
- E. B. Joyee, A. Szmelter, D. Eddington and Y. Pan, ACS Appl. Mater. Interfaces, 2020, 12, 42357–42368 CrossRef CAS PubMed.
- C. Credi, A. Fiorese, M. Tironi, R. Bernasconi, L. Magagnin, M. Levi and S. Turri, ACS Appl. Mater. Interfaces, 2016, 8, 26332–26342 CrossRef CAS PubMed.
- S. Lantean, G. Barrera, C. F. Pirri, P. Tiberto, M. Sangermano, I. Roppolo and G. Rizza, Adv. Mater. Technol., 2019, 4, 1900505 CrossRef CAS.
- N. Löwa, J.-M. Fabert, D. Gutkelch, H. Paysen, O. Kosch and F. Wiekhorst, J. Magn. Magn. Mater., 2019, 469, 456–460 CrossRef.
- R. Xiao, M. Ding, Y. Wang, L. Gao, R. Fan and Y. Lu, Nanotechnology, 2021, 32, 235702 CrossRef CAS PubMed.
- B. Wang, G. Ding, K. Chen, S. Jia, J. Wei, Y. Wang, R. He and Z. Shao, J. Appl. Polym. Sci., 2020, 137, 49164 CrossRef CAS.
- Y. Li, S. Peng, J.-T. Miao, L. Zheng, J. Zhong, L. Wu and Z. Weng, Chem. Eng. J., 2020, 394, 124873 CrossRef CAS.
- K. Markandan, I. P. Seetoh and C. Q. Lai, J. Mater. Res., 2021, 36, 4262–4274 CrossRef CAS.
- C. Q. Lai, K. Markandan, B. Luo, Y. C. Lam, W. C. Chung and A. Chidambaram, Addit. Manuf., 2021, 37, 101721 CAS.
- G. Wang, R. Raju, K. Cho, S. Wong, B. G. Prusty and M. H. Stenzel, Polym. Chem., 2020, 11, 7253–7263 RSC.
- A. Medellin, W. Du, G. Miao, J. Zou, Z. Pei and C. Ma, J. Micro Nano-Manuf., 2019, 7(3), 031006 CrossRef CAS.
- M. Monzón, Z. Ortega, A. Hernández, R. Paz and F. Ortega, Materials, 2017, 10, 64 CrossRef PubMed.
- Y. Li, J. Zhong, L. Wu, Z. Weng, L. Zheng, S. Peng and X. Zhang, Composites, Part A, 2019, 117, 276–286 CrossRef CAS.
- X. Zhou, M. Nowicki, H. Cui, W. Zhu, X. Fang, S. Miao, S.-J. Lee, M. Keidar and L. G. Zhang, Carbon, 2017, 116, 615–624 CrossRef CAS.
- R. Erbereli, I. L. de Camargo, M. M. Morais and C. A. Fortulan, J. Braz. Soc. Mech. Sci. Eng., 2022, 44, 170 CrossRef CAS.
- Z. Liu, H. Liang, T. Shi, D. Xie, R. Chen, X. Han, L. Shen, C. Wang and Z. Tian, Ceram. Int., 2019, 45, 11079–11086 CrossRef CAS.
- P. F. Jacobs, Fundamentals of Stereolithography, 1992 Search PubMed.
- I. Gibson, D. Rosen and B. Stucker, in Additive Manufacturing Technologies: 3D Printing, Rapid Prototyping, and Direct Digital Manufacturing, ed. I. Gibson, D. Rosen and B. Stucker, Springer New York, New York, NY, 2015, pp. 63–106 Search PubMed.
- I. V. Khudyakov, Prog. Org. Coat., 2018, 121, 151–159 CrossRef CAS.
- R. Chaudhary, P. Fabbri, E. Leoni, F. Mazzanti, R. Akbari and C. Antonini, Prog. Addit. Manuf., 2015, 12, 38–45 Search PubMed.
- P. J. Bártolo, in Stereolithography: Materials, Processes and Applications, ed. P. J. Bártolo, Springer US, Boston, MA, 2011, pp. 1–36 Search PubMed.
- A. Randhawa, S. D. Dutta, K. Ganguly, D. K. Patel, T. V Patil and K.-T. Lim, Macromol. Biosci., 2022, 2200278 Search PubMed.
- J. Z. Manapat, Q. Chen, P. Ye and R. C. Advincula, Macromol. Mater. Eng., 2017, 302, 1600553 CrossRef.
- R. Guerrero-Santos, E. Saldívar-Guerra and J. Bonilla-Cruz, in Handbook of Polymer Synthesis, Characterization, and Processing, 2013, pp. 65–83 Search PubMed.
- C. Decker, T. Nguyen Thi Viet, D. Decker and E. Weber-Koehl, Polymer, 2001, 42, 5531–5541 CrossRef CAS.
- L.-C. Tang, L. Zhao and L.-Z. Guan, Advanced composite materials: properties and applications, De Gruyter Open Poland, 2017, pp. 349–419 Search PubMed.
- C. Mendes-Felipe, J. Oliveira, I. Etxebarria, J. L. Vilas-Vilela and S. Lanceros-Mendez, Adv. Mater. Technol., 2019, 4, 1800618 CrossRef.
- R. J. Mondschein, A. Kanitkar, C. B. Williams, S. S. Verbridge and T. E. Long, Biomaterials, 2017, 140, 170–188 CrossRef CAS PubMed.
- C. H. A. Tsang, A. Zhakeyev, D. Y. C. Leung and J. Xuan, Front. Chem. Sci. Eng., 2019, 13, 736–743 CrossRef CAS.
- D. Lin, S. Jin, F. Zhang, C. Wang, Y. Wang, C. Zhou and G. J. Cheng, Nanotechnology, 2015, 26, 434003 CrossRef PubMed.
- F. P. W. Melchels, J. Feijen and D. W. Grijpma, Biomaterials, 2009, 30, 3801–3809 CrossRef CAS PubMed.
- Z. Feng, Y. Li, C. Xin, D. Tang, W. Xiong and H. Zhang, C, 2019, 25 CAS.
- X. Feng, Z. Yang, S. Chmely, Q. Wang, S. Wang and Y. Xie, Carbohydr. Polym., 2017, 169, 272–281 CrossRef CAS PubMed.
- Anycubic, Wash & Cure Machine 2.0, https://www.anycubic.com/collections/wash-cure-machine/products/wash-cure-machine-2-0 Search PubMed.
- Formlabs, Post processing wash and cure, https://formlabs.com/post-processing/wash-cure/ Search PubMed.
- M. Kumar and V. Sharma, Rapid Prototyp. J., 2021, 27, 1230–1272 CrossRef.
- J. Zhang, H. Eyisoylu, X. H. Qin, M. Rubert and R. Müller, Acta Biomater., 2021, 121, 637–652 CrossRef CAS PubMed.
- S. Rasheed, W. A. Lughmani, M. A. Obeidi, D. Brabazon and I. U. Ahad, Appl. Sci., 2021, 11, 7336 CrossRef CAS.
- S.-J. Lee, W. Zhu, M. Nowicki, G. Lee, D. N. Heo, J. Kim, Y. Y. Zuo and L. G. Zhang, J. Neural Eng., 2018, 15, 16018 CrossRef PubMed.
- Y. Zeng, Y. Yan, H. Yan, C. Liu, P. Li, P. Dong, Y. Zhao and J. Chen, J. Mater. Sci., 2018, 53, 6291–6301 CrossRef CAS.
- L. Zhang, H. Forgham, A. Shen, J. Wang, J. Zhu, X. Huang, S. Y. Tang, C. Xu, T. P. Davis and R. Qiao, J. Mater. Chem. B, 2022, 10, 7473–7490 RSC.
- S. Singh and D. Kumar (Professor of supply chain management), Fabrication and machining of advanced materials and composites : opportunities and challenges, 2022 Search PubMed.
- C. Feng, K. Zhang, R. He, G. Ding, M. Xia, X. Jin and C. Xie, J. Adv. Ceram., 2020, 9, 360–373 CrossRef CAS.
- Y. Zhao, P. Li, P. Dong, Y. Zeng and J. Chen, Ceram. Int., 2021, 47, 1053–1062 CrossRef CAS.
- H. Liang, Y. Wang, S. Chen, Y. Liu, Z. Liu and J. Bai, Int. J. Bioprint., 2022, 8, 198–210 Search PubMed.
- J. Bustillos, D. Montero-Zambrano, A. Loganathan, B. Boesl and A. Agarwal, Polym. Compos., 2019, 40, 379–388 CrossRef CAS.
- Y. Shen, H. Tang, X. Huang, R. Hang, X. Zhang, Y. Wang and X. Yao, Carbohydr. Polym., 2020, 235, 115970 CrossRef CAS PubMed.
- O. Guillaume, M. A. Geven, C. M. Sprecher, V. A. Stadelmann, D. W. Grijpma, T. T. Tang, L. Qin, Y. Lai, M. Alini, J. D. de Bruijn, H. Yuan, R. G. Richards and D. Eglin, Acta Biomater., 2017, 54, 386–398 CrossRef CAS PubMed.
- F. D. Cojocaru, V. Balan, C.-E. Tanase, I. M. Popa, M. Butnaru, O. Bredetean, M. Mares, V. Nastasa, S. Pasca and L. Verestiuc, Ceram. Int., 2021, 47, 11209–11219 CrossRef CAS.
- D. Mondal, Z. Haghpanah, C. J. Huxman, S. Tanter, D. Sun, M. Gorbet and T. L. Willett, Mater. Sci. Eng., C, 2021, 130, 112456 CrossRef CAS PubMed.
- F. Chen, Y.-R. Wu, J.-M. Wu, H. Zhu, S. Chen, S.-B. Hua, Z.-X. He, C.-Y. Liu, J. Xiao and Y.-S. Shi, Addit. Manuf., 2021, 44, 102055 CAS.
- F. Baino, G. Magnaterra, E. Fiume, A. Schiavi, L.-P. Tofan, M. Schwentenwein and E. Verné, J. Am. Ceram. Soc., 2022, 105, 1648–1657 CrossRef CAS.
- Q. Chen, B. Zou, Q. Lai and K. Zhu, Ceram. Int., 2022, 48, 30917–30926 CrossRef CAS.
- Y. Wang, S. Chen, H. Liang, Y. Liu, J. Bai and M. Wang, Ceram. Int., 2022, 48, 27681–27692 CrossRef CAS.
- R. Z. Legeros and J. P. Legeros, in Bioceramics and their Clinical Applications, ed. T. Kokubo, Woodhead Publishing, 2008, pp. 367–394 Search PubMed.
- S. Fernando, M. McEnery and S. A. Guelcher, in Advances in Polyurethane Biomaterials, ed. S. L. Cooper and J. Guan, Woodhead Publishing, 2016, pp. 481–501 Search PubMed.
- R. Liu, L. Ma, H. Liu, B. Xu, C. Feng and R. He, Ceram. Int., 2021, 47, 28924–28931 CrossRef CAS.
- L. Wang and X. Ni, Polym. Bull., 2017, 74, 2063–2079 CrossRef CAS.
- Aprecia, The World’s First 3dp Dosage Form, https://www.aprecia.com/technology/zipdose Search PubMed.
- G. N. Abdelrasoul, B. Farkas, I. Romano, A. Diaspro and S. Beke, Mater. Sci. Eng., C, 2015, 56, 305–310 CrossRef CAS PubMed.
- N. Naseri, B. Deepa, A. P. Mathew, K. Oksman and L. Girandon, Biomacromolecules, 2016, 17, 3714–3723 CrossRef CAS PubMed.
- N. B. Palaganas, J. D. Mangadlao, A. C. C. de Leon, J. O. Palaganas, K. D. Pangilinan, Y. J. Lee and R. C. Advincula, ACS Appl. Mater. Interfaces, 2017, 9, 34314–34324 CrossRef CAS PubMed.
- ASTM D638-14, Standard Practice for Preparation of Metallographic Specimens, ASTM Int., 2016, vol. 82 iss. 1, pp. 1–15, DOI:10.1520/D0638-14.1.
- İ. Aktitiz, K. Aydın and A. Topcu, J. Mater. Eng. Perform., 2021, 30, 4975–4980 CrossRef.
- J. Guo, Y. Zeng, P. Li and J. Chen, Ceram. Int., 2019, 45, 23007–23012 CrossRef CAS.
- S. Mubarak, D. Dhamodharan, M. B. Kale, N. Divakaran, T. Senthil, P. Sathiyanathan, L. Wu and J. Wang, Nanomaterials, 2020, 10, 217 CrossRef CAS PubMed.
- C. Billings, C. Cai and Y. Liu, in ASME 2021 International Mechanical Engineering Congress and Exposition, 2021, vol. 5 Search PubMed.
- N. Vidakis, M. Petousis, E. Velidakis, N. Mountakis, D. Tsikritzis, A. Gkagkanatsiou and S. Kanellopoulou, Biomimetics, 2022, 7, 8 CrossRef CAS PubMed.
- S. H. Chiu, S. T. Wicaksono, K. T. Chen, C. Y. Chen and S. H. Pong, Rapid Prototyp. J., 2015, 21, 262–269 CrossRef.
- H. Eng, S. Maleksaeedi, S. Yu, Y. Y. C. Choong, F. E. Wiria, R. E. Kheng, J. Wei, P. C. Su and H. P. Tham, Rapid Prototyp. J., 2017, 23, 129–136 CrossRef.
- R. Mitkus, M. Scharnofske and M. Sinapius, Polym, 2021, 13, 3948 CAS.
- S. Kumar, M. Hofmann, B. Steinmann, E. J. Foster and C. Weder, ACS Appl. Mater. Interfaces, 2012, 4, 5399–5407 CrossRef CAS PubMed.
- A. S. de León, M. de la Mata, F. J. Delgado and S. I. Molina, Macromol. Mater. Eng., 2022, 307, 2100784 CrossRef.
- S. M. Lim, B. S. Shin and K. Kim, J. Nanosci. Nanotechnol., 2017, 17, 5492–5495 CrossRef CAS.
- F. Ibrahim, D. Mohan, M. S. Sajab, S. B. Bakarudin and H. Kaco, Polym, 2019, 11, 1544 CAS.
- H. Korhonen, L. H. Sinh, N. D. Luong, P. Lehtinen, T. Verho, J. Partanen and J. Seppälä, Phys. Status Solidi, 2016, 213, 982–985 CrossRef CAS.
- J. Z. Manapat, J. D. Mangadlao, B. D. B. Tiu, G. C. Tritchler and R. C. Advincula, ACS Appl. Mater. Interfaces, 2017, 9, 10085–10093 CrossRef CAS PubMed.
- A. S. De León and S. I. Molina, Polymers, 2020, 12, 1103 CrossRef PubMed.
- S. Xu, N. Girouard, G. Schueneman, M. L. Shofner and J. C. Meredith, Polymer, 2013, 54, 6589–6598 CrossRef CAS.
- A. Chiappone, I. Roppolo, E. Naretto, E. Fantino, F. Calignano, M. Sangermano and F. Pirri, Composites, Part B, 2017, 124, 9–15 CrossRef CAS.
- B. Wang, J. Liu, K. Chen, Y. Wang and Z. Shao, Polym. Eng. Sci., 2020, 60, 782–792 CrossRef CAS.
- J. Li, L. Wang, L. Dai, L. Zhong, B. Liu, J. Ren and Y. Xu, J. Mater. Sci., 2018, 53, 1874–1886 CrossRef CAS.
- J. Bennett, Addit. Manuf., 2017, 18, 203–212 CAS.
- Z. Zguris, How Mechanical Properties of Stereolithography 3D Prints are Affected by UV Curing, Formlabs White Pap., 2016 Search PubMed.
- M. Mokhtarnejad, E. L. Ribeiro, D. Mukherjee and B. Khomami, RSC Adv., 2022, 12, 17321–17329 RSC.
- R. Yu, X. Yang, Y. Zhang, X. Zhao, X. Wu, T. Zhao, Y. Zhao and W. Huang, ACS Appl. Mater. Interfaces, 2017, 9, 1820–1829 CrossRef CAS PubMed.
- A. Kundu, C. Nattoo, S. Fremgen, S. Springer, T. Ausaf and S. Rajaraman, RSC Adv., 2019, 9, 8949–8963 RSC.
- Y. Han, F. Wang, H. Wang, X. Jiao and D. Chen, Compos. Sci. Technol., 2018, 154, 104–109 CrossRef CAS.
- K. Niendorf and B. Raeymaekers, Composites, Part B, 2021, 223, 109096 CrossRef CAS.
- D. D. Lim, J. Lee, J. Park and W. Choi, Carbon, 2022, 194, 1–9 CrossRef CAS.
- H. Younes, X. Kuang, D. Lou, B. DeVries, M. M. Rahman and H. Hong, Mater. Res. Bull., 2022, 154, 111938 CrossRef CAS.
- M. M. Hanon, A. Ghaly, L. Zsidai and S. Klébert, Mater. Des., 2022, 218, 110718 CrossRef CAS.
- Q. Wang, X. Liu, Z. Qiang, Z. Hu, X. Cui, H. Wei, J. Hu, Y. Xia, S. Huang, J. Zhang, K. Fu and Y. Chen, Compos. Sci. Technol., 2022, 109601 CrossRef CAS.
- Z. Jiang, L. Cheng, Y. Zeng, Z. Zhang, Y. Zhao, P. Dong and J. Chen, Ceram. Int., 2022, 48, 6477–6487 CrossRef CAS.
- D. Park, Y. Kim, S. Lee and J. Kim, Synth. Met., 2021, 276, 116763 CrossRef CAS.
- T. Xiao, C. Qian, R. Yin, K. Wang, Y. Gao and F. Xuan, Adv. Mater. Technol., 2021, 6, 2000745 CrossRef CAS.
- G. Scordo, V. Bertana, L. Scaltrito, S. Ferrero, M. Cocuzza, S. L. Marasso, S. Romano, R. Sesana, F. Catania and C. F. Pirri, Mater. Today Commun., 2019, 19, 12–17 CrossRef CAS.
- C. Qian, T. Xiao, Y. Chen, N. Wang, B. Li and Y. Gao, Adv. Eng. Mater., 2022, 24, 2101068 CrossRef CAS.
- G. Gonzalez, A. Chiappone, I. Roppolo, E. Fantino, V. Bertana, F. Perrucci, L. Scaltrito, F. Pirri and M. Sangermano, Polymer, 2017, 109, 246–253 CrossRef CAS.
- Y. Zuo, Z. Yao, H. Lin, J. Zhou, J. Lu and J. Ding, Composites, Part B, 2019, 179, 107533 CrossRef CAS.
- S. Safaee and R. Chen, Procedia Manuf., 2019, 34, 731–737 CrossRef.
- A. Cortés, X. F. Sánchez-Romate, A. Jiménez-Suárez, M. Campo, A. Ureña and S. G. Prolongo, Polymers, 2020, 12, 975 CrossRef PubMed.
- Y. Yang, Z. Chen, X. Song, B. Zhu, T. Hsiai, P.-I. Wu, R. Xiong, J. Shi, Y. Chen, Q. Zhou and K. K. Shung, Nano Energy, 2016, 22, 414–421 CrossRef CAS.
- L. Pezzana, G. Riccucci, S. Spriano, D. Battegazzore, M. Sangermano and A. Chiappone, Nanomaterials, 2021, 11, 373 CrossRef CAS PubMed.
- B. Nagarajan, P. Mertiny and A. J. Qureshi, Mater. Today Commun., 2020, 25, 101520 CrossRef CAS.
- R. Momper, A. I. Landeta, L. Yang, H. Halim, H. Therien-Aubin, E. Bodenschatz, K. Landfester and A. Riedinger, ACS Appl. Mater. Interfaces, 2020, 12, 50834–50843 CrossRef CAS PubMed.
- G. Hu, Z. Cao, M. Hopkins, J. G. Lyons, M. Brennan-Fournet and D. M. Devine, Procedia Manuf., 2019, 38, 1236–1243 CrossRef.
- İ. Aktitiz, R. Varol, N. Akkurt and M. F. Saraç, Polym. Test., 2020, 90, 106724 CrossRef.
| This journal is © The Royal Society of Chemistry 2023 |


