 Open Access Article
Creative Commons Attribution 3.0 Unported Licence
Evaluation of a biosensor-based graphene oxide-DNA nanohybrid for lung cancer
Mustafa M. Kadhima,
Ahmed Mahdi Rheimab,
Zainab S. Abbasc,
Haider Hussain Jloodd,
Safa K. Hachimef,
Wesam R. Kadhumg and
Ehsan kianfar *hijk
*hijk
aMedical Laboratory Techniques Department, Al-Farahidi University, Baghdad 10022, Iraq
bDepartment of Chemistry, College of Science, Mustansiriyah University, Baghdad, Iraq
cResearch Center, The University of Mashreq, 10021, Baghdad, Iraq
dPharmacy Department, Mazaya University College, Thi-Qar, Iraq
eCollege of Technical Engineering, The Islamic University, Najaf, Iraq
fMedical Laboratory Techniques Department, Al-Turath University College, Iraq, Baghdad
gDepartment of Pharmacy, Kut University College, Kut 52001, Wasit, Iraq
hIstanbul Medeniyet University, Istanbul, Turkey. E-mail: ehsan_kianfar2010@yahoo.com; Tel: +90 917-744-1049
iDepartment of Chemical Engineering, Islamic Azad University, Arak Branch, Arak, Iran
jYoung Researchers and Elite Club, Islamic Azad University, Gachsaran Branch, Gachsaran, Iran
kDepartment of Chemistry, Islamic Azad University, Sousangerd Branch, Sousangerd, Iran
First published on 17th January 2023
Abstract
Lung cancer is nowadays among the most prevalent diseases worldwide and features the highest mortality rate among various cancers, indicating that early diagnosis of the disease is of paramount importance. Given that the conventional methods of cancer detection are expensive and time-consuming, special attention has been paid to the provision of less expensive and faster techniques. In recent years, the dramatic advances in nanotechnology and the development of various nanomaterials have led to activities in this context. Recent studies indicate that the graphene oxide (GO) nanomaterial has high potential in the design of nano biosensors for lung cancer detection owing to its unique properties. In the current article, a nano biosensor based on a DNA-GO nanohybrid is introduced to detect deletion mutations causing lung cancer. In this method, mutations were detected using a FAM-labeled DNA probe with fluorescence spectrometry. GO was synthesized according to Hummers' method and examined and confirmed using Fourier Transform Infrared (FT-IR) Spectrometry and UV-vis spectrometry methods and Transmission Electron Microscopy (TEM) images.
1. Introduction
Cancer is a genetic disease that results from the uncontrolled growth and division of cells in a part of the body that results from environmental factors and genetic disorders.1–5 In other words, cancer occurs as a result of a series of mutations in human genes.6–10 There are more than 200 types of cancer today, one of the most common of which is lung cancer.11–15Lung cancer is the second most common cancer in men and women and is one of the most preventable cancers. There are generally two types of lung cancer:16–21
(1) Small cell lung cancer (SCLC)
(2) Non-small cell lung cancer (NSCLC)
How both grow and spread in the body and how to treat them are different. Lung cancers are classified under the microscope based on the appearance of the cells. Non-small cell lung cancer (NSCLC) is also divided into three categories:22–25
(1) Superficial tissue cancer, (2) mucosal and lymph node carcinoma (glandular epithelium), and (3) large cell lung cancer.26–30 Among people with this type of cancer, about 85–90% of cases are NSCLC and about 10–15% of cases are SCLC.
The most common clinical symptoms of lung cancer include persistent and chronic cough, chest pain, anorexia, weight loss, sputum, shortness of breath, respiratory infections such as bronchitis, the onset of wheezing and … is, which usually does not appear in the early stages of the disease. Therefore, the mortality rate of this type of cancer is very high.31–34 The most prevalent symptoms of lung cancer include continuous and chronic cough, thoracic pain, anorexia, weight loss, hemoptysis, dyspnea, and respiratory infections such as bronchitis, the onset of wheezing, etc., which do not typically appear in the early stages of the disease, leading to a high mortality rate in this type of cancer.35–38
In the field of medicine, lung cancer has so far been detected using various methods, including chest radiography (x-ray), computed tomography (CT) scan, magnetic resonance imaging (MRI), bone scan, bronchoscopy, and sputum cytology.39–43 In recent years, the dramatic advances in nanotechnology and the development of various nanomaterials have facilitated the detection of cancer biomarkers with high accuracy and sensitivity.44–47 Nanotechnology has provided faster, less expensive, and easier methods with lower detection limits for lung cancer detection. Nanomaterials used in these methods include silica nanowires, gold nanoparticles, carbon nanotubes, quantum dots, magnetic nanoparticles, etc.48–52,102–106
Biomarkers are an indicator of the disease biological condition that are used to detect the disease. These biomarkers are also used to study cellular processes and to recognize and control cessation, or changes in the cellular processes of cancer cells.53–57,107–111 Biomarkers can be proteins, mutated DNA, RNA, lipids, carbohydrates, and small molecules resulting from cellular metabolism.58–60,112–118 Table 1 exemplifies some of these biomarkers.14
| Biomarker | Type of cancer |
|---|---|
| PSA, PSMA | Prostate |
| CEA, NSE | Lung |
| CA 19-9, BTA | Pancreas |
| NMP22, BTA | Bladder |
| CA 15-3, 27, 29, Her-2/neu | Breasts |
2. Materials and experimental
Materials and solvents used in this work along with the manufacturers' names were graphite powder (Merck), 10% hydrochloric acid (Merck), P2O5 (Merck), potassium chloride (AppliChem), potassium persulfate (Merck), concentrated sulfuric acid (Merck), magnesium chloride (Scharlau), sodium chloride (Scharlau), Tris (hydroxymethyl) aminomethane (Merck), 30% hydrogen peroxide (Merck), potassium permanganate (Dr Mojallali Chemical Laboratories), distilled water, and sterile water. Table 2 represents the nucleotide sequences of the oligonucleotides (Takapouzist Co.) including DNA probes, target DNA, and mDNA.61–63| Oligonucleotide | Sequence |
|---|---|
| a (A) Adenine, (T) thymine, (C) cytosine, (G) guanine. | |
| DNA probe | 5′-FAM-CCTGTTGCTTCTCTTAATTCC–NH2–3′ |
| Target DNA | 5′-GGAATTAAGAGAAGCAACAGG-3′ |
| mDNA (mismatched DNA) | CCATCATAGTGTCCTCCTGAACC-3′-5′ |
In the present work, transmission electron microscopic (TEM) images were prepared with a it should be performed JEOL JEM 2010Fas device (at 200 kV). The UV-vis and the IR KBr pellet spectra were respectively obtained using Shimadzu 1800 and PerkinElmer Spectrum Version 10.4.00 and Jasco Fp-750 spectrometers. Fluorescence spectra were determined with a Jasco Fp (Table 3).
| Device | Manufacturer |
|---|---|
| 5810 R centrifuge | Eppendorf |
| pH meter | Metrohm |
| Sampler | Transferpette |
2.1. Preparation of the Tris–HCl buffer
Tris(hydroxymethyl)amino methane (0.242 g) was first dissolved in an Erlenemayer containing 100 ml of sterile water, and the solution pH was made to 7.4 using HCl (with a pH meter). Then, the Tris–HCl buffer was obtained with adding 0.5844 g of sodium chloride, 0.0373 g of potassium chloride, and 0.102 g of magnesium chloride to this solution.64–682.2. Synthesis of GO
To synthesize GO with Hummer's method, 0.5 g P2O5, 0.5 g potassium persulfate, and 0.5 g graphite powder were poured into a beaker containing concentrated H2SO4 and incubated at 80 °C for 6 h. The solution was then diluted with 50 ml distilled water and filtered afterward. The filter paper content was washed with 50 ml distilled water and fully dried at the ambient temperature overnight. Then, 0.25 g of the resulting powder was poured into a beaker containing 11.5 ml of concentrated H2SO4 in an ice bath, followed with adding 1.5 g of KMnO4 while stirring continuously. Sodium nitrate was added after 15 min and stirred at 35 °C for 2 h. Next, 25 ml of distilled water was added to the reaction solution and stirred for 15 min. The reaction was stopped with adding 75 ml of distilled water and 2 ml of H2O2 (30%), yielding a yellow solution. This solution was centrifuged and the obtained pellet was washed with HCL (10%) and then with distilled water several times to completely remove the existing acids and metal ions.69,70,101 The graphite oxide solution was ultrasonicated for 10 min and then centrifuged at 1000 rpm for 10 min, which was repeated several times to obtain the GO solution.2.3. Preparation of solutions for the fluorescence spectrum measurement
The fluorescence spectra were drawn in six steps, namely (1) drawing the DNA probe fluorescence spectrum, (2) Optimizing DNA probe adsorption time on the GO surface, (3) optimizing the GO dose in the presence of the DNA probe, (4) optimizing the target DNA hybridization time with the DNA probe in the presence of GO, (5) drawing the fluorescence spectrum of the DNA-GO probe complex at different concentrations of target DNA, and (6) drawing the fluorescence spectrum of GO-DNA probe in the presence of mDNA. The fluorescence intensities of the solutions were measured in all the above-mentioned steps with an excitation wavelength of 485 nm.71–733. Results and discussion
3.1. Preparation of GO from graphite
GO was synthesized using graphite powder in the presence of concentrated H2SO4, NaNO3, and KMnO4 according to the Hummers' method (Fig. 1).483.2. Examination of the GO UV-vis spectrum
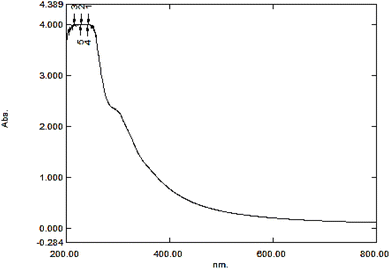
The structure of the GO synthesized with the Hummers' method was examined and confirmed using the GO absorption UV-vis spectrum (Fig. 2), which corresponds to those reported in previous studies. The strong and weak bands appearing in 230 and 300 nm wavelengths are respectively attributed to π–π* and n–π* transitions of carbonyl groups.49,503.3. Interpretation of the GO IR spectrum
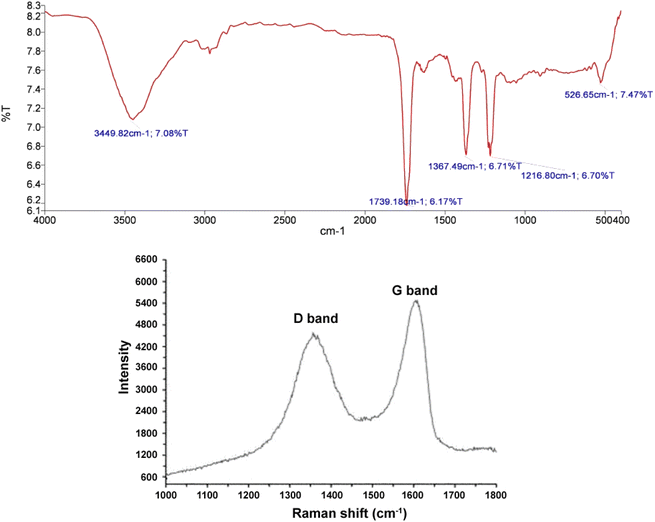
The absorption band observed in the 3449 cm−1 region belongs to OH stretching vibrations. The weak absorption bands in 2867 and 2927 cm−1 regions are related to the CH of aldehyde groups. The absorption bands appearing in 1633 and 1065 cm−1 regions correspond to C![[double bond, length as m-dash]](https://www.rsc.org/images/entities/char_e001.gif) C and C–O stretching vibrations, respectively. The absorption band emerged in the 875 cm−1 region belongs to CHAr out-of-plane bending vibrations.91–93 Since the absorption band of the acidic C
C and C–O stretching vibrations, respectively. The absorption band emerged in the 875 cm−1 region belongs to CHAr out-of-plane bending vibrations.91–93 Since the absorption band of the acidic C![[double bond, length as m-dash]](https://www.rsc.org/images/entities/char_e001.gif) O group is not observed in the 1730 cm−1 region, the synthesized graphene oxide contains lower carboxylic acid groups and possesses mostly alcoholic and aldehyde groups(Fig. 3). Furthermore, Fig. 3(a) illustrates the Raman spectum of graphene oxide includes D and G peaks where the D peak at ∼1350 (cm−1) is the result of defects in the Graphene sheets and the G peak at ∼1600 (cm−1) is the result of bond stretching of sp2 hybridized Carbons, respectively.56,57
O group is not observed in the 1730 cm−1 region, the synthesized graphene oxide contains lower carboxylic acid groups and possesses mostly alcoholic and aldehyde groups(Fig. 3). Furthermore, Fig. 3(a) illustrates the Raman spectum of graphene oxide includes D and G peaks where the D peak at ∼1350 (cm−1) is the result of defects in the Graphene sheets and the G peak at ∼1600 (cm−1) is the result of bond stretching of sp2 hybridized Carbons, respectively.56,57
3.4. Examination of the GO TEM image
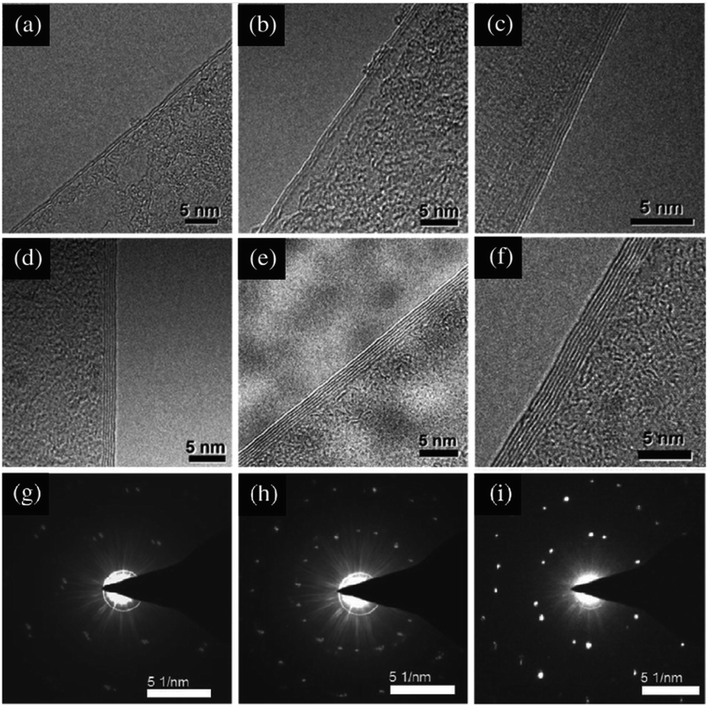
Sample preparation methods TEM can be divided into two general categories. The first category are methods that include reducing the thickness of the sample by chemical or mechanical methods until a thin sample remains. The second category are methods that involve cutting the sample along the crystal planes to obtain a very thin section of the sample.The structure of the synthesized GO was confirmed using the TEM image (Fig. 4), showing the GO layered structure.94 In addition, 2–7 graphene layers can be clearly seen in the TEM micrographs in Fig. 4(a)–(f). The SAED patterns shown in Fig. 4(g)–(i) are irregular, and the bilayer graphene, trilayer graphene and five-layer graphene films cannot be justified based on these patterns. Thus, other characterizations, such as Raman spectroscopy, are crucial to support the TEM results.
3.5. Selection of lung cancer biomarker
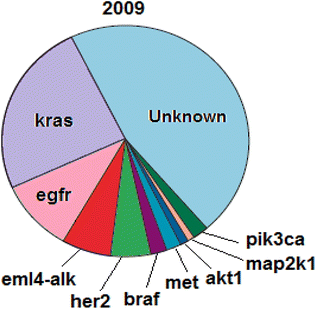
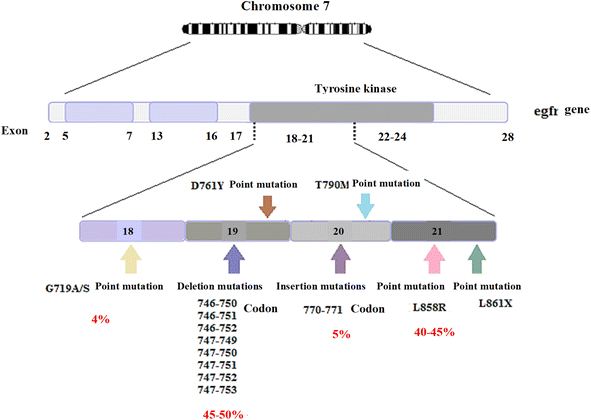
As one of the most prevalent cancer types worldwide, lung cancer is detected using various biomarkers, including exhaled air volatile organic compounds (VOCs), carcinogenic embryonic antigen (CEA), neuron-specific enolase (NSE), progastrin-releasing peptide (Pro GRP), cytokeratin-19 fragments (Cyfra21-1), squamous cell carcinoma antigen (SCCA), some miRNAs (e.g., miR-155, miR-197, and miR-182), and some genes such as egfr, kras, etc. In addition to disease detection, some of these biomarkers are useful for examining disease progression, patients' response to treatment, and post-treatment disease recurrence.51–53 According to previous studies, lung cancer patients are prone to numerous gene mutations, a few of which are common among most patients. These common mutations include mutations in codons 12 and 13 of the kras gene, mutations in exons 21-18 of the egfr gene, mutations in exon 20 of the her2 gene, etc. William Pao and Nicolas Girard have recently investigated biomarkers genes typically present in NSCLC and introduced mutations in kras and egfr genes as respectively the most frequent mutations in patients with NSCLC, among other identified factors. The biomarker genes typically present in NSCLC (2009) are listed in Fig. 5.54,95–97The egfr is an oncogene consisting of 28 exons with a length of 188 kbp. The frequent mutations in this gene include deletion, insertion, and point mutations, mainly located in the first four exons of the tyrosine kinase site. Some of these mutations include exon 19 deletion mutations including codons 746–753 (different codons are involved in deletion mutations in various patients; they include codons 746–750 in some patients and codons 747–752 in others). Besides, the L858R point mutation in exon 21, in which leucine is converted into arginine in codon 858, insertion mutations in exon 20, involving codons 770–771, and the G719 point mutation in exon 18, in which glycine is converted into serine, alanine, or cysteine in codon 719 are other examples of such mutations. Exon 19 deletion mutations and exon 21 L858R point mutation account for almost 90% of mutations in the egfr gene; in most cases, deletion mutations are more frequent than the L858R point mutation. Fig. 6 illustrates the frequencies of other mutations.55–58
NSCLC accounts for over 80% of lung cancer cases, and mutations in the egfr gene are highly frequent among gene mutations of the lung cancer cause. Among the mutations of this gene, exon 19 deletion mutations account for a high percentage. In this study, therefore, deletion mutations in exon 19 of the egfr gene (including codons 746–752) were selected as lung cancer biomarkers.
3.6. Interpretation of emission spectra
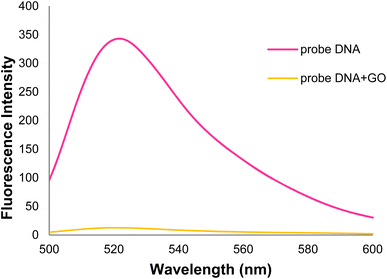
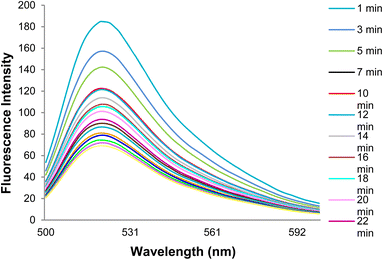
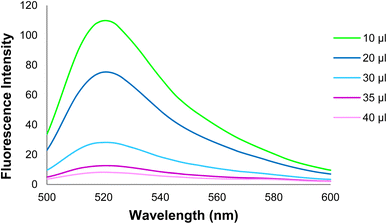
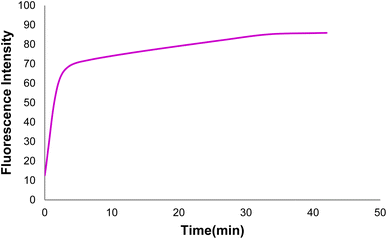
Fig. 9 shows changes in the DNA probe fluorescence intensity in the presence of GO at different times. An optimal time of 32 min was obtained for the DNA probe adsorption on the GO surface.
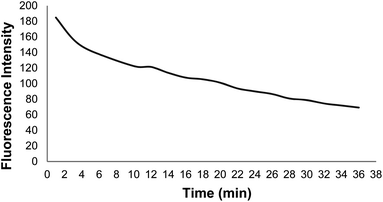
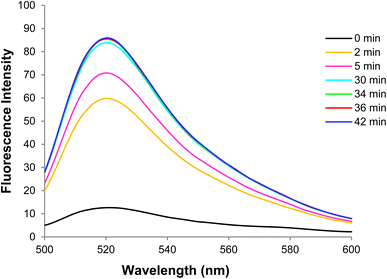
The optimal hybridization time of target (healthy) DNA and the DNA probe was determined at 34 min with drawing the curve of changes in the GO-DNA probe fluorescence intensity in the presence of target DNA at different times (Fig. 14).
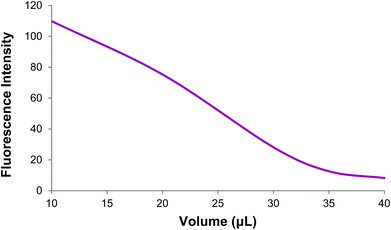
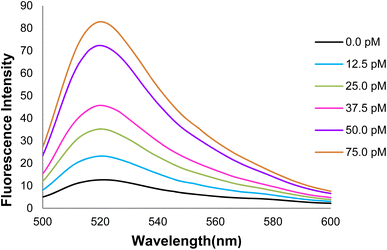
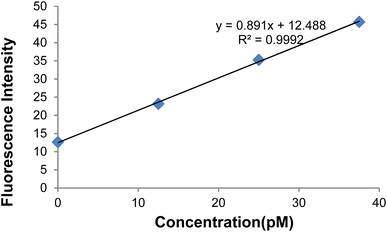
Fig. 17 depicts the curve of changes in the GO-DNA probe fluorescence emission at different concentrations of target DNA (0–40 pmol). According to Fig. 16 and 17, this method can be used to determine the concentrations of target DNA (from 0 to 40 pmol) in unknown samples.
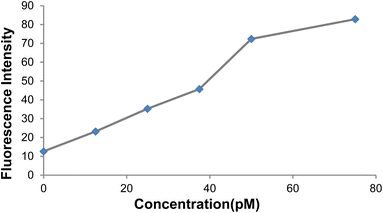 | ||
| Fig. 16 Changes in the GO-DNA probe fluorescence intensity at different concentrations of target DNA. | ||
3.7. Lung cancer detection
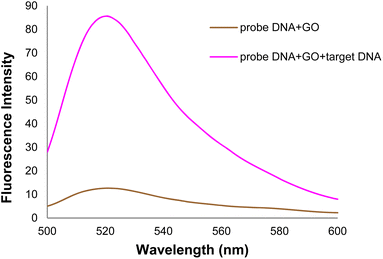
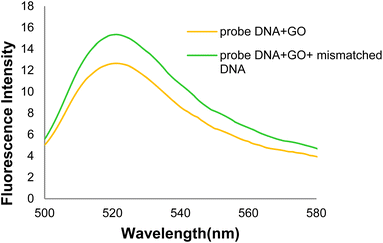
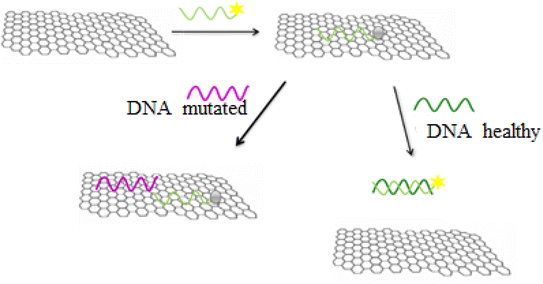
In the general procedure of lung cancer detection using the nanobiosensor (Fig. 19), the DNA probe is adsorbed on the GO surface, and the fluorescence intensity increases with adding target (healthy) DNA. However, the fluorescence intensity shows no changes with adding (mutated) mDNA. In other words, the designed nanobiosensor responds differently to the two (healthy and mutated) DNAs, making it possible to detect mDNA (in cancer patients).Fig. 20 shows the GO-DNA probe fluorescence spectra, indicating the different DNA probe fluorescence intensity in the presence of two (healthy and mutated) DNAs. Accordingly, the incidence of deletion mutations in codons 746–752 of the egfr gene as the lung cancer biomarker is examined and detected in the DNA of interest.
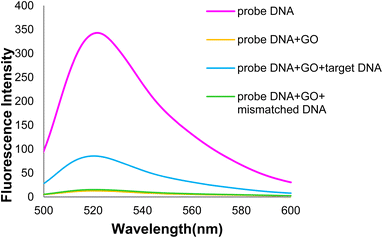 | ||
| Fig. 20 Comparison of GO-DNA probe fluorescence intensity in the presence of two (healthy and mutated) DNAs. | ||
4. Conclusion and outlook
1. Since graphene oxide (GO) is readily available and exhibits exceptional optical, electrical, mechanical and chemical properties, it has attracted increasing interests for use in GO-DNA based sensors. In solution, graphene oxide is as an excellent acceptor of fluorescence resonance energy transfer (FRET) to quench the fluorescence in dye labeled DNA sequences. The application of the electrochemical GO-DNA based sensors is also summarized because graphene oxide possesses exceptional electrochemical properties. GO-DNA based sensors perform well at low cost, and high sensitivity, and provide low detection limits. Additionally, GO-DNA based sensors should appear in the near future as scientists explore their usefulness and properties. Finally, future perspectives and possible challenges in this area are outlined. The results of these recent research studies exhibit the outstanding performance of graphene oxide compared with current techniques. However, some challenges related to DNA sensors-based graphene oxide remain and need to be resolved. Because ssDNA is adsorbed on the surface of graphene oxide, not all dsDNA can detach from the surface of graphene oxide after the complementary ssDNA, protein or other molecules combine to ssDNA. This hinders the further improvement of the sensitivity of reported DNA sensors based on most of the recent publications reviewed, although a few authors have reported some methods for solving this problem. Currently, most published literature reports that only one target can be detected for one DNA-based sensor using graphene oxide in the liquid phase. Graphene oxide in the solid phase was scarcely explored. If more targets can be detected with one sensor, the throughput of detection will be improved. Graphene oxide bears oxygen functional groups on its basal planes and edges. Therefore, graphene oxide in the solid phase can also be used to make devices for sensing without chemical modification on the surface of graphene oxide. The devices are made using lithography, thermal evaporation and other micro–nano related scientific technology. If one GO–DNA based sensor is like an array with different DNA elements, many targets will be detected.2. In the present research, a GO-DNA-based Nano biosensor was proposed for lung cancer detection. Graphene oxide was synthesized using the Hummers' method, and its structure was examined and confirmed using FT-IR, UV-vis, and TEM images. The adsorption of a FAM-labeled DNA probe on graphene oxide in the presence of target (healthy) DNA and (mutated) mDNA was then investigated using fluorescence spectroscopy. The different responses of the nano biosensor to healthy and mutant DNAs allowed for lung cancer detection. Relying on nanotechnology, therefore, lung cancer can be detected through fast, easy, and cost-effective methods.
Conflicts of interest
The author declare that they have no competing interests.Acknowledgements
Department of Chemical Engineering, Arak Branch, Islamic Azad University, Arak, Iran. Young Researchers and Elite Club, Gachsaran Branch, Islamic Azad University, Gachsaran, Iran.References
- A. J. Alberg, M. V. Brock and J. M. Samet, Epidemiology of lung cancer: looking to the future, J. Clin. Oncol., 2005, 23, 3175–3185 CrossRef PubMed.
- S. Y. Luo and D. C. Lam, Oncogenic driver mutations in lung cancer, Transl. Respir. Med., 2013, 1, 6–13 CrossRef PubMed.
- F. Taher, N. Werghi, H. Al-Ahmad and C. Donner, Extraction and Segmentation of Sputum Cells for Lung Cancer Early Diagnosis, J. Algorithms, 2013, 6, 512–531 CrossRef.
- G. S. Wright and M. E. Gruidl, Early detection and prevention of lung cancer, Curr. Opin. Oncol., 2000, 12, 143–148 CrossRef.
- W. Lai and W. Wong, Use of graphene-based materials as carriers of bioactive agents, Asian J. Pharm. Sci., 2021, 16(5), 577–588, DOI:10.1016/j.ajps.2020.11.004.
- T. K. Sethi, M. N. El-Ghamry and G. H. Kloecker, Radon and lung cancer, Clin. Adv. Hematol. Oncol., 2012, 10, 157–164 Search PubMed.
- R. Hubaux, D. D. Becker-Santos, K. S. Enfield, S. Lam, W. L. Lam and V. D. Martinez, Arsenic, asbestos and radon: emerging players in lung tumorigenesis, J. Environ. Health, 2012, 11, 89–100 CrossRef.
- S. Sun, H. Liu, Y. Hu, Y. Wang, M. Zhao, Y. Yuan and J. Su, Selection and identification of a novel ssDNA aptamer targeting human skeletal muscle, Bioact. Mater., 2023, 20, 166–178, DOI:10.1016/j.bioactmat.2022.05.016.
- G. Ellison, G. Zhu, A. Moulis, S. Dearden, G. Speake and R. M. Cormack, EGFR mutation testing in lung cancer: a review of available methods and their use for analysis of tumour tissue and cytology samples, J. Clin. Pathol., 2013, 66, 79–89 CrossRef CAS.
- C. E. Kim, K. M. Tchou-Wong and W. N. Rom, Sputum-Based Molecular Biomarkers for the Early Detection of Lung Cancer: Limitations and Promise, Cancers, 2011, 3, 2975–2989 CrossRef PubMed.
- W. A. Wahab and A. N. Adzmi, The Investigation of Cytotoxic Effect of Cinnamomum Zeylanicum Extracts on Human Breast Cancer Cell Line (Mcf-7), Sci. Herit. J., 2017, 1(2), 21–26 Search PubMed.
- D. Hayes, H. Secrist, C. Bangur, T. Wang, X. Zhang, D. Harlan, G. Goodman, R. Houghton, D. Persing and B. Zehentner, Multigene real-time PCR detection of circulating tumor cells in peripheral blood of lung cancer patients, Anticancer Res., 2006, 26, 1567–1576 CAS.
- M. S. Bumidin, F. A. Johari, N. F. Risan and M. H. M. Nasir, The Effect Of Aqueous Extracts Of Nigella Sativa On Breast Cancer Cell Line Mcf-7: An In Vitro Study, Sci. Herit. J., 2018, 2(1), 13–17 CrossRef.
- Y. E. Choi, J. W. Kwak and J. W. Park, Nanotechnology for early cancer detection, Sensors, 2010, 10, 428–455 CrossRef CAS PubMed.
- S. Nie, Y. Xing, G. J. Kim and J. W. Simons, Nanotechnology applications in cancer, Annu. Rev. Biomed. Eng., 2007, 9, 257–288 CrossRef CAS.
- Z. L. Wang, R. P. Gao, Z. W. Pan and Z. R. Dai, Nano-scale mechanics of nanotubes, nanowires, and nanobelts, Adv. Eng. Mater., 2001, 3, 657–661 CrossRef CAS.
- P. K. Sekhar, N. S. Ramgir, R. K. Joshi and S. Bhansali, Selective growth of silica nanowires using an Au catalyst for optical recognition of interleukin-10, Nanotechnology, 2008, 19, 5502–5508 CrossRef.
- N. S. Ramgir, A. Zajac, P. K. Sekhar, L. Lee, T. A. Zhukov and S. Bhansali, Voltammetric detection of cancer biomarkers exemplified by interleukin-10 and osteopontin with silica nanowires, J. Phys. Chem. C, 2007, 111, 13981–13987 CrossRef CAS.
- G. Peng, M. Hakim, Y. Y. Broza, S. Billan, R. Abdah-Bortnyak, A. Kuten, U. Tisch and H. Haick, Detection of lung, breast, colorectal, and prostate cancers from exhaled breath using a single array of nanosensors, Br. J. Cancer, 2010, 103, 542–551 CrossRef CAS PubMed.
- G. Peng, U. Tisch, O. Adams, M. Hakim, N. Shehada, Y. Y. Broza, S. Billan, R. Abdah-Bortnyak, A. Kuten and H. Haick, Diagnosing lung cancer in exhaled breath using gold nanoparticles, Nat. Nanotechnol., 2009, 4, 669–673 CrossRef CAS PubMed.
- https://what-when-how.com/nanoscience-and-nanotechnology/functionalization-of nanotube-surfaces-part-1-nanotechnology/.
- L. Zhang, D. Lv, W. Su, Y. Liu, Y. Chen and R. Xiang, Detection of cancer biomarker with nanotechnology, Am. J. Biochem. Biotechnol., 2013, 9, 71–89 CrossRef CAS.
- S. r. Ji, C. Liu, B. Zhang, F. Yang, J. Xu, J. Long, C. Jin, D. l. Fu, Q. x. Ni and X. j. Yu, Carbon nanotubes in cancer diagnosis and therapy, Biochim. Biophys. Acta, Rev. Cancer, 2010, 1806, 29–35 CrossRef CAS.
- N. Sinha and J. T. Yeow, Carbon nanotubes for biomedical applications, IEEE Trans Nanobioscience, 2005, 4, 180–195 CrossRef PubMed.
- R. M. Reilly, Carbon nanotubes: potential benefits and risks of nanotechnology in nuclear medicine, J. Nucl. Med., 2007, 48, 1039–1042 CrossRef PubMed.
- W. Yang, P. Thordarson, J. J. Gooding, S. P. Ringer and F. Braet, Carbon nanotubes for biological and biomedical applications, Nanotechnology, 2007, 18, 412–420 Search PubMed.
- F. Liu, P. Xiao, H. Fang, H. Dai, L. Qiao and Y. Zhang, Single-walled carbon nanotube-based biosensors for the detection of volatile organic compounds of lung cancer, Phys. E, 2011, 44, 367–372 CrossRef.
- J. Drbohlavova, V. Adam, R. Kizek and J. Hubalek, Quantum dots—characterization, preparation and usage in biological systems, Int. J. Mol. Sci., 2009, 10, 656–673 CrossRef PubMed.
- H. Zhang, D. Yee and C. Wang, Quantum dots for cancer diagnosis and therapy: biological and clinical perspectives, Nanomedicine, 2008, 3, 83–91 CrossRef PubMed.
- M. Hu, J. Yan, Y. He, H. Lu, L. Weng, S. Song, C. Fan and L. Wang, Ultrasensitive, multiplexed detection of cancer biomarkers directly in serum by using a quantum dot-based microfluidic protein chip, ACS Nano, 2009, 4, 488–494 CrossRef PubMed.
- I. L. Medintz, H. T. Uyeda, E. R. Goldman and H. Mattoussi, Quantum dot bioconjugates for imaging, labelling and sensing, Nat. Mater., 2005, 4, 435–446 CrossRef PubMed.
- G. Jie, L. Wang and S. Zhang, Magnetic electrochemiluminescent Fe3O4/CdSe–CdS nanoparticle/polyelectrolyte nanocomposite for highly efficient immunosensing of a cancer biomarker, Chem. – Eur. J., 2011, 17, 641–648 CrossRef PubMed.
- M. Pumera, A. Ambrosi, A. Bonanni, E. K. Chng and H. L. Poh, Graphene for electrochemical sensing and biosensing, TrAC, Trends Anal. Chem., 2010, 29, 954–965 CrossRef.
- W. Choi, I. Lahiri, R. Seelaboyina and Y. S. Kang, Synthesis of graphene and its applications: a review, Crit. Rev. Solid State Sci., 2010, 35, 52–71 CrossRef.
- M. I. Katsnelson, Graphene: carbon in two dimensions, Mater. Today, 2007, 10, 20–27 CrossRef.
- M. Taghioskoui, Trends in graphene research, Mater. Today, 2009, 12, 34–37 CrossRef.
- G. Gonçalves, M. Vila, M. T. Portolés, M. Vallet-Regi, J. Gracio and P. A. Marques, Nano-Graphene Oxide: A Potential Multifunctional Platform for Cancer Therapy, Adv. Healthcare Mater., 2013, 2, 1072–1090 CrossRef PubMed.
- S. Park and R. S. Ruoff, Chemical methods for the production of graphenes, Nat. Nanotechnol., 2009, 4, 217–224 CrossRef CAS PubMed.
- D. C. Marcano, D. V. Kosynkin, J. M. Berlin, A. Sinitskii, Z. Sun, A. Slesarev, L. B. Alemany, W. Lu and J. M. Tour, Improved synthesis of graphene oxide, ACS Nano, 2010, 4, 4806–4814 CrossRef CAS PubMed.
- X. He, Y. Zhu, L. Yang, Z. Wang, Z. Wang, J. Feng, X. Wen, L. Cheng and R. Zhu, MgFe-LDH Nanoparticles: A Promising Leukemia Inhibitory Factor Replacement for Self-Renewal and Pluripotency Maintenance in Cultured Mouse Embryonic Stem Cells, Adv. Sci., 2021, 8(9), 2003535, DOI:10.1002/advs.202003535.
- J. Paredes, S. Villar-Rodil, A. Martinez-Alonso and J. Tascon, Graphene oxide dispersions in organic solvents, Langmuir, 2008, 24, 10560–10564 CrossRef CAS.
- D. R. Dreyer, S. Park, C. W. Bielawski and R. S. Ruoff, The chemistry of graphene oxide, Chem. Soc. Rev., 2010, 39, 228–240 RSC.
- X. Zuo, S. He, D. Li, C. Peng, Q. Huang, S. Song and C. Fan, Graphene oxide-facilitated electron transfer of metalloproteins at electrode surfaces, Langmuir, 2009, 26, 1936–1939 CrossRef.
- H. Wang, Q. Zhang, X. Chu, T. Chen, J. Ge and R. Yu, Graphene Oxide–Peptide Conjugate as an Intracellular Protease Sensor for Caspase-3 Activation Imaging in Live Cells, Angew. Chem., Int. Ed., 2011, 50, 7065–7069 CrossRef CAS PubMed.
- J. H. Jung, D. S. Cheon, F. Liu, K. B. Lee and T. S. Seo, A Graphene Oxide Based Immuno-biosensor for Pathogen Detection, Angew. Chem., Int. Ed., 2010, 49, 5708–5711 CrossRef CAS.
- Q. Zhu, D. Xiang, C. Zhang, X. Ji and Z. He, Multicolour probes for sequence-specific DNA detection based on graphene oxide, Analyst, 2013, 138, 5194–5196 RSC.
- C. H. Lu, H. H. Yang, C. L. Zhu, X. Chen and G. N. Chen, A graphene platform for sensing biomolecules, Angew. Chem., Int. Ed., 2009, 121, 4879–4881 CrossRef.
- S. He, B. Song, D. Li, C. Zhu, W. Qi, Y. Wen, L. Wang, S. Song, H. Fang and C. Fan, A graphene nanoprobe for rapid, sensitive, and multicolor fluorescent DNA analysis, Adv. Funct. Mater., 2010, 20, 453–459 CrossRef CAS.
- R. Maiti, S. Manna, A. Midya and S. K. Ray, Broadband photoresponse and rectification of novel graphene oxide/n-Si heterojunctions, Opt. Express, 2013, 21, 26034–26043 CrossRef PubMed.
- P. Huang, Ch. Xu, J. Lin, C. Wang, X. Wang, Ch. Zhang, X. Zhou, Sh. Guo and D. Cui, Folic Acid-conjugated Graphene Oxide loaded with Photosensitizers for Targeting Photodynamic Therapy, Theranostics, 2011, 1, 240–250 CrossRef CAS.
- R. Molina, J. M. Auge, J. M. Escudero, R. Marrades, N. Viñolas, E. Carcereny, J. Ramirez and X. Filella, Mucins CA 125, CA 19.9, CA 15.3 and TAG-72.3 as tumor markers in patients with lung cancer: comparison with CYFRA 21-1, CEA, SCC and NSE, Tumor Biol., 2008, 29, 371–380 CrossRef CAS.
- Y. Zhang, D. Yang, L. Weng and L. Wang, Early Lung Cancer Diagnosis by Biosensors, Int. J. Mol. Sci., 2013, 14, 15479–15509 CrossRef PubMed.
- D. Zheng, S. Haddadin, Y. Wang, L. Q. Gu, M. C. Perry, C. E. Freter and M. X. Wang, Plasma microRNAs as novel biomarkers for early detection of lung cancer, Int. J. Clin. Exp. Pathol., 2011, 4, 575 CAS.
- W. Pao and N. Girard, New driver mutations in non-small-cell lung cancer, Lancet Oncol., 2011, 12, 175–180 CrossRef CAS PubMed.
- T. Kosaka, Y. Yatabe, H. Endoh, H. Kuwano, T. Takahashi and T. Mitsudomi, Mutations of the epidermal growth factor receptor gene in lung cancer biological and clinical implications, Cancer Res., 2004, 64, 8919–8923 CrossRef CAS.
- Y. Yatabe and T. Mitsudomi, Epidermal growth factor receptor mutations in lung cancers, Pathol. Int., 2007, 57, 233–244 CrossRef CAS PubMed.
- S. V. Sharma, D. W. Bell, J. Settleman and D. A. Haber, Epidermal growth factor receptor mutations in lung cancer, Nat. Rev. Cancer, 2007, 7, 169–181 CrossRef CAS PubMed.
- G. Bronte, S. Rizzo, L. La Paglia, V. Adamo, S. Siragusa, C. Ficorella, D. Santini, V. Bazan, G. Colucci and N. Gebbia, Driver mutations and differential sensitivity to targeted therapies: a new approach to the treatment of lung adenocarcinoma, Cancer Treat. Rev., 2010, 36, 21–29 CrossRef.
- Y. Jiang, J. Tian, S. Chen, Y. Zhao, Y. Wang and S. Zhao, A Graphene Oxide–Based Sensing Platform for The Label-free Assay of DNA Sequence and Exonuclease Activity via Long Range Resonance Energy Transfer, J. Fluoresc., 2013, 23, 697–703 CrossRef CAS PubMed.
- B. Liu, Z. Sun, X. Zhang and J. Liu, Mechanisms of DNA Sensing on Graphene Oxide, Anal. Chem., 2013, 85, 7987–7993 CrossRef CAS.
- L. Tang, Y. Wang, Y. Liu and J. Li, DNA-directed self-assembly of graphene oxide with applications to ultrasensitive oligonucleotide assay, ACS Nano, 2011, 5, 3817–3822 CrossRef CAS PubMed.
- F. Li, Y. Huang, Q. Yang, Z. Zhong, D. Li, L. Wang, S. Song and C. Fan, A graphene-enhanced molecular beacon for homogeneous DNA detection, Nanoscale, 2010, 2, 1021–1026 RSC.
- T. A. Tabish, S. Zhang and P. G. Winyard, Developing the next generation of graphene-based platforms for cancer therapeutics: The potential role of reactive oxygen species, Redox Biol., 2018, 15, 34–40, DOI:10.1016/j.redox.2017.11.018.
- G. Chen, I. Roy, C. Yang and P. N. Prasad, Nanochemistry and nanomedicine for nanoparticle-based diagnostics and therapy, Chem. Rev., 2016, 116, 2826–2885, DOI:10.1021/acs.chemrev.5b00148.
- G. Rajeev, B. Prieto Simon, L. F. Marsal and N. H. Voelcker, Advances in nanoporous anodic alumina-based biosensors to detect Biomarkers of clinical significance: A review, Adv. Healthcare Mater., 2018, 7 DOI:10.1002/adhm.201700904.
- H. Tang, D. Cai, T. Ren, P. Xiong, Y. Liu, H. Gu and G. Shi, Fabrication of a low background signal glucose biosensor with 3D network materials as the electrocatalyst, Anal. Biochem., 2019, 567, 63–71, DOI:10.1016/j.ab.2018.12.012.
- Y. Yang, X. Yang, Y. Yang and Q. Yuan, Aptamer-functionalized carbon nanomaterials electrochemical sensors for detecting cancer relevant biomolecules, Carbon, 2018, 129, 380–395, DOI:10.1016/j.carbon.2017.12.013.
- M. Liu, P. Y. Chen and R. H. Hurt, Graphene inks as versatile templates for printing tiled metal oxide crystalline films, Adv. Mater., 2018, 30 DOI:10.1002/adma.201705080.
- R. Geetha Bai, N. Ninan, K. Muthoosamy and S. Manickam, Graphene: A versatile platform for nanotheranostics and tissue engineering, Prog. Mater. Sci., 2018, 91, 24–69, DOI:10.1016/j.pmatsci.2017.08.004.
- M. Chen, Y. Wang, H. Su, L. Mao, X. Jiang, T. Zhang and X. Dai, Three-dimensional electrochemical DNA biosensor based on 3D graphene-Ag nanoparticles for sensitive detection of CYFRA21-1 in non-small cell lung cancer, Sens. Actuators, B, 2018, 255, 2910–2918, DOI:10.1016/j.snb.2017.09.111.
- P. Gupta, A. Bharti, N. Kaur, S. Singh and N. Prabhakar, An electrochemical aptasensor based on gold nanoparticles and graphene oxide doped poly(3,4-ethylenedioxythiophene) nanocomposite for detection of MUC1, J. Electroanal. Chem., 2018, 813, 102–108, DOI:10.1016/j.jelechem.2018.02.014.
- S. Kumar, K. S. Ashish, S. Augustine, S. Yadav, B. K. Yadav, R. P. Chauhan, A. K. Dewan and B. D. Malhotra, Effect of Brownian motion on reduced agglomeration of nanostructured metal oxide towards development of efficient cancer biosensor, Biosens. Bioelectron., 2018, 102, 247–255, DOI:10.1016/j.bios.2017.11.004.
- R. Heidari, J. Rashidiani, M. Abkar, R. A. Taheri, M. M. Moghaddam, S. A. Mirhosseini, R. Seidmoradi, M. R. Nourani, M. Mahboobi and A. H. Keihan, et al., CdS nanocrystals/graphene oxide-AuNPs based electrochemiluminescence immunosensor in sensitive quantification of a cancer biomarker, Biosens. Bioelectron., 2019, 126, 7–14, DOI:10.1016/j.bios.2018.10.031.
- R. Salahandish, A. Ghaffarinejad, E. Omidinia, H. Zargartalebi, A. K. Majidzadeh, S. M. Naghib and A. Sanati-Nezhad, Label-free ultrasensitive detection of breast cancer miRNA-21 biomarker employing electrochemical nano-genosensor based on sandwiched AgNPs in PANI and N-doped graphene, Biosens. Bioelectron., 2018, 120, 129–136, DOI:10.1016/j.bios.2018.08.025.
- H. Jia, Q. Tian, J. Xu, L. Lu, X. Ma and Y. Yu, Aerogels prepared from polymeric beta-cyclodextrin and graphene aerogels as a novel host-guest system for immobilization of antibodies: A voltammetric immunosensor for the tumor marker CA 15-3, Mikrochim. Acta, 2018, 185, 1–7 CrossRef CAS.
- A. Akbarnia and H. R. Zare, A voltammetric assay for microRNA-25 based on the use of amino-functionalized graphene quantum dots and ss- and ds-DNAs as gene probes, Microchim. Acta, 2018, 185, 1–8, DOI:10.1007/s00604-018-3037-6.
- W. Dong, Y. Ren, Z. Bai, Y. Yang, Z. Wang, C. Zhang and Q. Chen, Trimetallic AuPtPd nanocomposites platform on graphene: Applied to electrochemical detection and breast cancer diagnosis, Talanta, 2018, 189, 79–85, DOI:10.1016/j.talanta.2018.06.067.
- Y. Shoja, A. Kermanpur and F. Karimzadeh, Diagnosis of EGFR exon21 L858R point mutation as lung cancer biomarker by electrochemical DNA biosensor based on reduced graphene oxide/functionalized ordered mesoporous carbon/Ni-oxytetracycline metallopolymer nanoparticles modified pencil graphite electrode, Biosens. Bioelectron., 2018, 113, 108–115 CrossRef CAS.
- S. Yang, F. Zhang, Z. Wang and Q. Liang, A graphene oxide-based label-free electrochemical aptasensor for the detection of alpha-fetoprotein, Biosens. Bioelectron., 2018, 112, 186–192, DOI:10.1016/j.bios.2018.04.026.
- N. F. Chiu, T. L. Lin and C. T. Kuo, Highly sensitive carboxyl-graphene oxide-based surface plasmon resonance immunosensor for the detection of lung cancer for cytokeratin 19 biomarker in human plasma, Sens. Actuators, B, 2018, 265, 264–272, DOI:10.1016/j.snb.2018.03.070.
- (a) N. Pachauri, K. Dave, A. Dinda and P. R. Solanki, Cubic CeO2 implanted reduced graphene oxide-based highly sensitive biosensor for non-invasive oral cancer biomarker detection, J. Mater. Chem. B, 2018, 6, 3000–3012, 10.1039/C8TB00653A; (b) G. Nie, Y. Wang, Y. Tang, D. Zhao and Q. Guo, A graphene quantum dots based electrochemiluminescence immunosensor for carcinoembryonic antigen detection using poly(5-formylindole)/reduced graphene oxide nanocomposite, Biosens. Bioelectron., 2018, 101, 123–128, DOI:10.1016/j.bios.2017.10.021.
- S. Mansouri Majd and A. Salimi, Ultrasensitive flexible FET-type aptasensor for CA 125 cancer marker detection based on carboxylated multiwalled carbon nanotubes immobilized onto reduced graphene oxide film, Anal. Chim. Acta, 2018, 1000, 273–282, DOI:10.1016/j.aca.2017.11.008.
- H. Gu, et al., Biomarkers-based Biosensing and Bioimaging with Graphene for Cancer Diagnosis, Nanomaterials, 2019, 9, 1–130, DOI:10.3390/nano9010130.
- F. Sharifianjazi, et al. Biosensors and nanotechnology for cancer diagnosis (lung and bronchus, breast, prostate, and colon): a systematic review, Biomed. Mater., 2022, 17, 012002 CrossRef CAS.
- H. A. Alhazmi, W. Ahsan, B. Mangla, S. Javed, M. Z. Hassan, M. Asmari, M. Al Bratty and A. Najmi, Graphene-based biosensors for disease theranostics: Development, applications, and recent advancements, Nanotechnol. Rev., 2022, 11(1), 96–116, DOI:10.1515/ntrev-2022-0009.
- M. Pourmadadi, H. Soleimani Dinani, F. Saeidi Tabar, K. Khassi, S. Janfaza, N. Tasnim and M. Hoorfar, Properties and Applications of Graphene and Its Derivatives in Biosensors for Cancer Detection: A Comprehensive Review, Biosensors, 2022, 12, 269, DOI:10.3390/bios12050269.
- S. K. Krishnan, E. Singh, P. Singh, M. Meyyappan and H. S. Nalwa, A review on graphene-based nanocomposites for electrochemical and fluorescent biosensors, RSC Adv., 2019, 9, 8778, 10.1039/C8RA09577A.
- S. Su, S. Chen and C. Fan, Recent Advances in Two-Dimensional Nanomaterials-Based Electrochemical Sensors for Environmental Analysis, Green Energy Environ., 2018, 3, 97–106 CrossRef.
- Nanomaterial-Based Flexible and Multifunctional Sensors, ed. E. Singh and H. S. Nalwa, American Scientific Publishers, Los Angeles, CA, 2019 Search PubMed.
- G. Maduraiveeran, M. Sasidharan and V. Ganesan, Electrochemical Sensor and Biosensor Platforms Based on Advanced Nanomaterials for Biological and Biomedical Applications, Biosens. Bioelectron., 2018, 103, 113–129 CrossRef PubMed.
- S.-K. Sun, H.-F. Wang and X.-P. Yan, Engineering Persistent Luminescence Nanoparticles for Biological Applications: From Biosensing/Bioimaging to Theranostics, Acc. Chem. Res., 2018, 51, 1131–1143 CrossRef PubMed.
- K. T. Nguyen and Y. Zhao, Integrated Graphene/Nanoparticle Hybrids for Biological and Electronic Applications, Nanoscale, 2014, 6, 6245–6266 RSC.
- M. Li, X. Zhou, W. Ding, S. Guo and N. Wu, Fluorescent Aptamer-Functionalized Graphene Oxide Biosensor for Label-Free Detection of Mercury(II), Biosens. Bioelectron., 2013, 41, 889–893 CrossRef.
- Z. S. Qian, X. Y. Shan, L. J. Chai, J. R. Chen and H. Feng, A Fluorescent Nanosensor Based on Graphene Quantum Dots–Aptamer Probe and Graphene Oxide Platform for Detection of Lead (II) Ion, Biosens. Bioelectron., 2015, 68, 225–231 CrossRef.
- X. Cui, L. Zhu, J. Wu, Y. Hou, P. Wang, Z. Wang and M. Yang, A Fluorescent Biosensor Based on Carbon Dots-Labeled Oligodeoxyribonucleotide and Graphene Oxide for Mercury (II) Detection, Biosens. Bioelectron., 2015, 63, 506–512 CrossRef PubMed.
- B.-Y. Fang, C. Li, Y.-Y. Song, F. Tan, Y.-C. Cao and Y.-D. Zhao, Nitrogen-Doped Graphene Quantum Dot for Direct Fluorescence Detection of Al3+ in Aqueous Media and Living Cells, Biosens. Bioelectron., 2018, 100, 41–48 CrossRef PubMed.
- C. Wang, F. Yang, Y. Tang, W. Yang, H. Zhong, C. Yu, R. Li, H. Zhou, Y. Li and L. Mao, Graphene Quantum Dots Nanosensor Derived from 3D Nanomesh Graphene Frameworks and its Application For Fluorescent Sensing of Cu2+ in Rat Brain, Sens. Actuators, B, 2018, 258, 672–681 CrossRef.
- X. Niu, Y. Zhong, R. Chen, F. Wang, Y. Liu and D. Luo, A “Turn-on” Fluorescence Sensor for Pb2+ Detection Based on Graphene Quantum Dots and Gold Nanoparticles, Sens. Actuators, B, 2018, 255, 1577–1581 CrossRef.
- D. Peng, L. Zhang, R.-P. Liang and J.-D. Qiu, Rapid Detection of Mercury Ions Based on Nitrogen-Doped Graphene Quantum Dots Accelerating Formation of Manganese Porphyrin, ACS Sens., 2018, 3, 1040–1047 CrossRef PubMed.
- A. Gevaerd, S. F. Blaskievicz, A. J. Zarbin, E. S. Orth, M. F. Bergamini and L. H. Marcolino-Junior, Nonenzymatic electrochemical sensor based on imidazole-functionalized graphene oxide for progesterone detection, Biosens. Bioelectron., 2018, 112, 108–113 CrossRef.
- T. A. Tabish, M. Z. I. Pranjol, D. W. Horsell, A. A. M. Rahat, J. L. Whatmore, P. G. Winyard and S. Zhang, Graphene Oxide-Based Targeting of Extracellular Cathepsin D and Cathepsin L As A Novel Anti-Metastatic Enzyme Cancer Therapy, Cancers, 2019, 11(3), 319, DOI:10.3390/cancers11030319.
- O. D. Salahdin, H. Sayadi and R. Solanki, et al., Graphene and carbon structures and nanomaterials for energy storage, Appl. Phys. A, 2022, 128, 703, DOI:10.1007/s00339-022-05789-2.
- W. K. Abdelbasset, S. A. Jasim and D. O. Bokov, et al., Comparison and evaluation of the performance of graphene-based biosensors, Carbon Lett., 2022, 32, 927–951, DOI:10.1007/s42823-022-00338-6.
- X. Huang, Y. Zhu and E. Kianfar, Nano biosensors: properties, applications and electrochemical techniques, J. Mater. Res. Technol., 2021, 12, 1649–1672 CrossRef.
- E. Kianfar, Protein nanoparticles in drug delivery: animal protein, plant proteins and protein cages, albumin nanoparticles, J. Nanobiotechnol., 2021, 19, 159, DOI:10.1186/s12951-021-00896-3.
- E. Kianfar, Magnetic Nanoparticles in Targeted Drug Delivery: a Review, J. Supercond. Novel Magn., 2021, 34, 1709–1735, DOI:10.1007/s10948-021-05932-9.
- M. Yang, C. Li, Y. Zhang, D. Jia, R. Li, Y. Hou, H. Cao and J. Wang, Predictive model for minimum chip thickness and size effect in single diamond grain grinding of zirconia ceramics under different lubricating conditions, Ceram. Int., 2019, 45(12), 14908–14920, DOI:10.1016/j.ceramint.2019.04.226.
- J. Zhang, C. Li, Y. Zhang, M. Yang, D. Jia, G. Liu, Y. Hou, R. Li, N. Zhang, Q. Wu and H. Cao, Experimental assessment of an environmentally friendly grinding process using nanofluid minimum quantity lubrication with cryogenic air, J. Cleaner Prod., 2018, 193, 236–248, DOI:10.1016/j.jclepro.2018.05.009.
- Zhang, H. N. Li, C. Li, C. Huang, H. M. Ali, X. Xu, C. Mao, W. Ding, X. Cui, M. Yang, T. Yu, M. Jamil, M. K. Gupta, D. Jia and Z. Said, Nano-enhanced biolubricant in sustainable manufacturing: From processability to mechanisms, Friction, 2021, 10(6), 803–841, DOI:10.1007/s40544-021-0536-y.
- X. Cui, C. H. Li, W. F. Ding, Y. Chen, C. Mao, X. F. Xu, B. Liu, D. Z. Wang, H. N. Li, Y. B. Zhang, Z. Said, S. Debnath, M. Jamil, H. Muhammad Ali and S. Sharma, Minimum quantity lubrication machining of aeronautical materials using carbon group nanolubricant: from mechanisms to application, Chin. J. Aeronaut., 2022, 35(11), 85–112, DOI:10.1016/j.cja.2021.08.011.
- Liu, C. Li, Y. Zhang, Q. An, M. Yang, T. Gao, C. Mao, B. Liu, H. Cao, X. Xu, Z. Said, S. Debnath, M. Jamil, H. M. Ali and S. Sharma, Cryogenic minimum quantity lubrication machining: From mechanism to application, Front. Mech. Eng., 2021, 16(4), 649–697, DOI:10.1007/s11465-021-0654-2.
- H. Li, Y. Zhang, C. Li, Z. Zhou, X. Nie, Y. Chen, H. Cao, Bo Liu, N. Zhang, Z. Said, S. Debnath, M. Jamil, H. M. Ali and S. Sharma, Extreme pressure and antiwear additives for lubricant: academic insights and perspectives, Int. J. Adv. Des. Manuf. Technol., 2022, 120, 1–27, DOI:10.1007/s00170-021-08614-x.
- H. Li, Y. Zhang, C. Li, Z. Zhou, X. Nie, Y. Chen, H. Cao, Bo Liu, N. Zhang, Z. Said, S. Debnath, M. Jamil, H. M. Ali and S. Sharma, Cutting fluid corrosion inhibitors from inorganic to organic: Progress and applications, Korean J. Chem. Eng., 2022, 39, 1107–1134, DOI:10.1007/s11814-021-1057-0.
- T. GAO, Y. ZHANG, C. LI, Y. WANG, Y. CHEN, Q. AN, S. ZHANG, H. N. LI, H. CAO, H. M. ALI, Z. ZHOU and S. SHARMA, Fiber-reinforced composites in milling and grinding: machining bottlenecks and advanced strategies, Front. Mech. Eng., 2022, 17(2), 24, DOI:10.1007/s11465-022-0680-8.
- X. Wang, C. Li, Y. Zhang, H. M. Ali, S. Sharma, R. Li, M. Yang, Z. Said and X. Liu, Tribology of enhanced turning using biolubricants: A comparative assessment, Tribol. Int., 2022, 174, 107766, DOI:10.1016/j.triboint.2022.107766.
- W. Xu, C. Li, Y. Zhang, H. M. Ali, S. Sharma, R. Li, M. Yang, T. Gao, M. Liu, X. Wang, Z. Said, X. Liu and Z. Zou, Electrostatic atomization minimum quantity lubrication machining: from mechanism to application, Int. J. Extreme Manuf., 2022, 4, 042003, DOI:10.1088/2631-7990/ac9652.
- R. Li, Z. Du, X. Qian, Y. Li, J. C. Martinez-Camarillo, L. Jiang, M. S. Humayun, Z. Chen and Q. Zhou, High resolution optical coherence elastography of retina under prosthetic electrode, Quant. Imaging. Med. Surg., 2021 Mar, 11(3), 918–927, DOI:10.21037/qims-20-1137.
- R. Li, et al., Simultaneous Assessment of the Whole Eye Biomechanics Using Ultrasonic Elastography, IEEE Trans. Biomed. Eng., 2022 DOI:10.1109/TBME.2022.3215498.
| This journal is © The Royal Society of Chemistry 2023 |


