 Open Access Article
Numerical simulation of a solar water disinfection system based on a small-scale linear Fresnel reflector
A. Barbóna,
D. Vesperinasc,
L. Bayón *b,
D. García-Mollaghanc and
M. Ghodbane
 d
d
aDepartment of Electrical Engineering, University of Oviedo, Spain
bDepartment of Mathematics, University of Oviedo, Spain. E-mail: bayon@uniovi.es
cPolytechnic School of Engineering of Gijón, University of Oviedo, Spain
dMechanical Engineering Department, Faculty of Technology, Saad Dahlab University of Blida 1, Blida, Algeria
First published on 20th December 2022
Abstract
This paper describes the details of the design of a solar water disinfection system based on a small-scale linear Fresnel reflector. The proposed system consists of a small-scale linear Fresnel reflector, a filtering system, two disinfection units, a heat exchanger, a compressed air system and the control system. A detailed mathematical model has been developed and solved through an iterative procedure. The system has been studied under different operating conditions, such as beam solar irradiance (the beam solar irradiance on a horizontal surface, corresponding to solar noon, varies from 325 to 798 W m−2, for winter solstice and summer solstice, respectively), ambient temperature (the ambient temperature varies between 19 and 29 °C at the summer solstice and from 8 to 16 °C at the winter solstice), thermal fluid flow rate (2200 L h−1, 2400 L h−1, 2600 L h−1, and 2800 L h−1) and water temperature at the outlet of the filtered water tank (8 °C, 12 °C, 16 °C, and 20 °C). The performance of the system has been studied as a function of the temperature of the thermal fluid of the small-scale linear Fresnel reflector, the water temperature of the disinfection unit, the filling and emptying of inertia tanks, clean water productivity and the daily cumulative productivity of clean water. Numerical simulations reveal that the maximum values of cumulative daily productivity of clean water were 357.14 (L m−2 day−1) at 100 (°C) and 198.41 (L m−2 day−1) at 100 (°C) for summer solstice and winter solstice, respectively, in Almeria (Spain), for a thermal fluid flow rate of 2400 L h−1. Values much higher than those obtained by other systems. The inclusion of a heat exchanger in this system significantly increases its productivity. Small-scale linear Fresnel reflector thermal fluid temperature, disinfection unit water temperature, clean water productivity and daily cumulative clean water productivity decreased with increasing thermal fluid flow rate above 2400 L h−1. On the other hand, the water temperature at the outlet of the filtered water tank between 8 and 20 °C has a negligible influence on the small-scale linear Fresnel reflector thermal fluid temperature values, disinfection unit water temperature, clean water productivity and daily cumulative clean water productivity. It is concluded that the proposed solar system offers an energy efficient and environmentally friendly water treatment method.
1 Introduction
Two of the sustainable development goals adopted by all United Nations member states in 2015 (ref. 1) were to ensure availability and sustainable management of water and sanitation for all (goal 6) and also guarantee access to affordable, reliable, sustainable and modern energy for all (goal 7). These objectives have an end date in 2030. However, according to WHO-UNICEF,2 in 2020, about 1 in 4 people still lacked safely managed drinking water in their homes (2 billion people) and almost half of the world's population lacked safely managed sanitation (4 billion people). In addition, 159 million people continue to collect drinking water from surface water resources. The outlook for renewable energies is not promising either. In 2020, primary energy consumption from fossil fuels was 83.17% and from renewable energies 5.69%.3 In order to fulfil goal 6, the construction of a large number of water treatment facilities worldwide will be required. Consequently, the amount of energy required for drinking water supply will increase and thereby the likelihood of achieving goal 7 will also decrease as the consumption of fossil fuels increases. For this reason, the issue of the water-energy nexus is studied broadly in the current literature.4In the more developed countries, the water sector involves two main services: drinking water supply and wastewater treatment. Approximately 7% of the energy produced in the world is destined to be used in these services.5 Although electricity consumption in wastewater treatment plants is higher than drinking water treatment plants,6 the electricity consumed in the latter is not negligible. According to the studies reviewed by Gude7 the conventional water treatment process involves energy consumption between 0.25 and 1.0 kW h m−3 from river water and groundwater sources. Based on research conducted by Loubet et al.,6 the drinking water treatment plants consumed an average of 0.26 kW h m−3, and Lemos et al.8 set the maximum value at 0.64 kW h m−3. Wakeel et al.9 reported that the energy consumption of conventional raw water treatment stages ranges from 0.01 to 0.20 kW h m−3 for Australia, and from 0.11 to 1.50 kW h m−3 for Spain.
In developing countries, the scarcity of drinking water resources and the significant need to increase the supply of drinking water will be some of the major that humanity will have to face.10 This evident need can be found in isolated villages, even in emergency and refugee camps. Common sources estimate that in 2015, 844 million people still lacked even a basic drinking water supply.11 Usually, in these situations, poor wastewater management, due to contamination by human or animal excrements, leads to bacteriological contamination of near-surface water layers. Other categories of water, pollutants, such as radioactive particles or hydrocarbons, are less relevant in these cases. It is estimated that the ingestion of waterborne pathogens causes more than 500![[thin space (1/6-em)]](https://www.rsc.org/images/entities/char_2009.gif) 000 diarrhoeal deaths each year.12 Contaminated water can transmit diseases such as diarrhoea, cholera, dysentery, typhoid fever and polio.12 Health costs associated with waterborne diseases such as malaria, diarrhoea, and worm infections represent more than one third of the income of poor areas in sub-Saharan Africa.12
000 diarrhoeal deaths each year.12 Contaminated water can transmit diseases such as diarrhoea, cholera, dysentery, typhoid fever and polio.12 Health costs associated with waterborne diseases such as malaria, diarrhoea, and worm infections represent more than one third of the income of poor areas in sub-Saharan Africa.12
Microbial pathogens that contaminate water supplies are particularly sensitive to heat, with rapid extermination of these pathogens at temperatures above 65 °C. These pathogens respond differently to elevated temperatures over time, for example, the Table 1 shows the thermal inactivation of the bacteria Escherichia coli O157:H7. Each type of pathogen has its own temperature tolerance, for example, Table 2 shows the thermal inactivation of some pathogenic organisms and, according to it, the duration is highly dependent on the achievable temperature and the type of pathogen, whereby the required exposure durations will decrease rapidly with increasing temperature. There is a logarithmic relationship between time and temperature for multiple pathogens.13 Therefore, the use of devices with a high operating temperature favours the increase of the amount of purified water. This is the principle on which the system presented here is based.
| Pathogen | Temp. (°C) | Inact. time (s) | Ref. |
|---|---|---|---|
| a Bacteria.b Viruses.c Protozoa. | |||
| Poliovirus 1b | 95 | 15 | 15 |
| Hepatitis Ab | 85 | <30 | 16 |
| Legionella spp.a | 80 | 42 | 17 |
| Coxiella burnetiia | 79.4 | 25 | 18 |
| Escherichia colia | 72 | 0.4 | 19 |
| Cryptosporidium parvum oocystsc | 71.7 | 15 | 20 |
| Bacteriophage T2a | 70 | 5400 | 21 |
| Enterococcus faecalis (haemolytic)sa | 65 | 7 | 14 |
| Giardia lambliac | 56 | 600 | 22 |
| Shigella dysenteriae type Ia | 42 | 5400 | 23 |
| Shigella flexneria | 42 | 21![[thin space (1/6-em)]](https://www.rsc.org/images/entities/char_2009.gif) 600 600 |
23 |
Several studies indicate that the time and temperature conditions for milk pasteurization (62.8 °C for 30 min or 71.7 °C for 15 min) should be sufficient to eliminate the microbial pathogens commonly transmitted in contaminated water.24 The study shows that water heated to 65 °C for 30 min makes it safe to drink. If temperatures increase, the time required for microbial inactivation is expected to considerably. The presented database25 summarises multiple studies on the thermal tolerance of different pathogens. Based on these results, the WHO26 recommends the process of water pasteurization. Thermal disinfection of liquids, for example water, is named pasteurisation, and involves raising the temperature of water sufficiently to make it safe to drink. In the process the pathogen population is reduced to levels at which we can avoid risks to human health, by setting a temperature that must be maintained for a certain period of time. Pasteurisation by boiling water has long been recognised as a safe way to treat water contaminated with pathogens.26 Pasteurisation can take place at much lower temperatures than boiling, depending on how long the water is kept at the pasteurisation temperature. The pasteurisation time decreases exponentially with increasing temperature. Above 50 °C, the time decreases by a factor of approximately 10 for every 10 °C increase in pasteurisation temperature.27 Therefore, it is not necessary to boil water to make it safe to drink. This is another important aspect in the design of water purification systems, as the generation of water vapour uses large amounts of energy. It is clear that the use of solar energy can contribute to the achievement of goals 6 and 7. In this context, a large number of researchers proposed multicriteria models to integrate energy and water.28,29
The major advantage of pasteurisation is that its efficiency does not depend on turbidity, pH and other parameters that influence alternative methods.13,27 The main drawback of pasteurisation is its high cost. Solar energy can be used to reduce this cost. For these reasons, the WHO26 recommended the solar technologies. Several types of solar collectors can be used for this purpose: the parabolic trough collector and flat plate collector. The productivity of these systems can be expressed in litres of purified water per solar irradiation collector surface, L m−2.
Bigoni et al.30 developed a solar water pasteurizer that directly heats water by using a parabolic cylindrical concentrator. The proposed system does not use a heat exchanger to preheat the water at the inlet of the collector. On sunny days the temperature of the treated water is 87 °C.
Flat plate collectors have also been used for water pasteurisation systems. Carielo et al.32 presented a solar pasteurization system composed of a contaminated water tank, a flat plate collector, a heat exchanger and a treated water tank. The treated water was tested at five different temperatures: 55 °C, 60 °C, 65 °C, 75 °C and 85 °C. Onyango et al.31 designed, built and tested an experimental flat plate solar collector used as the collector for a prototype solar water pasteurization system. In addition, they also used a contaminated water tank and a treated water tank. On sunny days the temperature of the treated water is 84 °C. El-Ghetany et al.33 presented a solar pasteurization system consisting of a contaminated water tank, a flat plate collector, a heat exchanger and a treated water tank. The outlet flow temperature is controlled by a solenoid valve at a disinfection temperature. On sunny days the temperature of the treated water is 90 °C.
Table 3 shows the results achieved in terms of the productivity of the systems analysed. In some of these research papers, no heat exchangers are included to preheat the water at the inlet of the collector, resulting in low system productivity, as in the work of ref. 30. Although Onyango et al.31 do not use a heat exchanger, the inlet water temperature is quite high due to the climatic conditions of the experiment. In ref. 32 and 33 used a heat exchanger resulting in increased productivity. It can be concluded then that the productivity of drinking water purification systems increases with the inclusion of a heat exchanger in the system. This has been verified in the numerical simulations carried out in the study presented here.
WHO26 recommends the process of heating water to a boiling temperature of 100 °C during 180 s to inactivate pathogenic bacteria, viruses and protozoa. This recommendation does not apply if other contaminants such as heavy metals, persistent organic compounds, PFAS, pesticides and herbicides are present in the water. The parabolic trough collector is suitable for this temperature, whereas the flat-plate collector does not reach the set temperature.34 Another solar concentrator that can reach the temperature of 100 °C is the small-scale linear Fresnel reflectors (SSLFR).34,35 The technologies applied for water disinfection must meet three fundamental premises: they must be simple, cheap and easy to maintain. The small-scale linear Fresnel reflectors fulfils the requirements in comparison to the parabolic trough collector.36
Compared to the parabolic trough, the SSLFR has notable differences:37 (i) lower structural requirements (rows of mirrors are mounted close to the ground and wind loads are substantially reduced),47 (ii) lower maintenance cost (easier access for cleaning), (iii) lower cost,47 and (iv) lower efficiency (greater influence of the angle of incidence and cosine factor). There are numerous possible applications for the SSLFR, such as: desalination;38 industrial process applications;39–41 heating/cooling of living spaces;42–44 absorption of cooled air in a Solar-GAX cycle;45 daylighting systems.46 An SSLFR uses stretched rows of mirrors to reflect sunlight onto the focal line of an absorber tube that runs longitudinally above the mirror rows. The absorber tube is specially coated to increase its ability to absorb concentrated incident solar irradiation and is also covered by a cavity receiver to reduce convective heat losses. The concentrated solar energy is transferred through the absorber tube into some thermal fluid capable of maintaining the liquid state at high temperatures. See ref. 47 for a more detailed information on a small-scale linear Fresnel reflector.
Therefore, in order to increase the productivity of a water purification system, the following should be taken into account: (i) the working temperature of the system should be above 100 °C; (ii) change of state of the water should be avoided; and (iii) a heat exchanger should be included in the system.
This article discusses a solar system based on an SSLFR to produce clean water. As mentioned earlier in this paper, one way of producing clean water is through a pasteurization method. The system consists of an SSLFR, a disinfection unit, a heat exchanger, a filtration system, and a compressed air system. The specific contributions of this study can be summarized in the following proposals:
(i) An SSLFR has been used as a sunlight collector.
(ii) A complete mathematical model that allows the determination of the amount of purified water.
(iii) An overpressure system prevents the water from changing state is used.
The innovation in this study was to explore the possibility of using a patented small-scale linear Fresnel reflector48 to pasteurise relatively large quantities of water. To the best of our knowledge, a solar water treatment system with these characteristics has not yet been studied in the literature. The effects of environmental parameters such as the solar irradiation intensity, ambient temperature, and wind speed were studied.
The paper is organized as follows. Section 2 summarises the main components of the system and their functional description. Section 3 presents the technical considerations of the system. The mathematical model is presented in Section 4. Numerical simulations are presented in Section 5 for different environmental parameters. Finally, Section 6 summarises the main contributions and conclusions of the paper.
2 System description
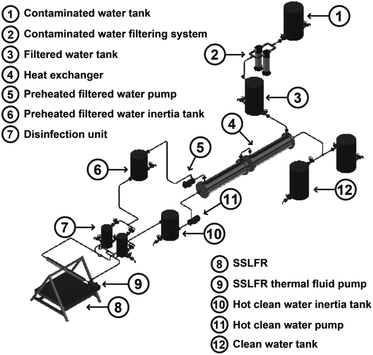
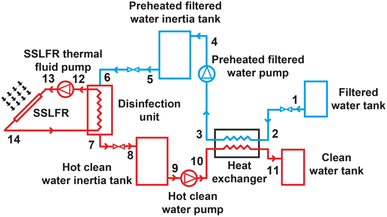
A schematic diagram of the proposed solar water treatment system based on an SSLFR is presented in Fig. 1. As shown, the proposed system consists of six subsystems: the filtering system (2), the sunlight collector (8), the disinfection unit (DU) (7), the heat exchanger (4), the compressed air system and the control system. The contaminated water is filtered in the filtration system. In the heat exchanger the filtered water is preheated, and the hot clean water is cooled. An SSLFR has been used as a sunlight collector for thermal energy production. In the DU the preheated filtered water is heated up to the temperature of 100 °C for three minutes.26 The system operation is designed as a batch processor, although by having two disinfection units we achieve a continuous flow system. The work cycle is as follows: disinfect a mass of water equal to the useful capacity of the first DU, at the same time the second DU is already filled with preheated filtered water and therefore it is ready to go into operation as soon as the preheated filtered water of the first disinfection unit reaches a temperature of 100 °C, keeping it at a stable temperature for 3 minutes and start emptying it.2.1 System operation
The system operation is the following (see Fig. 1):(i) The contaminated water is stored in the contaminated water tank (1). The contaminated water storage tank (1) provides sedimentation of any impurities. This tank is located at ground level.
(ii) The contaminated water is then filtered through a cartridge-type water filter (2). Although, pasteurisation is a water treatment method that is not adversely affected by turbidity, suspended particles can affect the performance of the components.
(iii) The filtered water is then stored in a filtered water tank (3). This tank controls the water flow that is introduced into the system through a filling buoy.
(iv) The filtered water then passes through a heat exchanger (4), which allows the energy from the hot clean water to be used for preheating the incoming filtered water.
(v) After passing through the heat exchanger, via the preheated filtered contaminated water pump (5), the preheated filtered water enters a preheated filtered water inertia tank (6). This last one, serves to ensure that we always have water at the inlet of the disinfection unit (7). The lack of water in the DU (7) would translate to an excessive heating of the thermal oil, which is conducted by the absorber tube of the SSLFR.
(vi) The preheated filtered water enters a disinfection unit (7), which allows the energy of the thermal fluid from the SSLFR (8) to be used for heating the incoming preheated filtered water. The preheated filtered water is heated up to the temperature of 100 °C for three minutes, following the WHO guidelines.26 Clean hot water is obtained at the outlet of the disinfection unit (7). The DU (7) serves as a disinfection apparatus by raising the water temperature. Two disinfection units (7) are connected in parallel, ensuring continuous operation of the system. In case of transient reductions of solar irradiance (clouds, …) the system with the disinfection unit (7) would be able to reach the set reference temperature, for this purpose, the outlet valve would be closed until the set reference temperature is reached.
(vii) Sun rays fall directly onto the stretched rows of mirrors of the SSLFR (8). The mirrors then reflect the sunlight onto the focal line of an absorber tube. This concentrated solar energy is transferred through the absorber tube into some thermal fluid capable of maintaining the liquid state at high temperatures. A pump (9) conducts the thermal fluid through the disinfection unit.
(viii) The hot clean water is then stored in a hot clean water tank (10).
(ix) The hot clean water is passed through the heat exchanger (4) via the hot clean water pump (11) and is then stored in a clean water tank (12).
(x) Two clean water tanks will allow to cool naturally of the hot clean water and then protecting it from post-treatment contamination during storage.
2.2 Compressed air system
The water saturation temperature at atmospheric pressure is 100 °C. If the system operates below atmospheric pressure, the water will start to boil at a lower temperature than the 100 °C and steam particles will start to appear, which are undesirable for different reasons: (i) the energy reduction used in the production of the hot clean water, part of this energy is lost in the generation of steam, (ii) cavitation of the system pumps. For these reasons it is essential to keep the system composed of the inertia tanks and the disinfection unit under a certain pressure above the atmospheric pressure.During the emptying of the disinfection units, without a pressurized air supply to fill the volume left by the clean hot water, the pressure would decrease to a point where emptying could become difficult for the clean hot water pump and there is also a possibility that the clean hot water reaches saturation due to the pressure reduction. The opposite would occur while the disinfection units are being filled. If there is no exit for the air that is in the tank while being filled, the pressure would rise to unwanted values.
Given that there is a constant volume of water in the set of tanks, there will also be a constant volume of air trapped within the system. If we compress the total air mass, trapped within the system, to the desired pressure and we communicate the upper parts or the inertia tanks and the disinfection units with a fifth pressure regulator tank, its objective is to keep a stable value of pressure in the entirety of the system, despite the individual volume variations of each tank.
The emptying of one of the disinfection units results in an increase in volume of the hot buffer tank, whereby a part of the mass of the same volume of compressed air will flow from the hot inertia tank into the pressure regulating tank and from the pressure regulating tank into the disinfection unit, thereby leaving the systems pressure unchanged.
The only pressure variation allowed in the system is the one caused by the reduction in density due to temperature. This fluctuation will be minimal and will be compensated when the clean hot water leaves the system at 100 °C and enters at the original temperature, so it will not be an issue.
The system does not require any constant input of compressed air, only at the start-up of the systems there will be a filling of the compressed air regulator tank. In a permanent regime, the only energy contribution that the compressed air system requires is the one that covers the systems pressure losses.
With an absolute pressure of 2 bar, the water will enter saturation levels at a temperature of 120.21 °C,50 far from the systems operating temperature of 100 °C.
3 Technical considerations
3.1 Contaminated water tank
The contaminated water tank was made of rigid high-density polyethylene with opaque blue colour (UV protection), its dimensions are 790 mm × 1650 mm × 1850 mm (width × height × length) and its volume is 2000 L.3.2 Contaminated water filtering system
The objective of the filter is to remove any dissolved solids, so commercial filters can be used. Two sand filters will be placed in parallel, in order to have one of them operating whilst the second filter is in the process of cleaning or as a replacement filter in case failure. Since it is estimated that the system will have a purification capacity of a 1000 L of water a day, the selected sand filter must have at least the same filtering capacity. The objective of having two simultaneous filters is that in days of greater solar irradiance we can increase the purifying capacity, so as to have a higher production level of drinkable water.The water filter has the following minimum characteristics: 65 mm diameter, 200 mm height, 10 L min−1 flow rate, and 2 kg cm−1 water pressure.
3.3 Filtered water tank
The filtered water tank is made of rigid high-density polyethylene in opaque blue colour (UV protection), with the following dimensions: 790 mm × 1650 mm × 1850 mm (width × height × length) and a volume of 2000 L.3.4 Heat exchanger
A counterflow shell and tube heat exchanger is used. There are four openings between the inlets and outlets of the heat exchanger: the primary (tube), one for the hot clean water inlet, one for the clean water outlet, and the secondary (shell), one for the filtered water inlet and one for the hot filtered water outlet.For a design mass flow rate of 0.054487 kg s−1 (200 L h−1) for the cold fluid and 201.81 L h−1 for the hot fluid, the heat exchanger has the following characteristics: the heat exchangers length is 2.4 m. The pipes used are made of steel with an interior diameter of 0.075 m and a thickness of 0.0025 m. The number of tubes is 35. The total exchange area is 21.11 m2.
In terms of temperature:
Primary heat exchanger: the temperature of the hot fluid at the inlet of the heat exchanger is 100 °C, the intermediate temperature of the hot fluid is 59.68 °C and the outlet temperature of the hot fluid from the heat exchanger is 25.87 °C.
Secondary heat exchanger: the temperature of the cold fluid at the inlet of the heat exchanger is 11 °C, the intermediate temperature of the cold fluid is 44.83 °C and the outlet temperature of the cold fluid from the heat exchanger is 85.21 °C.
3.5 Preheated filtered water pump and clean hot water pump
The preheated filtered water pump will impulse water from the outlet of the heat exchanger to the preheated filtered water inertia tank, while the clean hot water pump will propel the water from the clean hot water inertia tank to the heat exchanger. The flow from the preheated filtered water and from the clean hot water will be the same. For these reasons, the flow rate is constantly adjusted by two small pumps. The chosen pumps will be wet rotor pumps with variable speed, with the following features: fluid temperature from 5 to 110 °C and a maximum operating pressure of 10 bar.3.6 Preheated filtered water inertia tank and clean hot water inertia tank
For the system to be able to function as a continuous flow pasteurization system, a buffer tank of preheated filtered water and an inertia tank of clean hot water with volumes much larger than the disinfection units are required.The volume of these tanks is 800 L. These tanks were manufactured of galvanized iron sheets (0.003 m thickness). It was made of a cylindrical shape 0.75 m diameter with a height of 1.92 m. These tanks are isolated from exterior weather to avoid any thermal losses.
3.7 Disinfection unit
The volume of the disinfection unit is 204 L. The disinfection unit was manufactured of galvanized iron sheet (0.003 m thickness). It was made of a cylindrical shape (0.51 m diameter with a height of 1 m). The pipe system consists of four carbon steel tubes with an exterior diameter of 0.03 m and a thickness of 0.0075 m, with a distribution of 2 tubes in each direction of the vertical oil circulation. The four pipes are equidistant from each other and at the same time they are connected by 3 bends that have a horizontal length of 0.25 m. The oil inlet and outlet are at the bottom of the disinfection unit. These units are isolated from exterior weather to avoid any thermal losses.3.8 SSLFR
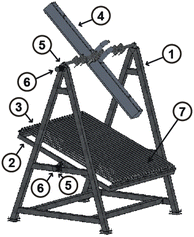
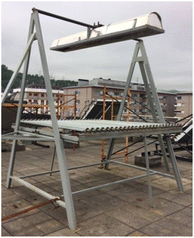
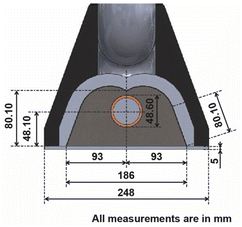
For this research, an experimental prototype48 composed of six main parts was used. As part of the prototype there is a fixed (FS) (1) and a mobile structure (MS) (2), as key components of the prototype there is a primary reflector system (PRS) (3) and a secondary reflector system (SRS) (4). As the Sun moves along its path, the reflector must be able to orient itself according to the position of the Sun, therefore a transmission system (TR) (5), and a tracking system (TS) (6) are needed. Fig. 2 shows a representation of components, and Fig. 3 shows a photograph of the experimental prototype. The secondary reflector geometry is presented in Fig. 4.49It should be noted that for the assembly a specific mounting base was created for the fixed structure, on which the mobile structure and the secondary reflector system will rest. The primary reflector system will be mounted on the mobile structure. The primary reflector system consists of parallel rows of stretched mirrors (7) and being specific mirrors for this SSLFR prototype, frames had to be specially designed for them. The secondary reflector system consists of multiple parts, which are: an absorber tube, a receiver cavity, insulation and a glass cover. To optimize production, the second reflector system must be placed at a certain height above the primary reflector system.
The prototype under consideration uses a three-axis tracking system.51 Each tracking axis is intended for a particular movement, which are as follows: an East–West axis movement, so the mobile structure can rotate. A North–South rotation for the mirrors of the primary reflector system to follow and track the movement of the Sun. The last axis also rotates on an East–West motion, but it is intended for the movement of the secondary reflector system. The main parameters of the SSLFR can be seen in Table 4.
| Parameters | Value | Ref. | |
|---|---|---|---|
| N | Number of mirrors at each side of the central mirror | 12 | 52 and 53 |
| WM | Mirror width | 0.06 m | 52–54 |
| LM | Mirror length | 2.40 m | 52 and 53 |
| d | Separation between two mirrors | 0.024 m | 52 and 53 |
| D | Outlet diameter of the absorber tube | 0.0486 m | 52 and 53 |
| f | Height of the receiver | 1.50 m | 52–55 |
| La | Length of the absorber tube | 2.40 m | 52 and 53 |
| ρ | Reflectivity of the mirrors | 0.94 | 56 |
| CLm | Cleanliness factors of the mirror | 0.96 | 57 |
| CLg | Cleanliness factors of the glass covering the secondary absorber | 0.96 | 57 |
| τ | Transmissivity of the glass | ||
| If αi ≤ 20° | τ = 0.87 | 58 | |
| If 20° ≤ αi ≤ 30° | τ = 0.85 | ||
| αb | Absorptivity of the absorber tube | 0.95 | 59 |
3.9 SSLFR thermal fluid pump
The flow rate of this pump was set at 2400 L h−1 so that the thermal jump produced in the absorber tube during the hours when the solar irradiance is at its highest is close to values of 2 °C every 10 minutes.3.10 Clean water tank
The drinking water storage system will consist of two tanks with a capacity of 2000 L each. One of the tanks will be used to store the drinking water produced during the day, whilst the second tank will be used to cool the drinking water prior to consumption the following day. The clean water tank is made of a rigid high-density polyethylene with opaque blue color (UV protection), and has dimensions of 790 mm × 1650 mm × 1850 mm (width × height × length) and a volume of 2000 L.3.11 Compressed air system
The compressed air system consists of a compressor, a regulating tank, a filter, a pressure switch and a lubricator. The advantage that many commercial compressors have is that they already include all of these elements in the unit. Generic commercial compressors do not have the ability to compress air to as low a pressure as the system requires, so a regulating valve set at 2 bar will be needed. Downstream of the regulating valve there will be a one-way valve to prevent air loss in case of failure on the high-pressure side of the regulating valve. The compressed air system shall also incorporate a safety valve set to 4 bar, to prevent mechanical failure of the system components in the event of overpressure within the system. The pressure regulating tank will be connected via pneumatic lines to the top of the inertia and the disinfection units tanks.All elements of the compressed air system must be able to withstand temperatures around 100 °C as the air will also receive heat input into the tanks. For that reason, these ducts will also be covered with thermal insulation.
3.12 Control systems
For this purpose, the control system operates two three-way solenoid valves (named E31 and E32) allowing the oil to circulate, alternating the two disinfection units. In addition, the control system also actuates four two-way solenoid valves (named E2A1 and E2A2 for the disinfection unit A and E2B1 and E2B2 for the disinfection unit B), which allows the filling and emptying of each of the disinfection units. For this purpose, several temperature sensors are used to detect when the water temperature reaches 100 °C for 3 minutes, then the disinfection unit A will be emptied, while the oil will start to circulate through the disinfection unit B.
The objective of the control system is that both disinfection units remain filled with water at all times of the day, even when there is no solar irradiation on the SSLFR, to promote a constant flow operation.
The temperature sensor will be placed in the lower part of each one of the disinfection units, so when the disinfection unit is filled and heated up, a slight temperature gradient will be established in which the mass of water at the highest temperature will be at the top of the disinfection unit, so the mass of water with a lower temperature will be located in the lower level of the unit due to difference in densities, caused by the difference in temperatures. It has been estimated that with the dimensions and geometrical arrangement of the established tubes in the disinfection unit, when the temperature of 100 °C is reached at the bottom, there will be approximately 5 °C more at the top.
The disinfection units are also equipped with a pressure gauge to control the pressure and they also have two level sensors (high level and low level). The flow chart shows the operation of the system of the disinfection units, which is as follows:
(i) At the beginning of each day both disinfection units will be full of the preheated filtered water.
(ii) When the temperature sensors from the disinfection unit A detect that the water has reached the set temperature of 100 °C, the control system will time out 3 minutes. When this condition is met, the disinfection unit A is emptied.
(iii) When the emptying of the disinfection unit A starts, by means of the solenoid valve E2A1, the solenoid valves E31 and E32 are triggered so that the oil starts to circulate through the disinfection unit B.
(iv) Once the low-level sensor indicates that the disinfection unit A is empty, the solenoid valve E2A1 closes to then open the solenoid valve E2A2 so as to fill the disinfection unit A with preheated filtered water. A level sensor will indicate the filling of the disinfection unit A, while waiting for the unit to be filled.
(v) When the temperature sensors from the disinfection unit B detect that the water has reached the set temperature of 100 °C, the control system will time out 3 minutes. When this condition is met, the disinfection unit B is emptied.
(vi) When the emptying of the disinfection unit B starts, by means of the solenoid valve E2B1, the solenoid valves E3A and E3B are triggered so that the oil starts to circulate through the disinfection unit A.
(vii) Once the low-level sensor indicates that the disinfection unit B is empty, the solenoid valve E2B1 closes to then open the solenoid valve E2B2 so as to fill the disinfection unit B with preheated filtered water. A level sensor will indicate the filling of the disinfection unit B, while waiting for the unit to be filled.
(viii) The process will be repeated and at the end of the day both disinfection units will be filled with preheated filtered water.
The emptying of the clean hot water inertia tank matches the filling of the preheated filtered water inertia tank, for proper heat exchanger performance. This control of the inflow and outflow of water is accomplished by controlling the clean hot water pump and the preheated filtered water pump.
3.13 Connection piping
As the pipes are insulated and their length does not exceed 4 m, thermal losses are considered to be negligible.4 Mathematical model
A mathematical model is developed for the proposed system by applying mass and energy balance equations for each component. The general forms of these equations can be expressed as:50| ∑ṁin = ∑ṁout | (1) |
∑(ṁ × h)in − ∑(ṁ × h)out + ∑![[Q with combining dot above]](https://www.rsc.org/images/entities/i_char_0051_0307.gif) in − ∑ in − ∑![[Q with combining dot above]](https://www.rsc.org/images/entities/i_char_0051_0307.gif) out + Ẇ = 0 out + Ẇ = 0
| (2) |
![[Q with combining dot above]](https://www.rsc.org/images/entities/i_char_0051_0307.gif) is the heat in W and Ẇ is the power in W.
is the heat in W and Ẇ is the power in W.
To establish the mathematical model, the system is considered in three components: SSLFR, disinfection unit and heat exchanger. The schematic diagram of the proposed system is shown in Fig. 5.
The assumptions made for the modelling of the system are as follows:
(i) The proposed system operates under steady-state conditions.
(ii) The water temperature at the outlet of the filtered water tank is considered to be at ambient temperature. For this particular design, a temperature of 11 °C was considered.
(iii) The water temperature at the inlet of the disinfection unit is considered to be 85 °C or higher.
(iv) The temperature at the outlet of the disinfection unit is considered to be 101 °C.
(v) The temperature of the clean water at the outlet of the heat exchanger is 25.87 °C.
(vi) The disinfection unit, the preheated filtered water inertia tank and the clean hot water inertia tank have an internal pressure of 2 bar.
(vii) System components do not have heat transfer to the environment.
(viii) All the pipes are well insulated.
(ix) The pressure drop in the connecting pipes is not taken into account.
(x) Ambient air properties taken at 20 °C.
(xi) There is no evaporated water.
4.1 SSLFR
The heat transfer from the SSLFR to the disinfection unit,![[Q with combining dot above]](https://www.rsc.org/images/entities/i_char_0051_0307.gif) SSLFR_out, is found by:
SSLFR_out, is found by:
![[Q with combining dot above]](https://www.rsc.org/images/entities/i_char_0051_0307.gif) SSLFR_out = SSLFR_out = ![[Q with combining dot above]](https://www.rsc.org/images/entities/i_char_0051_0307.gif) SSLFR_in − SSLFR_in − ![[Q with combining dot above]](https://www.rsc.org/images/entities/i_char_0051_0307.gif) SSLFR_loss − SSLFR_loss − ![[Q with combining dot above]](https://www.rsc.org/images/entities/i_char_0051_0307.gif) piping piping
| (3) |
![[Q with combining dot above]](https://www.rsc.org/images/entities/i_char_0051_0307.gif) SSLFR_in is the available heat of the SSLFR working fluid in W,
SSLFR_in is the available heat of the SSLFR working fluid in W, ![[Q with combining dot above]](https://www.rsc.org/images/entities/i_char_0051_0307.gif) SSLFR_loss is the heat loss of the absorber tube in the SSLFR in W,
SSLFR_loss is the heat loss of the absorber tube in the SSLFR in W, ![[Q with combining dot above]](https://www.rsc.org/images/entities/i_char_0051_0307.gif) piping is the heat loss of the connecting pipes between the SSLFR and the disinfection unit in W.
piping is the heat loss of the connecting pipes between the SSLFR and the disinfection unit in W.
The ![[Q with combining dot above]](https://www.rsc.org/images/entities/i_char_0051_0307.gif) SSLFR_in can be calculated using the equation proposed in ref. 60:
SSLFR_in can be calculated using the equation proposed in ref. 60:
![[Q with combining dot above]](https://www.rsc.org/images/entities/i_char_0051_0307.gif) SSLFR_in = DNI × ηopt0 × IAM × Aeffi SSLFR_in = DNI × ηopt0 × IAM × Aeffi
| (4) |
QSSLFR_loss can be calculated by means of the correlation proposed by:61
| qloss = (0.0212vw − 0.6049)(Tt − Tamb) + 0.0135qi + 0.0072(Tt − Tamb)2 − 1.046 × 10⁻⁶ × qi(Tt − Tamb) − 9.582 × 10⁻⁸ × qi2 | (5) |
![[Q with combining dot above]](https://www.rsc.org/images/entities/i_char_0051_0307.gif) SSLFR_loss can be calculated:
SSLFR_loss can be calculated:
![[Q with combining dot above]](https://www.rsc.org/images/entities/i_char_0051_0307.gif) SSLFR_loss = qlossLa SSLFR_loss = qlossLa
| (6) |
As the pipes connecting the SSLFR and the disinfection unit are thermally insulated, ![[Q with combining dot above]](https://www.rsc.org/images/entities/i_char_0051_0307.gif) piping is considered to have a negligible value.
piping is considered to have a negligible value.
4.2 Disinfection unit
Cold fluid (preheated filtered water) around hot fluid (oil) has been allocated to reduce energy losses.50 Therefore, the hot fluid (oil) is supplied through the inner tubes, while the cold fluid (preheated filtered water) will be placed in the tank. This choice fulfils the condition: the fluid (oil) with the highest fouling factor has been placed in the tubes, as they are easier to clean.50The energy balance in the disinfection unit can be written as follows:
![[Q with combining dot above]](https://www.rsc.org/images/entities/i_char_0051_0307.gif) DU_out = DU_out = ![[Q with combining dot above]](https://www.rsc.org/images/entities/i_char_0051_0307.gif) SSLFR_out − SSLFR_out − ![[Q with combining dot above]](https://www.rsc.org/images/entities/i_char_0051_0307.gif) DU_conv_i − DU_conv_i − ![[Q with combining dot above]](https://www.rsc.org/images/entities/i_char_0051_0307.gif) DU_cond − DU_cond − ![[Q with combining dot above]](https://www.rsc.org/images/entities/i_char_0051_0307.gif) DU_conv_o − DU_conv_o − ![[Q with combining dot above]](https://www.rsc.org/images/entities/i_char_0051_0307.gif) DU_fouling DU_fouling
| (7) |
![[Q with combining dot above]](https://www.rsc.org/images/entities/i_char_0051_0307.gif) DU_out is the heat transfer to the preheated filtered water in W,
DU_out is the heat transfer to the preheated filtered water in W, ![[Q with combining dot above]](https://www.rsc.org/images/entities/i_char_0051_0307.gif) SSLFR_out is the heat transfer through the SSLFR in W,
SSLFR_out is the heat transfer through the SSLFR in W, ![[Q with combining dot above]](https://www.rsc.org/images/entities/i_char_0051_0307.gif) DU_conv_i is the convective heat transfer through the side of the inner tube in W,
DU_conv_i is the convective heat transfer through the side of the inner tube in W, ![[Q with combining dot above]](https://www.rsc.org/images/entities/i_char_0051_0307.gif) DU_cond is the heat transfer by conduction through the tube wall in W,
DU_cond is the heat transfer by conduction through the tube wall in W, ![[Q with combining dot above]](https://www.rsc.org/images/entities/i_char_0051_0307.gif) DU_conv_o is the heat transfer be convection through the outer side of the tube in W and
DU_conv_o is the heat transfer be convection through the outer side of the tube in W and ![[Q with combining dot above]](https://www.rsc.org/images/entities/i_char_0051_0307.gif) DU_fouling is the heat loss fouling on the inner tube side in W.
DU_fouling is the heat loss fouling on the inner tube side in W.
Convective heat transfer from the oil to the inner wall of the tube system take place by forced convection. The ![[Q with combining dot above]](https://www.rsc.org/images/entities/i_char_0051_0307.gif) DU_conv_i can be calculated by means of the equation:50
DU_conv_i can be calculated by means of the equation:50
![[Q with combining dot above]](https://www.rsc.org/images/entities/i_char_0051_0307.gif) DU_conv_i = Aihi(Toil − Twater) DU_conv_i = Aihi(Toil − Twater)
| (8) |
 | (9) |
If the system operates in laminar regime (ReD < 2300), the Hausen correlation shall be used to determine the Nusselt number:50
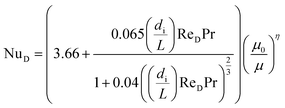 | (10) |
If the system is operating in turbulent regime (ReD > 2300), the Gnielinski correlation can be used to determine the Nusselt number,62 this correlation is considered to be the most accurate in the range of 3000 < ReD < 5 × 10⁶ and 0.5 < Pr < 2000:63
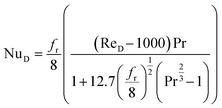 | (11) |
f = (0.79![[thin space (1/6-em)]](https://www.rsc.org/images/entities/char_2009.gif) ln(ReD) − 1.64)−2 ln(ReD) − 1.64)−2
| (12) |
The conductive heat transfer through the wall of the pipe, ![[Q with combining dot above]](https://www.rsc.org/images/entities/i_char_0051_0307.gif) DU_cond, can be calculated by the equation in ref. 50:
DU_cond, can be calculated by the equation in ref. 50:
 | (13) |
The heat transfer by convection from the outer wall of the tube to the water is by natural convection, as there is no external force moving the fluid. Therefore, the correlations used will be Saunders and Weise to calculate the outgoing heat transfer coefficient (ho), because the operating regime is natural convection around a vertically arranged cylinder:50
![[Q with combining dot above]](https://www.rsc.org/images/entities/i_char_0051_0307.gif) DU_conv_e = Aoho(Toil − Twater) DU_conv_e = Aoho(Toil − Twater)
| (14) |
 | (15) |
The relation between the Prandlt number and the Grashof number with the Nusselt number, can be expressed by the equation:50
| NuL = C(GrLPr)m | (16) |
The Prandlt number is evaluated with the thermophysical properties of water at the film temperature. The Grashof number can be calculated:50
 | (17) |
 , Tm is the average water temperature in °C, ΔT is the difference between the average pipe wall temperature and the average water temperature in °C, g is the gravitational acceleration in m s−2, L is the length of the tube in m, ν is the kinematic viscosity of water evaluated at the film temperature in m2 s−1.
The coefficients C and m can be calculated:50
If 104 < (GrLPr) < 109, C = 0.59 and m = 0.25.
If 109 < (GrLPr) < 1012, C = 0.13 and  .
.
The heat loss due to fouling of the inner walls of the pipe can be calculated:50
![[Q with combining dot above]](https://www.rsc.org/images/entities/i_char_0051_0307.gif) DU_fouling = πdiLCf_oil(Toil − Twater) DU_fouling = πdiLCf_oil(Toil − Twater)
| (18) |
4.3 Heat exchanger
The hot fluid (clean water) is supplied through the inner tubes, while the shell side is crossed by the cold fluid (filtered water). The cold fluid around the hot fluid is designated to reduce energy losses and equipment cost.50 Both fluids are used in counterflow to maximise the average temperature difference. Both fluids have a similar fouling factor. Therefore, the principle of placing the fluid with the higher fouling factor in the tubes is not used, as they are easier to clean than the shell in this case.In this analysis the fluid inlet and outlet temperatures are specified by the system design conditions. The heat exchanger analysis is based in an energy balance:50
![[Q with combining dot above]](https://www.rsc.org/images/entities/i_char_0051_0307.gif) HE = HE = ![[Q with combining dot above]](https://www.rsc.org/images/entities/i_char_0051_0307.gif) HE_h = HE_h = ![[Q with combining dot above]](https://www.rsc.org/images/entities/i_char_0051_0307.gif) HE_c HE_c
| (19) |
![[Q with combining dot above]](https://www.rsc.org/images/entities/i_char_0051_0307.gif) HE is the heat transfer rate in W,
HE is the heat transfer rate in W, ![[Q with combining dot above]](https://www.rsc.org/images/entities/i_char_0051_0307.gif) HE_h is the heat transfer rate of the hot fluid in W, and
HE_h is the heat transfer rate of the hot fluid in W, and ![[Q with combining dot above]](https://www.rsc.org/images/entities/i_char_0051_0307.gif) HE_c is the heat transfer rate in the cold fluid in W.
HE_c is the heat transfer rate in the cold fluid in W.
These heat transfer rates can be estimated from the following equations:
![[Q with combining dot above]](https://www.rsc.org/images/entities/i_char_0051_0307.gif) HE_h = ṁ10Cpw_h(T10 − T11) HE_h = ṁ10Cpw_h(T10 − T11)
| (20) |
![[Q with combining dot above]](https://www.rsc.org/images/entities/i_char_0051_0307.gif) HE_c = ṁ2Cpw_c(T3 − T2) HE_c = ṁ2Cpw_c(T3 − T2)
| (21) |
The effectiveness-number of transfer units (ε–NTU) method is used to estimate: the heat transfer area, the number of tubes, the tube length, the tube diameter, the tube pitch, the tube layout, the number of shells, the tube passes, etc.
The heat exchanger efficiency (ε) is defined as the ratio between the actual heat transfer rate of a heat exchanger and the maximum possible heat transfer rate. Therefore, in this study can be written as:
 | (22) |
| ṁ10Cpw_h ≃ ṁ2Cpw_c | (23) |
Eqn (22) can be simplified as:
 | (24) |
The number of transfer unit (NTU) is defined as a ratio of the overall thermal conductance to the lower heat capacity rate:
 | (25) |
The U can be calculated:
 | (26) |
To calculate hi and ho it is necessary to know the Reynolds number. The Reynolds number can be calculated as:
 | (27) |
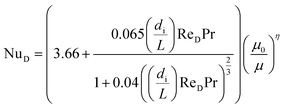 | (28) |
The hi can be calculated:50
 | (29) |
ho_f and hi_f can be calculated:50
The relationship between ε and NTU50 is:
| ε = 1 − e−NTU | (30) |
And for this particular case it can be written as:50
 | (31) |
5 Results and discussion
In this section, the results of a large number of numerical simulations are presented. The productivity of this system was calculated by means of 10 min intervals, under different operating conditions. These operating conditions are beam solar irradiance, ambient temperature, thermal fluid flow rate and water temperature at the outlet of the filtered water tank.The objective is to estimate the effect of the operating conditions on the temperature of the thermal fluid from the SSLFR, the temperature of water in the disinfection unit, the filling and emptying of inertia tanks, clean water productivity and daily cumulative clean water productivity. Numerical simulations were performed using MATLAB code. All the calculations are based on a sub-hourly distribution of the direct normal irradiance. The MATLAB code uses the satellite-derived PVGIS data64 to estimate the solar irradiance.
The productivity of the system is significantly affected by the configuration of the SSLFR used.37 In this study, the configuration of the SSLFR that provides the most energy and the smallest footprint has been chosen.37 The SSLFR we consider in this section has the parameters listed in Table 4.
5.1 The climatic conditions of the study
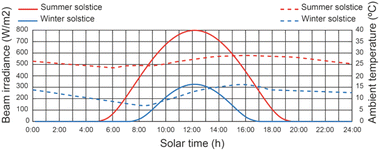
The geographical location of the study is in Almeria, Spain, which has a latitude of 36°50′07′′N, longitude of 02°24′08′′W and an altitude of 22 m. This location lies between latitudes 35°N and 45°N, therefore experiencing significant seasonal variations. The effect of the weather conditions is considered using the method proposed by.65 Fig. 6 shows the beam solar irradiance on a horizontal surface under the meteorological conditions of Almeria (Spain) regarding the solar time on June 21st (summer solstice) and December 21st (winter solstice), the best day of the year and the worst day of the year, respectively. The beam solar irradiance on a horizontal surface, corresponding to solar noon, varies from 325 to 798 W m−2. The ambient temperature variation in relation to the solar time on June 21st and December 21st is shown in Fig. 6. The ambient temperature varies between 19 and 29 °C at the summer solstice and from 8 to 16 °C at the winter solstice.665.2 Effect of operating conditions on thermal fluid temperature of the SSLFR
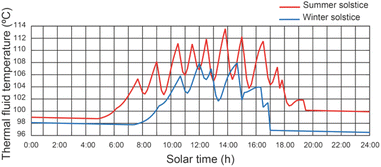
Fig. 7 shows the effect of the operating conditions of the system on the thermal fluid temperature of the SSLFR, with a thermal fluid flow rate equal to 2400 L h−1. It can be observed that the temperature of the thermal fluid decreases when the operating conditions of the disinfection units change. Results show that maximum values of thermal fluid temperature were 113.7 °C and 107.8 °C for summer solstice and winter solstice, respectively, for a thermal fluid flow rate of 2400 L h−1. Therefore, below the design temperature for the heat transfer fluid. Increasing the heat transfer fluid flow rate will reduce the thermal fluid temperature.5.3 Effect of operating conditions on water temperature of the disinfection unit
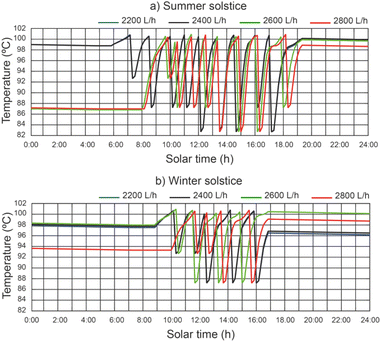
The water temperature in the disinfection unit versus solar hours of the day under different thermal fluid flow rates, different beam solar irradiances and water temperature at the outlet of the filtered water tank equal to 12 °C can be seen in Fig. 8. It should be noted that the recorded values of water temperature were higher during the summer solstice. It has been demonstrated that in the central hours of the day, when solar irradiance is at its highest, the time it takes for the water to reach a temperature of 101 °C is lower than at the beginning and end of the day. It is observed that the highest water temperature values increase with decreasing thermal fluid flow rate. For thermal fluid flow rates of 2200 L h−1 and 2400 L h−1 similar temperature values are obtained.For a thermal fluid rate of 2400 L h−1 in Fig. 9 we can see a comparison of the water temperature in the disinfection unit versus the daily solar hours under different temperatures at the outlet of the filtered water tank and different values of solar irradiance. It is observed that the water temperature at the outlet of the filtered water tank has no appreciable influence on the highest water temperature values. It is noticed that at the end of the day the water temperature is higher than 96 °C, facilitating the next day's operation, since the water temperature at the inlet of the designed disinfection unit is considered equal or higher than 85 °C.
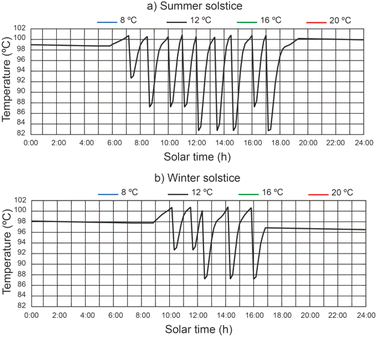 | ||
| Fig. 9 Effect of water temperature at the outlet of the filtered water tank on water temperature in the disinfection unit. | ||
5.4 Effect of operating conditions on filling and emptying of inertia tanks
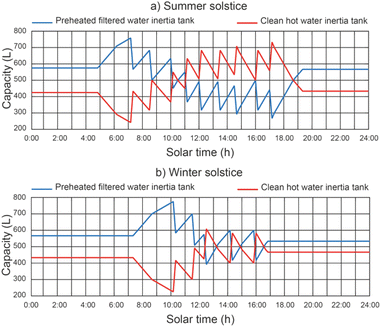
Fig. 10 shows the effect of the operating conditions on the filling and emptying of the inertia tanks, with a thermal fluid rate equal to 2400 L h−1. The results show that the maximum filling values of the preheated filtered water inertia tank were 765.7 L and 780.2 L for the summer solstice and winter solstice respectively, for a thermal fluid flow rate of 2400 L h−1. On the other hand, the maximum filling values of the clean hot water inertia tank were 730.4 L and 610.4 L for the summer and winter solstice, respectively. It can be seen that the level reached by the tanks is always lower than the total capacity of the tanks (800 L). This is due to the fact that the filling of one of the tanks overlaps with the emptying of the other.5.5 Effect of operating conditions on clean water productivity
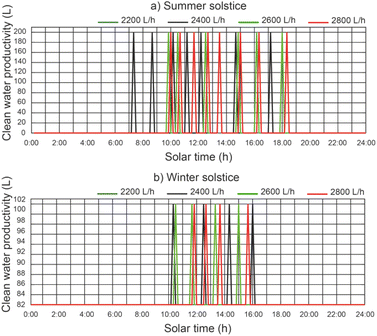
In Fig. 11 we can see a comparison between the productivity of clean water, different thermal fluid flow rates and different beam solar irradiances for a temperature of 12 °C at the outlet of the filtered water tank. It remains the case that for a thermal fluid flow rates of 2200 L h−1 and 2400 L h−1 similar clean water productivity values are obtained. It is observed that for a thermal fluid flow rate of 2400 L h−1, clean water production starts approximately 2 hours earlier than for higher thermal fluid flow rates and ends 1 hour earlier at summer solstice. On the other hand, at winter solstice, the start of clean water production is similar for all thermal fluid flows. Clearly, the maximum clean water productivity is correlated with the maximum solar irradiance. It can be observed that the water level reached by the disinfection units is lower than the capacity of the disinfection units (200 L).In Fig. 12, for a thermal fluid flow rate equal to 2400 L h−1, we can observe a comparison between the clean water productivity versus daily solar hours, under different water temperatures at the outlet of the filtered water tank and different beam solar irradiances. It is observed that the water temperature at the outlet of the filtered water tank has no appreciable influence on the productivity of the clean water.
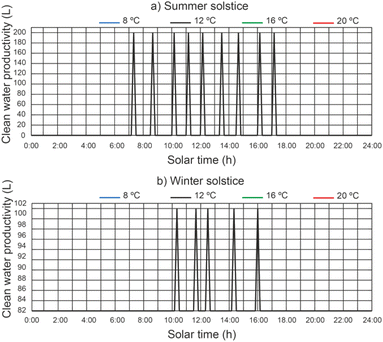 | ||
| Fig. 12 Effect of water temperature at the outlet of the filtered water tank on clean water productivity. | ||
For a thermal fluid flow rate of 2400 L h−1 the maximum daily accumulated clean water productivity values were 357.14 L m−2 day−1 and 198.41 L m−2 day−1 for summer solstice and winter solstice respectively.
5.6 Effect of operating conditions on daily cumulative clean water productivity
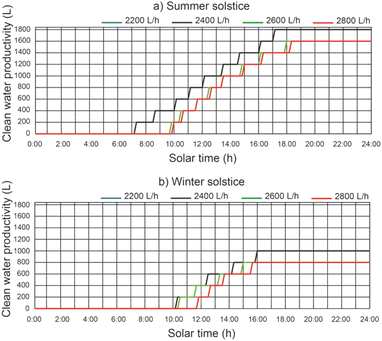
The cumulative daily productivity of clean water versus the daily solar hours under different thermal fluid flow rates, different beam solar irradiance for a water temperature equal to 12 °C at the outlet of the filtered water tank is shown in Fig. 13. It continues to be the case that for a thermal fluid flow rate of 2200 L h−1 and 2400 L h−1, similar values of cumulative daily productivity of clean water. For a thermal fluid flow rate of 2400 L h−1, the results show that the effect on the daily accumulated clean water productivity leads to a maximum value of 1800 L for the summer solstice and 1000 L for the winter solstice. The efficiency of the proposed system was 0.48 for the summer solstice and 0.45 for the winter solstice. For thermal fluid flow rates above 2400 L h−1, the daily cumulative clean water productivity decreases.In Fig. 14, for a thermal fluid flow rate equal to 2400 L h−1, we can observe the daily accumulated productivity of clean water versus the daily solar hours under different water temperatures at the outlet of the filtered water tank and different solar irradiations of the filtered water tank. The effect of the water temperature at the outlet of the filtered water tank on the cumulative daily productivity of clean water has no appreciable influence. This is due to the fact that the inlet water temperature to the preheated filtered water inertia tank ins higher than the designed temperature.
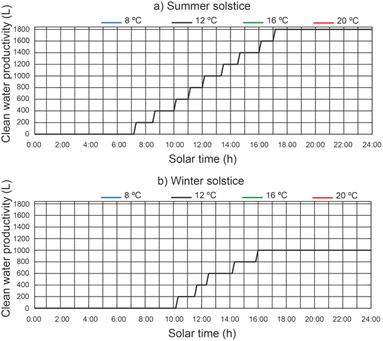 | ||
| Fig. 14 Effect of water temperature at the outlet of the filtered water tank on daily cumulative clean water productivity. | ||
6 Conclusions
This paper describes the details of the design of a solar water disinfection system based on a small-scale linear Fresnel reflector. The proposed system consists of a small-scale linear Fresnel reflector, filtration system, two disinfection units, a heat exchanger, a compressed air system and the control system. The small-scale linear Fresnel reflector reflects and concentrates the solar beam irradiance on the outer surface of the absorber tube. The contaminated water is filtered into the filtration system. In the heat exchanger, the filtered water is preheated and the hot clean water is cooled. In the disinfection units, the preheated filtered water is heated up to the temperature of 100 °C for three minutes. A detailed mathematical model has been developed and solved through an iterative procedure. The system has been studied under different operating conditions, such as beam solar irradiance, ambient temperature, thermal fluid flow rate and water temperature at the outlet of the filtered water tank. The performance of the system has been studied as a function of the temperature of the thermal fluid of the small-scale linear Fresnel reflector, the temperature of water in the disinfection unit, clean water productivity and daily cumulative clean water productivity. The results reveal that (i) for thermal fluid flow rates of 2200 L h−1 and 2400 L h−1 similar values of small-scale linear Fresnel reflector thermal fluid temperature, disinfection unit water temperature, clean water productivity and daily cumulative clean water productivity are obtained; (ii) small-scale linear Fresnel reflector thermal fluid temperature, disinfection unit water temperature, clean water productivity and daily cumulative clean water productivity decreased with increasing thermal fluid flow rate above 2400 L h−1; (iii) water temperature at the outlet of the filtered water tank between 8 and 20 °C does not influence the small-scale linear Fresnel reflector thermal fluid temperature values, disinfection unit water temperature, clean water productivity and daily cumulative clean water productivity; (iv) for a thermal fluid flow rate of 2400 L h−1 the maximum daily accumulated clean water productivity values were 357.14 L m−2 day−1 and 198.41 L m−2 day−1 for summer solstice and winter solstice respectively. The inclusion of a heat exchanger in this system significantly increases its productivity. It is concluded that the proposed solar system offers an environmentally friendly method of water disinfection. The use of this solar water disinfection system in other parts of the world will be studied in the near future.Author contributions
A. Barbón: conceptualization, methodology; D. Vesperinas: software, methodology, writing-original draft preparation; L. Bayón: conceptualization, methodology; D. García-Mollaghan: software, methodology, writing-original draft preparation; M. Ghodbane: revision.Conflicts of interest
There are no conflicts to declare.Acknowledgements
We wish to thank Dr Laudino Rodríguez, head of the CIFP-Mantenimiento y Servicios a la Producción vocational training school in La Felguera, Asturias, Spain, for their work building of the prototype for the design presented in this paper.Notes and references
- United Nations (UN), Sustainable development goals, 2015, available at: https://sdgs.un.org/goals, accessed 04 February 2022 Search PubMed
.
- World Health Organization-United Nations International Children's Emergency Fund (WHO-UNICEF), Updates report of the WHO/UNICEF Joint Monitoring Programme (JMP) report – progress on household drinking water, sanitation and hygiene 2000–2020, 2021, available at: https://www.who.int/news/item/01-07-2021-billions-of-people-will-lack-access-to-safe-water-sanitation-and-hygiene-in-2030-unless-progress-quadruples-warn-who-unicef, accessed 04 February 2022 Search PubMed
.
- BP, Statistical Review of World Energy, 70th edn, 2021, available from: https://www.bp.com/content/dam/bp/business-sites/en/global/corporate/pdfs/energy-economics/statistical-review/bp-stats-review-2021-full-report.pdf, accessed 04 February 2022 Search PubMed
.
- X. Liu, R. Peng, J. Li, S. Wang, X. Li, P. Guo and H. Li, Energy and water embodied in China–US trade: regional disparities and drivers, J. Cleaner Prod., 2021, 328, 129460 CrossRef
.
- P.-C. Chen, V. Alvarado and S.-C. Hsu, Water energy nexus in city and hinterlands: multiregional physical input-output analysis for Hong Kong and South China, Appl. Energy, 2018, 225, 986–997 CrossRef
.
- P. Loubet, P. Roux, E. Loiseau and V. Bellon-Maurel, Life cycle assessments of urban water systems: a comparative analysis of selected peer-reviewed literature, Water Res., 2014, 67, 187–202 CrossRef CAS PubMed
.
- V. G. Gude, Energy and water autarky of wastewater treatment and power generation systems, Renewable Sustainable Energy Rev., 2015, 45, 52–68 CrossRef
.
- D. Lemos, A. C. Dias, X. Gabarrell and L. Arroja, Environmental assessment of an urban water system, J. Cleaner Prod., 2013, 54, 157–165 CrossRef CAS
.
- M. Wakeel, B. Chen, T. Hayat, A. Alsaedi and B. Ahmad, Energy consumption for water use cycles in different countries: a review, Appl. Energy, 2016, 178, 868–885 CrossRef
.
- UNESCO, The United Nations world water development report 2015: water for a sustainable world, UNESCO Publishing, 2015 Search PubMed
.
- World Health Organization (WHO), Progress on drinking water, sanitation and hygiene, World Health Organization Publishing, Geneva, Switzerland, 2017 Search PubMed
.
- World Health Organization (WHO), available from: http://www.who.int/sustainable-development/cities/health-risks/water-sanitation/en/, accessed 22 June 2021.
- J. P. Abraham, B. D. Plourde and W. J. Minkowycz, Continuous flow solar thermal pasteurization of drinking water: methods, devices, microbiology, and analysis, Renewable Energy, 2015, 81, 795–803 CrossRef
.
- A. T. Spinks, R. H. Dunstan, T. Harrison, P. Coombes and G. Kuczera, Thermal inactivation of water-borne pathogenic and indicator bacteria at sub-boiling temperatures, Water Res., 2006, 40, 1326–1332 CrossRef CAS
.
- M. Strazynski, J. Krämer and B. Becker, Thermal inactivation of poliovirus type 1 in water, milk and yoghurt, Int. J. Food Microbiol., 2002, 74, 73–78 CrossRef
.
- S. Bidawid, J. M. Farber, S. A. Sattar and S. Hayward, Heat Inactivation of Hepatitis A Virus in Dairy Foods, J. Food Prot., 2000, 63, 522–528 CrossRef CAS
.
- J. E. Stout, M. G. Best and V. L. Yu, Susceptibility of members of the family Legionellaceae to thermal stress: implications for heat eradication methods in water distribution systems, Appl. Environ. Microbiol., 1986, 52, 396–399 CrossRef CAS PubMed
.
- H. Juffs and H. Deeth, Scientific evaluation of pasteurisation for pathogen reduction in milk and milk products, Food Standards Australia New Zealand, 2007, available from: https://www.foodstandards.gov.au/code/proposals/documents/Scientific%20Evaluation.pdf, accessed 10 June 2021 Search PubMed
.
- S. Sörqvist, Heat resistance in liquids of Enterococcus spp., Listeria spp., Escherichia coli, Yersinia enterocolitica, Salmonella spp. and Campylobacter spp., Acta Vet. Scand., 2003, 44, 1–19 CrossRef PubMed
.
- J. A. Harp, R. Fayer, B. A. Pesch and G. J. Jackson, Effect of pasteurization on infectivity of Cryptosporidium parvum oocysts in water and milk, Appl. Environ. Microbiol., 1999, 52, 2866–2868 Search PubMed
.
- N. Safapour and R. H. Metcalf, Enhancement of solar water pasteurization with reflectors, Appl. Environ. Microbiol., 1999, 65, 859–861 CrossRef CAS PubMed
.
- J. L. Riggs, K. W. DuPuis, K. Nakamura and D. P. Spath, Detection of Giardia lamblia by immunofluorescence, Appl. Environ. Microbiol., 1983, 45, 698–700 CrossRef CAS
.
- S. C. Kehoe, M. R. Barer, L. O. Devlin and K. G. McGuigan, Batch process solar disinfection is an efficient means of disinfecting drinking water contaminated with Shigella dysenteriae type I, Lett. Appl. Microbiol., 2004, 38, 410–414 CrossRef CAS
.
- D. A. Ciochetti and R. H. Metcalf, Pasteurization of naturally contaminated water with solar energy, Appl. Environ. Microbiol., 1984, 47, 223–228 CrossRef CAS PubMed
.
- H. D. Backer, Effect of heat on the sterilization of artificially contaminated water, J. Travel Med., 1996, 3, 1–4 CrossRef
.
- World Health Organization (WHO), Guidelines for drinking-water quality, World Health Organization Publishing, Geneva, Switzerland, 2011 Search PubMed
.
- J. D. Burch and K. E. Thomas, Water disinfection for developing countries and potential for solar thermal pasteurization, Sol. Energy, 1998, 64, 87–97 CrossRef
.
- Y. Taamneh, A. Muthu Manokar, M. Mohamed Thalib, A. E. Kabeel, R. Sathyamurthy and A. J. Chamkha, Extraction of drinking water from modified inclined solar still incorporated with spiral tube solar water heater, Journal of Water Process Engineering, 2020, 38, 101613 CrossRef
.
- M. Vivar, M. Fuentes, J. Torres and M. J. Rodrigo, Solar disinfection as a direct tertiary treatment of a wastewater plant using a photochemical-photovoltaic hybrid system, Journal of Water Process Engineering, 2021, 42, 102196 CrossRef
.
- R. Bigoni, S. Kötzsch, S. Sorlini and T. Egli, Solar water disinfection by a parabolic trough concentrator (PTC): flow-cytometric analysis of bacterial inactivation, J. Cleaner Prod., 2014, 67, 62–71 CrossRef
.
- E. A. Onyango, T. F. N. Thoruwa, S. M. Maingi and E. M. Njagi, Performance of 2-element plane reflector augmented galvanised pipe flat plate collector for solar water pasteurization, J. Food Technol., 2009, 7, 12–19 Search PubMed
.
- G. Carielo da Silva, C. Tiba and G. M. Torres, Solar pasteurizer for the microbiological decontamination of water, Renewable Energy, 2016, 87, 711–719 CrossRef CAS
.
- H. H. El-Ghetany and A. A. Dayem, Numerical simulation and experimental validation of a controlled flow solar water disinfection system, Journal Desalination and Water Treatment, 2010, 20, 11–21 CrossRef CAS
.
- S. Kalogirou, Solar thermal collectors and applications, Prog. Energy Combust. Sci., 2004, 30, 231–295 CrossRef CAS
.
- M. Ghodbane, E. Bellos, Z. Said, B. Boumeddane, A. Kadhim Hussein and L. Kolsi, Evaluating energy efficiency and economic effect of heat transfer in copper tube for small solar linear Fresnel reflector, J. Therm. Anal. Calorim., 2021, 143, 4197–4215 CrossRef CAS
.
- N. El Gharbia, H. Derbalb, S. Bouaichaouia and N. Said, A comparative study between parabolic trough collector and linear Fresnel reflector technologies, Energy Procedia, 2011, 6, 565–572 CrossRef
.
- A. Barbón, L. Bayón, C. Bayón-Cueli and N. Barbón, A study of the effect of the longitudinal movement on the performance of small scale linear Fresnel reflectors, Renewable Energy, 2019, 138, 128–138 CrossRef
.
- I. B. Askari and M. Ameri, Techno economic feasibility analysis of linear Fresnel solar field as thermal source of the MED/TVC desalination system, Desalination, 2016, 394, 1–17 CrossRef CAS
.
- M. Ghodbane, B. Boumeddane, Z. Said and E. Bellos, A numerical simulation of a linear Fresnel solar reflector directed to produce steam for the power plant, J. Cleaner Prod., 2019, 231, 494–508 CrossRef
.
- R. Singh, Modeling and performance analysis of linear Fresnel collector for process heat generation for ice cream factory in Konya, MS Thesis, Middle East Technical University, 2017
.
- J. Rawlins and M. Ashcroft, Report: small-scale concentrated solar power – a review of current activity and potential to accelerate employment,
carbon trust, 2013 Search PubMed
.
- M. Ghodbane, B. Boussad and S. Noureddine, A linear Fresnel reflector as a solar system for heating water: theoretical and experimental study, Case Studies in Thermal Engineering, 2016, 8, 176–186 CrossRef
.
- F. J. Pino, R. Caro, F. Rosa and J. Guerra, Experimental validation of an optical and thermal model of a linear Fresnel collector system, Appl. Therm. Eng., 2013, 50, 1463–1471 CrossRef
.
- A. Serag-Eldin, Thermal design of a roof-mounted CLFR collection system for a desert absorption chiller, Int. J. Sustainable Energy, 2014, 33, 506–524 CrossRef
.
- N. Velázquez, O. García-Valladares, D. Sauceda and R. Beltrán, Numerical simulation of a linear Fresnel reflector concentrator used as direct generator in a Solar-GAX cycle, Energy Convers. Manage., 2010, 51, 434–445 CrossRef
.
- A. Barbón, J. A. Sánchez Rodríguez, L. Bayón and N. Barbón, Development of a fiber daylighting system based on a small scale linear Fresnel reflector: theoretical elements, Appl. Energy, 2018, 212, 733–745 CrossRef
.
- A. Barbón, J. A. Sánchez-Rodríguez, L. Bayón and C. Bayón-Cueli, Cost estimation relationships of a small-scale linear Fresnel reflector, Renewable Energy, 2019, 134, 1273–1284 CrossRef
.
- A. Barbón, L. Bayón, N. Barbón, J. A. Otero, C. Bayón-Cueli, L. Rodríguez and F. Salgero, Concentrador solar lineal Fresnel con triple movimiento, Spain Pat., ES2601222(B1), 2017 Search PubMed
.
- A. Barbón, C. Lopez-Smeetz, L. Bayón and A. Pardellas, Wind effects on heat loss from a receiver with longitudinal tilt angle of small-scale linear Fresnel reflectors for urban applications, Renewable Energy, 2020, 162, 2166–2181 CrossRef
.
- A. F. Mills, Heat transfer, Prentice Hall, 2nd edn, 2005 Search PubMed
.
- A. Barbón, J. A. Fernández-Rubiera, L. Martínez-Valledor, A. Pérez-Fernández and L. Bayón, Design and construction of a solar tracking system for small-scale linear Fresnel reflector with three movements, Appl. Energy, 2021, 285, 116477 CrossRef
.
- A. Barbón, N. Barbón, L. Bayón and J. A. Otero, Optimization of the length and position of the absorber tube in small-scale linear Fresnel concentrators, Renewable Energy, 2016, 99, 986–995 CrossRef
.
- A. Barbón, N. Barbón, L. Bayón and J. A. Sanchez-Rodríguez, Parametric study of the small-scale linear Fresnel reflector, Renewable Energy, 2018, 116, 64–74 CrossRef
.
- Y. Zhu, J. Shi, Y. Li, L. Wang, Q. Huang and G. Xu, Design and thermal performances of a scalable linear Fresnel reflector solar system, Energy Convers. Manage., 2017, 146, 174–181 CrossRef
.
- Y. Zhu, J. Shi, Y. Li, L. Wang, Q. Huang and G. Xu, Design and experimental investigation of a stretched parabolic linear Fresnel reflector collecting system, Energy Convers. Manage., 2016, 126, 89–98 CrossRef
.
- J. A. Duffie and W. A. Beckman, Solar Engineering of Thermal Processes, John Wiley & Sons, 2013 Search PubMed
.
- V. M. Sharma, J. K. Nayak and S. B. Kedare, Effects of shading and blocking in linear Fresnel reflector field, Sol. Energy, 2015, 113, 114–138 CrossRef
.
- P. H. Theunissen and W. A. Beckman, Solar transmittance characteristics of evacuated tubular collectors with diffuse back reflectors, Sol. Energy, 1985, 35, 311–320 CrossRef
.
- M. Cagnoli, D. Mazzei, M. Procopio, V. Russo, L. Savoldi and R. Zanino, Analysis of the performance of linear Fresnel collectors: encapsulated vs. evacuated tubes, Sol. Energy, 2018, 164, 119–138 CrossRef
.
- A. Barbón, C. Bayón-Cueli, L. Bayón and P. Fortuny Ayuso, Influence of solar tracking error on the performance of a small-scale
linear Fresnel reflector, Renewable Energy, 2020, 162, 43–54 CrossRef
.
- M. J. Montes, R. Abbas, M. Muñoz, J. Muñoz-Antón and J. M. Martínez-Val, Advances in the linear Fresnel single-tube receivers: hybrid loops with non-evacuated and evacuated receivers, Energy Convers. Manage., 2017, 149, 318–333 CrossRef
.
- V. Gnielinski, New equations for heat and mass transfer in turbulent pipe and channel flow, Int. Chem. Eng., 1976, 6(2), 359–368 Search PubMed
.
- M. Siddique and M. Alhazmy, Experimental study of turbulent single-phase flow and heat transfer inside a micro-finned tube, Int. J. Refrig., 2008, 31, 234–241 CrossRef CAS
.
- Joint Research Centre (JRC), PVGIS, 2022, https://ec.europa.eu/jrc/en/pvgis Search PubMed
.
- A. Barbón, P. Fortuny Ayuso, L. Bayón and J. A. Fernández-Rubiera, Predicting beam and diffuse horizontal irradiance using Fourier expansions, Renewable Energy, 2020, 154, 46–57 CrossRef
.
- Meteonorm, Meteonorm global meteorological database–handbook, version 7.3.4, 2020 Search PubMed
.
| This journal is © The Royal Society of Chemistry 2023 |

