 Open Access Article
Creative Commons Attribution 3.0 Unported Licence
Machine learning of isomerization in porous molecular frameworks: exploring functional group pair distance distributions†‡
Maryam
Nurhuda
 a,
Yusuf
Hafidh
b,
Cansu
Dogan
a,
Daniel
Packwood
c,
Carole C.
Perry
a,
Yusuf
Hafidh
b,
Cansu
Dogan
a,
Daniel
Packwood
c,
Carole C.
Perry
 a and
Matthew A.
Addicoat
 *a
*a
aSchool of Science and Technology, Nottingham Trent University, Clifton Lane, Nottingham, NG11 8NS, UK. E-mail: matthew.addicoat@ntu.ac.uk
bInstitut Teknologi Bandung, Jl. Ganesa No. 10, Lb. Siliwangi, Bandung, 40132, Indonesia
cKyoto University, Institute for Integrated Cell and Materials Science, Institute for Advanced Study, Kyoto 6068501, Japan
First published on 28th July 2023
Abstract
Molecular Framework Materials (MFMs), including Metal Organic Frameworks (MOFs), Covalent Organic Frameworks (COFs) and their discrete equivalents, Metal Organic Polyhedra (MOPs) and Porous Organic Cages (POCs) are porous materials, composed of molecular fragments, bound in one of many topologies. MFMs have a wide variety of potential and realised adsorption applications. In order to design an ideal framework material for a particular application, the composition of molecular fragments is not the only factor, but the arrangement of the those fragments is also important, especially when the fragments (molecular building blocks) are chemically functionalized and lack symmetry. As has been observed in metal organic frameworks, the flexibility and absorption properties may differ greatly when altering the orientation of the building units or changing the position of functional groups. However, although the position of the functional groups has a great influence on a targeted property, studies on functional group arrangements have only been performed on a small set of MOF structures. In this contribution, we develop a fingerprint/descriptor for optimising functionalized molecular framework structures using machine learning. We begin from the perspective of a molecular framework structure described as a collection of discrete pore shapes. To describe the chemical environment of the pore, we derive a fingerprint based on the occurrence of pairwise distances between functional groups in each pore. We present the possibilities of functional group arrangements in the 14 most common pore shapes, created by ditopic (2-connected) linkers. The method to enumerate and identify possible isomers is explained. Finally the performance of the fingerprint on predicting guest molecule binding energy is demonstrated.
1 Introduction
Metal Organic Frameworks (MOFs) are porous crystalline materials composed of metal oxide building units linked by organic linkers. The chemical diversity, especially the possibility of tunable host guest interaction, gives MOFs great potential for a wide variety of applications, not limited to energy storage,1 gas or molecule separation,2 sensing, water harvesting and purification, nano-catalysis,3 and drug delivery.4–6 There are a number of strategic solutions to fine-tune the physical and chemical properties of MOFs, starting from varying their building blocks,3,7 adding defects,8,9 tailoring functional groups,10 or by exploring other framework isomers.11Isomerism is a structural phenomenon, where a chemical substance – a molecule or material has the same stoichiometry, but is different in the local structure, leading to two or more related structures. In MOFs, this condition could arise from a number of factors as classified by Zhou et al.,11 including MOFs with the same component building units but different conformation (i.e. flexible MOFs),12 interpenetrating structures,13 and MOFs with a specified topology but consisting of low symmetry building blocks, such that changing the orientation of the building block will create another isomer.14,15
Framework isomerism is interesting to examine in detail, either considering each individual isomer or collectively, as it has been found to influence properties such as flexibility and adsorption.16 Conformational isomerism is reported to impact the collective flexibility in DUT-8, a MOF with Ni2 paddlewheels, 1,4-diazabicyclo[2.2.2]octane (dabco) pillars and naphthalene dicarboxylate (ndc) linkers. In recent work by Petkov et al.,17 by using DFT calculations they observed the wine-rack movement of the stable isomers of DUT-8 originated from the long-range orientation of the linkers, which may point “up” or “down” relative to each paddlewheel building block. They discovered that the isomers possess different energy barriers to transform from the open form to the closed form, which results in reduced flexibility in one of the isomers. The energy barrier difference arises due to the different relative alignment of the naphthalene building blocks.
Wang et al.,18 investigated the impact of ligand-originated isomerism and ligand functionalization on gas adsorption of NbO type MOFs. Using two methoxy-functionalized diisophthalate linkers, differing in the orientation of the central part of the linker and consequently, the position of the methoxy groups, they characterise two isoreticular MOFs ZJNU-58 and ZJNU-59, which show different gas uptake and selectivity performance. The orientation of the linker in ZJNU-59 creates a narrower pore size which increases the van der Waals potential overlap thus strengthening the interaction between gas molecules and the framework.
One of the most frequent modifications to tune the chemistry of MOFs is linker functionalization – e.g. UiO-66,19 NH2-UiO-66,20 Cl-UiO-66,21 yet there are very limited studies on the effect of positional isomerism of these functional groups to the resulting (absorption) properties. In general, functionalization adds more binding sites to the MOF structure. But adding functional groups may or may not lead to a better separation capability due to steric hindrance and/or altered pore or window size.22 A methodological approach is therefore needed to understand the potential diversity in positional functional group isomerism, and how these isomers affect the resultant properties of the framework, which will eventually lead to design rules for a particular application.
However, the addition of a simple functional group into MOF linkers creates a huge complexity in the framework; the number of isomers increasing exponentially with the number of functionalized linkers.23–25 As an example, in Fig. 1, suppose that the linker is a simple benzene-1,4-dicarboxylic acid (bdc), for which there are 4 hydrogen atoms where a functional group could be substituted. If the system is functionalized by one functional group per bdc linker, the number of possible isomers is 4 to the power of the number of linkers, minus any duplicates arising due to symmetry of the framework. In the case of a MOF, which is typically periodic in three dimensions, considering all linkers distinctly would lead to an incredibly large number of linkers. Considering the number of isomers of even a unit cell of UiO-66 (CCSD Refcode: RUBTAK, 24 linkers) is intractably large: the chemical formula for UiO-66 is C48H28O32Zr6, but for one unit cell, Z = 4, so the molecular weight of one unit cell of UiO-66 is 6656.24 g mol−1, there are, therefore, 9.047 × 10¹⁹ unit cells per g of UiO-66 and, given there are 24 bdc linkers per unit cell, 2.171 × 10²¹ linkers per g.
To make this tractable, we consider isomerization at the pore level. This is chemically justifiable as any individual guest molecule will ‘see’ only one pore environment at a time, and also allows application to discrete molecular cages. At the pore level then, every pore isomer is noteworthy as it has a different potential surface and represents a different environment for the guest molecule, especially where the guest molecule is of sufficient size to interact with multiple functional groups on different pore walls. Even in the comparatively small case of a square D4h ‘cage’ with four bdc linkers, there are a total of 256 possible isomers, of which 39 are unique. A full illustration of this example, including a python notebook is included in the ESI Section S4.‡
Returning to the example of (mono-functionalized) UiO-66: each UiO-66 unit cell contains 4 octahedral pores (generated by coordinates (0.5, 0.5, 0.5)) and 8 tetrahedral pores (generated by coordinates (0.25, 0.25, 0.25)). This means that in 1 g of UiO-66, there are: 4 × 9.047 × 1019 = 3.169 × 10²⁰ octahedral pores and 8 × 9.047 × 1019 = 7.238 × 10²⁰ tetrahedral pores. Dividing by the number of isomers of the octahedral (351![[thin space (1/6-em)]](https://www.rsc.org/images/entities/char_2009.gif) 976) and tetrahedral pores (176) (tabulated for all pores in ESI Section S1‡) gives the number of times each pore isomer would occur in 1 g of UiO-66: 1.028 × 10¹⁵ times for the octahedral pore and 4.112 × 10¹⁸ times for the tetrahedral pore. A guest/adsorbate molecule may therefore encounter each/every pore isomer many times and modeling adsorption of a guest molecule in UiO-66, or indeed any 0–3D MOF/COF/MOP/POC, requires accessing and describing the “average” pore, somehow summed over every possible pore isomer. In this work, we present such a description.
976) and tetrahedral pores (176) (tabulated for all pores in ESI Section S1‡) gives the number of times each pore isomer would occur in 1 g of UiO-66: 1.028 × 10¹⁵ times for the octahedral pore and 4.112 × 10¹⁸ times for the tetrahedral pore. A guest/adsorbate molecule may therefore encounter each/every pore isomer many times and modeling adsorption of a guest molecule in UiO-66, or indeed any 0–3D MOF/COF/MOP/POC, requires accessing and describing the “average” pore, somehow summed over every possible pore isomer. In this work, we present such a description.
Typically, the absorption properties of framework materials such as MOFs are computed using the Grand Canonical Monte Carlo (GCMC) method. It is possible to do GCMC simulations for a small number of positional functionalization isomers, however, due to the extremely large number of possible structures the procedure needs to be incorporated into (stochastic) optimisation algorithms26,27 or machine learning approaches. Machine learning is a very attractive research area, because it can accelerate the discovery of top performing MOFs. Machine learning in general, learns patterns from provided data to make a simpler model that connects input and output. Each MOF candidate is linked to a descriptor, which can discriminate between MOFs and contains the important features that reflect the targeted property. Choosing a descriptor is the most crucial step in a machine learning procedure;28 if a descriptor has low correlation to the property of interest, the model will have poor predictive performance and may be difficult to interpret.29
A variety of descriptors have been developed for MOFs and COFs, that fall into one or more classes based on the features they take into account: geometric descriptors may describe the global geometry, the local geometry or both and typically include features such as largest pore diameter, limiting pore diameter, void fraction, framework density, volumetric and gravimetric surface area. Geometric descriptors are typically easily computable and are well suited to problems involving gas uptake and selectivity.
Chemical descriptors represent a second class of descriptor, and include features such as the number and type of atoms, and possibly further information about the atomic environment, such as the electronegativity, electron affinity or force field parameter type.30 Chemical descriptors for M/COFs often take advantage of the reticular nature of the structure by including information about the building blocks.31 A more sophisticated descriptor combining both geometric and chemical descriptors based on radial distribution functions weighted by an atomic property, such as electronegativity, polarizability and van der Waals volume has been used for predicting gas uptake capacities.32 Two recent works33,34 have employed Pair Distribution Functions, PDFs, to describe MOF structure, especially where defects alter the structure.
Two further classes of descriptors for M/COFs are energy and topology-based. Energy-based descriptors are especially useful for adsorption applications but require the expensive step of computing a potential energy surface of the MOF interacting with a probe, which may be arbitrary (e.g. a spherical charge distribution corresponding to a particular kinetic diameter) or a real molecule.35–38 The final class of descriptors employed for M/COFs are topological descriptors that aim to describe the pore connectivity over multiple length scales.39–42
To develop our descriptor, we consider the fact that host–guest interactions occur mainly by the influence of local interaction, thereby only including a small effect from the linkers in adjacent pores. In addition, while there are 2941 3D topologies (nets) reported in the RCSR database43 to date, they consist of repeating a limited number of pore shapes, such as cubic, tetrahedral, octahedral, square antiprism and cuboctahedral. These two considerations combined, brings us to observe and isolate the potential created by each functionalized pore shape. To describe the distribution of chemically important functional groups, we consider only the key atoms of each functional group (e.g. the N atom of the NH2 group) and neglect the rest of the framework, effectively resulting in a simplified PDF representing the distances between pairs of functional groups in each MOF pore.
Combinatorial enumeration of chemical structures, including isomers is a well-known area of chemical mathematics.44,45 In this work, we have enumerated all possible functional group arrangements for common pore geometries, and developed a fingerprint (represented by a histogram) for characterising the dissimilarity between pore environments based on a quantification of their functional group–functional group (FG–FG) distance distribution. We propose this descriptor to be useful for molecular framework materials, such as MOFs and COFs46 as well as discrete porous cages such as Metal Organic Polyhedra (MOPs)47 and porous organiccages.48–51 Finally, we demonstrate the descriptor applicability to predict the binding energy of drug propranolol to different isomers of an NH2-UiO-66 octahedral pore.
2 Computational method
General pore shapes have already been listed in the context of porous organic cages.52 From the 20 pores (cages) identified, we focus on those having a ditopic (2-connected) linker. There are 15 pore shapes that meet this criterion, as shown in Fig. 2, we adopt the pore nomenclature and topologies from the organic cage topology classification designed by Jelfs and coworkers, where Di, Tri and Tet are used to indicate ditopic, tritopic and tetratopic building blocks respectively and the following (superscript) numbers indicate the number of each building block required to compose the pore/cage structure.52 The pore structures are constructed with metal nodes of radius ≈ 5 Å, chosen to reproduce the approximate size of the Zr6O building block, and benzene-1,4-dicarboxylic acid (bdc) and poly(1,4-benzenedicarboxylic acid) (pbdc) for the ditopic linkers. The orientation of the benzene plane is placed such that the structure will have the highest symmetry point group. Accordingly, each of the hydrogen atoms on the benzene linker could be located in one of two distinct orientations, either pointing into the centre of the pore or pointing outside the pore.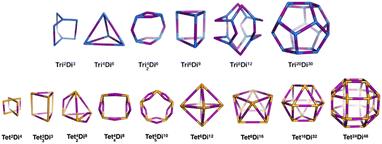 | ||
| Fig. 2 The 15 pore shape topologies analysed in this work. Topology and nomenclature adopted from the work of Jelfs and coworkers.52 Upper line is the tritopic + ditopic topology family, vertices are in blue, ditopic linkers in purple. Lower line is the tetratopic + ditopic topology family, vertices are in orange, ditopic linkers in purple. Of these topologies, the Tet42Di8 topology is excluded from this work as no crystal structures of this topology are yet reported and the topology is not contained within the stk package.53 | ||
The functional group added to the linker is a nitrogen atom (representing an amine group) with C–N bond distance 1.47 Å and the FG–FG distance is measured between two nitrogen atoms. An example of a pore structure, Tet2Di4, constructed using these rules is presented in Fig. 3(c). To show the relationship between our constructed pore structure and a real chemical structure, Fig. 3(a) shows the only known example of the Tet2Di4 topology, LUXVAB,54Fig. 3(b) shows LUXVAB in partial skeleton form, then Fig. 3(c) replaces the alkyl linkers with the phenyl linkers that we consider in this paper. The enumeration performed to the pore structure is based on 1×-functionalization or one functional group per linker. The pore structures are constructed partly using the python package supramolecular toolkit (stk).53
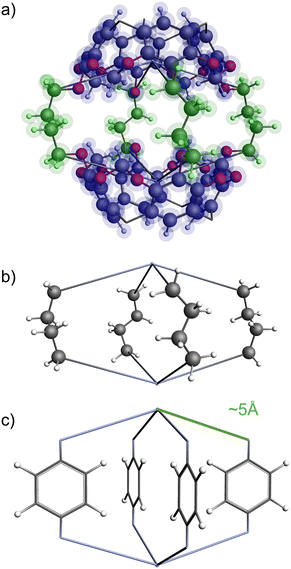 | ||
| Fig. 3 (a) Crystal structure of LUXVAB54 with 4-connected (Tet) and 2-connected (Di) building blocks highlighted in blue and green respectively. (b) Linkers extracted from LUXVAB and connected to an arbitrary node placed at the COM of the 4-connected building block. (c) Example of a pore structure, Tet2Di4, constructed with an arbitrary (metal or organic) node of radius ≈ 5 Å and a benzene linker. | ||
The procedure to generate and enumerate the isomers of each pore is as follows:
(1) Enumeration of all possible isomers
After constructing all of the pore shape structures, functionalization is applied. Every combination of functional group position in the benzene linkers are enumerated. The number of pore isomers for each topology is listed in the ESI Section S1.‡ However due to the orientation of the pore, some isomers could be equivalent by symmetry, thus only the unique structures are collected, while duplicates are eliminated. To examine if a structure is unique, each conformational isomerism transformed by its symmetry operations, then if an overlapping structure is found, the isomer will be identified as a duplicate, otherwise it is a unique isomer. The detailed algorithm is explained in the ESI Section S3.‡
(2) Counting the number of unique structures using group theory
The number of unique isomers is also computed using the Cauchy–Frobenius theorem.55 The total number of unique structures is given by equation:
| x∈G |
| x·h = h |
(3) Counting the functional group–functional group distance frequency
The histogram shows the frequency of every pair distance that exists in the pore, Fig. 4 is an example of the Tet2Di4 histogram. The sum of the frequencies of the whole histogram equals the number of FG–FG pairs, and the number of FG–FG pairs is equal to:
| Npairs = C(nFG, 2) − nLinkers C(4,2) =C(16, 2) −4 C(4,2) = 96. |
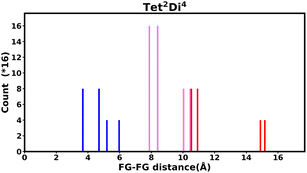 | ||
| Fig. 4 Example of the fingerprint histogram, Tet2Di4, showing the frequency of every possible FG–FG distance. Each distance is colour-coded according to whether both FG are inside the pore (blue), outside of the pore (red), or one inside and one outside (violet), as described in Table 1. | ||
| Colour | FG pair position |
|---|---|
| Blue | In–In |
| Violet | In–Out |
| Red | Out–Out |
By iterating through all pairs, the distance and the frequency of the pair is computed. When considering all the possible isomers, the histogram of FG–FG distance frequency will have larger y-values but the same distribution, with the scale of: 1![[thin space (1/6-em)]](https://www.rsc.org/images/entities/char_2009.gif) :
:![[thin space (1/6-em)]](https://www.rsc.org/images/entities/char_2009.gif) 0.0625 × 4n linker. The foundation for the same distribution is because each FG position has the same occurrence in the isomer enumeration. In one isomer, the probability of occurrence of every FG position on one linker is 0.25. Therefore, the occurrence of an FG–FG pair is 0.25 × 0.25 which equals 0.0625.
0.0625 × 4n linker. The foundation for the same distribution is because each FG position has the same occurrence in the isomer enumeration. In one isomer, the probability of occurrence of every FG position on one linker is 0.25. Therefore, the occurrence of an FG–FG pair is 0.25 × 0.25 which equals 0.0625.
(4) Generation of FG–FG distance histogram
The FG–FG distance frequencies are plotted as histograms with three colour coding, representing the relative positions of the functional groups with respect to the pore, as shown in Fig. 5. The orientation of the linker puts the functional group into two distinct positions, either pointing inside, “In” or outside, “Out” of the pore of interest. As the “In–In” pair is of most relevance to a molecule binding inside the pore, we have separated and labelled each distance with different colours.
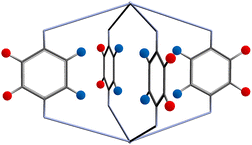 | ||
| Fig. 5 Two possible functional group positions: pointing into the pore shown as blue circles, and outside the pore shown as red circles. | ||
3 Results and discussion
The histograms of 14 pore shapes are presented in the ESI Section S5‡ and the raw counts for both mono-functionalized bdc and pbdc linkers is included in the ESI‡ as a spreadsheet. One pore shape, Tet42Di8, is excluded as no crystal structures of this topology are yet reported. Two different size of linkers are used (Fig. 6). The first one is the linker bdc and the second one is the pbdc linker. In the case of the pbdc linker two non-interconvertible types of mono-functionalization are possible – the four outer positions or the inner four positions. All three histograms for each topology are presented in ESI Section S5.‡ For prediction of bulk properties, we contend that these histograms represent the “average” or likely environment that a guest molecule may encounter, however the FG–FG distances for each individual isomer may be presented in the same way, and we show this in ESI Section S6.‡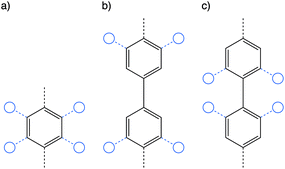 | ||
| Fig. 6 The three linkers used for constructing the pore structure, bdc (a) and pbdc with outer (b) and inner (c) functionalization. | ||
3.1 Histograms for selected pore structures
3.2 Effect of linker size
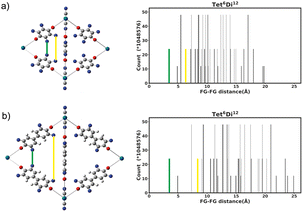
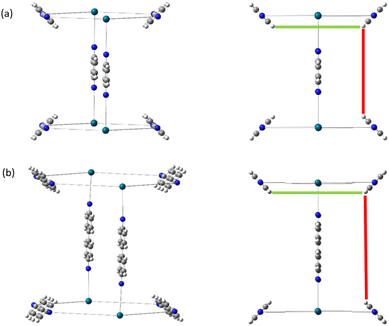
Generally changing the size of the linker to a longer linker will enlarge the void space of the pore. The histogram will consist of the same components, only the positions of each bar will be shifted. Each individual FG–FG distance is affected to a different extent by enlarging the pore (i.e. isotropic expansion of the pore does not result in even expansion of all FG–FG distances). Fig. 10a shows Tet6Di12 using linker bdc, and Fig. 10b shows Tet6Di12 using linker pbdc, the pair distances shown in green lines are the same for the two pores, however the yellow line is shifted from 6.3 Å to 10.7 Å.As a consequence of these distances scaling by different proportions, it is possible that several FG–FG distances may merge (i.e. overlap in the histogram), or conversely, one FG–FG distance may split into several distinct distances. In this work, these effects are not seen, because the pore structures constructed using the stk program53 maintain the point group of the shape, thus although a substitution of a longer linker is performed, the nodes adjust to a size where the resulting structure always has the same aspect ratio. In practice, however, we expect that FG–FG distances may merge or split. An example of where this would be expected to occur is in the Tri42Di6 pore topology, when the pore structure is constructed from a fixed size node and a variable size linker. Fig. 11a shows the pore structure using the bdc linker, the green and the red line are at the same distance. When the linker is substituted with pbdc, the red line will expand, while the green line will remain the same, as shown in Fig. 11b. Thus the corresponding bar in the histogram will split into two.
3.3 Effect of linker rotation
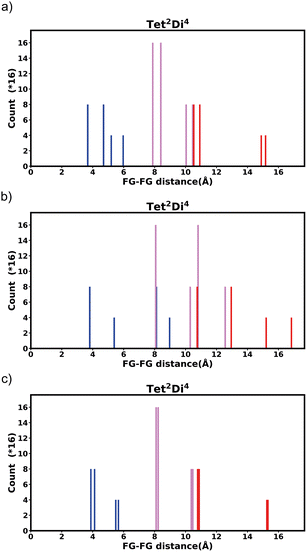
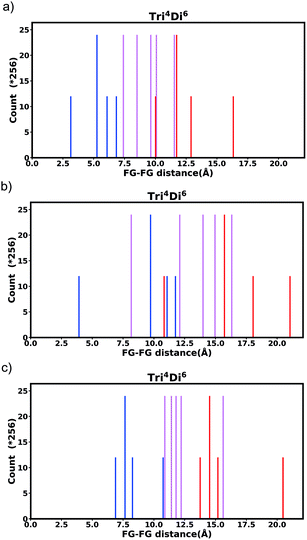
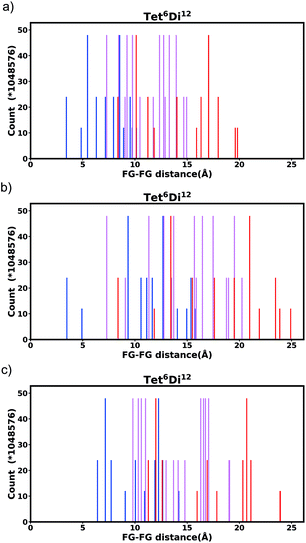
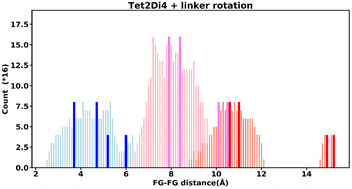
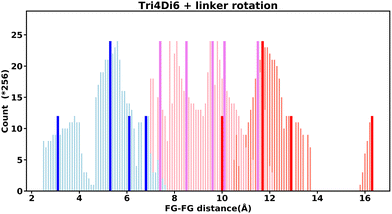
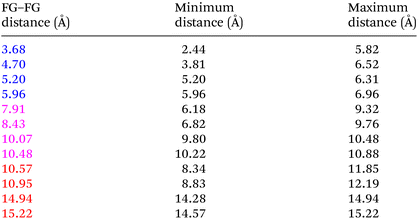
Even “rigid” MOFs possess some degree of flexibility where the organic linker can rotate about the linker axis. Consequently, the distances for every pair can deviate from the original, symmetric position. To consider the effect of such linker rotation, we rotate each linker through ±30°, keeping the centre of rotation (i.e. the centre of the linker along the connector axis) fixed. For each FG–FG distance in the original descriptor, we rotate each of the two linkers through the ±30° range in 1° increments (i.e. a double loop) and record the minimum and maximum distance that can be attained. Table 2 lists the minima and maxima for each FG–FG distance in the Tet2Di4, the Tri4Di6 (tetrahedral), Tet6Di12 (octahedral) pores are provided in the ESI Section S7.‡ The inclusion of linker rotation to the histograms in Fig. 12 and 13 assume no rotation barrier, addition of a rotation barrier would restrict the tails of each peak.3.4 Covariance of topology histograms
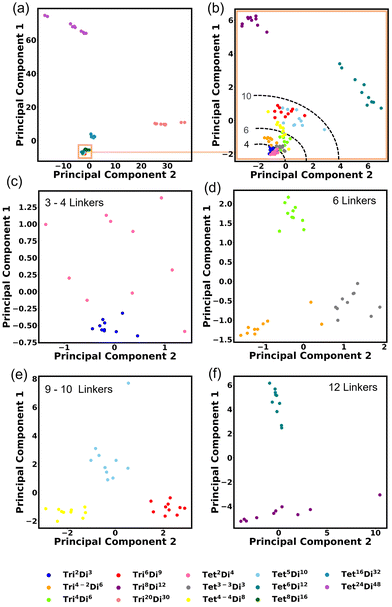
We investigated the covariance contained in each individual FG pair distance histogram by performing Principal Component Analysis (PCA). A reasonable separation between each topology is shown. This degree of separation is satisfactory considering that the topologies would be projected into non-linear space when inserted into a machine-learning algorithm. The first PCA is performed on all topologies Fig. 14a and the first two principal components explain 78.66% of the variance. Three topologies are shown clearly to be separated by size, these are Tri20Di30, Tet16Di32 and Tet24Di48. Closer inspection of Fig. 14a, reveals a fourth large cage topology, Tet8Di16 that also separates from the smaller cages. Fig. 14b shows a second PCA computed, excluding the four large cage topologies, in this case, 42.30% of the variance is explained by the first two principal components. Noting that in these two analyses, the clearest separation is of the largest topologies, we undertook PCA on only topologies of similar size, as indicated by the number of linkers, these are shown in Fig. 14c–f, for 3–4, 6, 9–10 and 12 linkers respectively. These plots show clear grouping of each topology and the top two principal components explain 43.20%, 39.85%, 55.03% and 66.39% of the variance for Fig. 14c–f respectively.3.5 Kernel density estimation (KDE)
Histograms, as presented, are sensitive to the choice of bin size. To employ our descriptor for machine learning, we smoothed each histogram using KDE with a Gaussian kernel and bandwidth of 0.1. The KDEs for each pore topology are shown in ESI Section S8.‡4 Implementation in machine learning
UiO-66 is potentially used to bind pharmaceutical molecules as either a drug delivery agent or adsorbent for filtering pharmaceutical waste from water. For either of these cases, a strong binding energy of the target molecule to the MOF is an indicator for good adsorption performance. We demonstrate our FG pair distance descriptor's applicability to predict the binding energy of the common drug, propranolol to NH2-UiO-66.4.1 Dataset preparation
The octahedral pore of UiO-66 (equivalent to topology Tet6Di12) is prepared for the input structure of the machine learning. The octahedral cage has 354![[thin space (1/6-em)]](https://www.rsc.org/images/entities/char_2009.gif) 024 unique isomers as listed in Table S1,‡ but in this demonstration we have chosen 3223 representative isomers. The 3223 isomers are selected based on geometric features which are explained in detail in ESI Section S10.‡
024 unique isomers as listed in Table S1,‡ but in this demonstration we have chosen 3223 representative isomers. The 3223 isomers are selected based on geometric features which are explained in detail in ESI Section S10.‡
A propranolol molecule is placed inside each cage isomer. However, since the propranolol could bind to different parts of the cage, we prepared a set of ten different propranolol positions for each cage isomer, generated randomly using the Kick3 program.56 The cages (with propranolol molecule inside) are relaxed to their stable position using GFN-xTB, and binding energies are computed. Detailed explanation about dataset collection can be found in ESI Section S11.‡
4.2 Machine learning using our functional group pair distance descriptor
A neural network was trained to predict the propranolol binding energy using the dataset above. Input features were obtained by discretizing the histograms of in–in FG–FG distances after applying Kernel Density Estimation (KDE), resulting in 68 discrete bins. The neural network consisted of a single hidden layer comprising 6 nodes, trained using the scikit-learn Python package using the L-BFGS algorithm.The dataset is then divided into 80![[thin space (1/6-em)]](https://www.rsc.org/images/entities/char_2009.gif) :
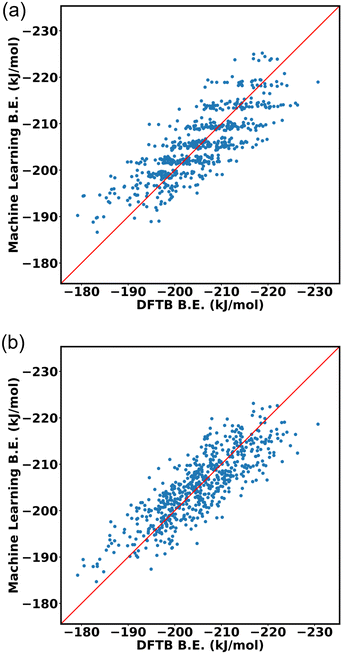
:![[thin space (1/6-em)]](https://www.rsc.org/images/entities/char_2009.gif) 20 ratio for training data and testing data. The input of the machine learning is the cage isomer functional group pair distance histogram and the response value f(x) of each cage isomer is the average binding energy. After training the 80% data on the neural network, the remaining 20% of the data are tested on the trained model. Finally, the binding energy of test data is compared, binding energy from machine learning versus binding energy from GFN-xTB calculation as shown in Fig. 15a. We achieved a good prediction rate of machine learning using our descriptor with RMSE of 11.81 kJ mol−1 and R2 equal to 0.67.
20 ratio for training data and testing data. The input of the machine learning is the cage isomer functional group pair distance histogram and the response value f(x) of each cage isomer is the average binding energy. After training the 80% data on the neural network, the remaining 20% of the data are tested on the trained model. Finally, the binding energy of test data is compared, binding energy from machine learning versus binding energy from GFN-xTB calculation as shown in Fig. 15a. We achieved a good prediction rate of machine learning using our descriptor with RMSE of 11.81 kJ mol−1 and R2 equal to 0.67.
In addition, we explore the combination of additional descriptors that capture the functional group density distribution into the input feature vector. These descriptors include the representations of functional groups in groups up to three bodies (detailed explanation in ESI Section S10‡). Upon combining these descriptors, the input feature matrix expands to include 77 elements. The machine learning approach demonstrated improvements with an RMSE of 9.43 kJ mol−1 and R2 equal to 0.74, as shown in Fig. 15b.
4.3 Machine learning using other common descriptors
We compared the performance of machine learning models trained using two popular geometrical feature descriptors widely utilized for calculating absorption properties: void volume and window size of each cage. The volume and window size of the octahedral cage isomers were calculated using pywindow.57 The input features of the machine learning model consisted of a 9-dimensional vector matrix, with one element representing the intrinsic void volume and the remaining 8 elements allocated for the circular diameter of each window.The two conventional descriptors do not give a satisfactory outcome with our dataset, Fig. 16, with an RMSE of 14.34 kJ mol−1 and an R2 value of 0.60. This limitation arises from their inability to capture important features, distinguish between different functional group arrangements within the same MOF topology. For example, void volumes do not discern significant differences between MOFs with the same number of functional groups inside the cage, even when the arrangement of the functional group differs. By accounting for differences between functional group arrangements within MOF cages, our descriptors help to overcome these limitations.
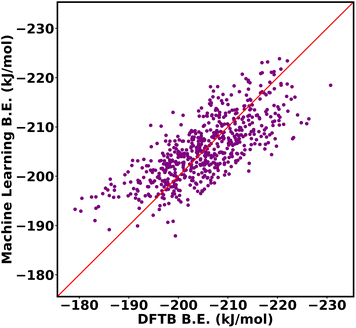 | ||
| Fig. 16 DFTB vs. machine learning binding energies of propranolol in Oh cage of NH2-UiO-66 isomers using two conventional geometrical descriptors, void volume and window size. | ||
5 Conclusion
The enumeration of all possible functional group arrangements and the identification of the unique isomers in 14 pore shapes has been performed, the number is related to the conformational entropy of the pore shape.The number of possible isomers increases exponentially as the number of linker fragments comprising the pore grows. For example, the UiO-6x structure (fcu net) contains eight tetrahedral (Tri4Di6) and four octahedral (Tet6Di12) pores per unit cell. A mono-functionalized Tri4Di6 pore has 176 distinct isomers, while a similarly mono-functionalized octahedral, Tet6Di12, pore has 354![[thin space (1/6-em)]](https://www.rsc.org/images/entities/char_2009.gif) 024 distinct isomers, leading to a truly staggering number of distinct structures. Yet, the chemical environment ‘seen’ by a guest adsorbate molecule in the pore of such a cage structure may be relatively simpler, as any given molecule is likely to only interact with a limited number of functional groups. We therefore characterise each pore environment by the pair distances between functional groups and the frequency of these distances over all possible pore isomers.
024 distinct isomers, leading to a truly staggering number of distinct structures. Yet, the chemical environment ‘seen’ by a guest adsorbate molecule in the pore of such a cage structure may be relatively simpler, as any given molecule is likely to only interact with a limited number of functional groups. We therefore characterise each pore environment by the pair distances between functional groups and the frequency of these distances over all possible pore isomers.
An efficient method to identify and count unique structures is also presented, which enables efficient generation of machine learning descriptors containing information about chemical environment provided by functionalized linkers, which is important for the calculation of absorption properties. We show that our histograms capture the distinct nature of each cage topology and we propose our histograms represent useful identifiers for the pore environments in MFMs that can be used to determine the adsorption of large and complex molecules in these pore environments. The descriptor is low-dimensional and easily computable and is therefore a useful representation of the pore environment for machine learning. We successfully used the descriptor to predict the binding of propranolol in the octahedral pore of NH2-UiO-66. The utility and ease of computation suggests that the descriptor could be extended to account for multiple functional groups (e.g. describing multivariate MOFs).
Author contributions
MN: software, investigation, writing – original draft preparation; YH: formal analysis, validation; CD: investigation; DP: methodology; CCP: supervision, writing – review and editing; MAA: conceptualization of this study, methodology, writing – review and editing.Conflicts of interest
There are no conflicts to declare.Acknowledgements
MAA is grateful to the Engineering and Physical Sciences Research Council for funding through grant no. EP/S015868/1 and HPC time via the UK Materials and Molecular Modelling Hub via grant no. EP/T022213. MN thanks NTU for a vice-chancellor's PhD scholarship.Notes and references
- L. J. Murray, M. Dincă and J. R. Long, Hydrogen storage in metal–organic frameworks, Chem. Soc. Rev., 2009, 38, 1294–1314 RSC.
- J.-R. Li, J. Sculley and H.-C. Zhou, Metal–Organic Frameworks for Separations, Chem. Rev., 2012, 112, 869–932 CrossRef CAS PubMed.
- C. S. Diercks, Y. Liu, K. E. Cordova and O. M. Yaghi, The role of reticular chemistry in the design of CO2 reduction catalysts, Nat. Mater., 2018, 17, 301–307 CrossRef CAS PubMed.
- P. Horcajada, C. Serre, M. Vallet-Regí, M. Sebban, F. Taulelle and G. Férey, Metal–Organic Frameworks as Efficient Materials for Drug Delivery, Angew. Chem., Int. Ed., 2006, 45, 5974–5978 CrossRef CAS PubMed.
- P. Horcajada, T. Chalati, C. Serre, B. Gillet, C. Sebrie, T. Baati, J. F. Eubank, D. Heurtaux, P. Clayette, C. Kreuz, J.-S. Chang, Y. K. Hwang, V. Marsaud, P.-N. Bories, L. Cynober, S. Gil, G. Férey, P. Couvreur and R. Gref, Porous metal–organic-framework nanoscale carriers as a potential platform for drug delivery and imaging, Nat. Mater., 2010, 9, 172–178 CrossRef CAS PubMed.
- M. H. Teplensky, M. Fantham, P. Li, T. C. Wang, J. P. Mehta, L. J. Young, P. Z. Moghadam, J. T. Hupp, O. K. Farha, C. F. Kaminski and D. Fairen-Jimenez, Temperature Treatment of Highly Porous Zirconium-Containing Metal–Organic Frameworks Extends Drug Delivery Release, J. Am. Chem. Soc., 2017, 139, 7522–7532 CrossRef CAS PubMed.
- H. Furukawa, Y. B. Go, N. Ko, Y. K. Park, F. J. Uribe-Romo, J. Kim, M. O'Keeffe and O. M. Yaghi, Isoreticular Expansion of Metal–Organic Frameworks with Triangular and Square Building Units and the Lowest Calculated Density for Porous Crystals, Inorg. Chem., 2011, 50, 9147–9152 CrossRef CAS PubMed.
- A. K. Cheetham, T. D. Bennett, F.-X. Coudert and A. L. Goodwin, Defects and disorder in metal organic frameworks, Dalton Trans., 2016, 45, 4113–4126 RSC.
- S. Yuan, P. Zhang, L. Zhang, A. T. Garcia-Esparza, D. Sokaras, J.-S. Qin, L. Feng, G. S. Day, W. Chen, H. F. Drake, P. Elumalai, S. T. Madrahimov, D. Sun and H.-C. Zhou, Exposed Equatorial Positions of Metal Centers via Sequential Ligand Elimination and Installation in MOFs, J. Am. Chem. Soc., 2018, 140, 10814–10819 CrossRef CAS PubMed.
- M. Kalaj and S. M. Cohen, Postsynthetic Modification: An Enabling Technology for the Advancement of Metal–Organic Frameworks, ACS Cent. Sci., 2020, 6, 1046–1057 CrossRef CAS PubMed.
- T. A. Makal, A. A. Yakovenko and H.-C. Zhou, Isomerism in Metal–Organic Frameworks: “Framework Isomers”, J. Phys. Chem. Lett., 2011, 2, 1682–1689 CrossRef CAS.
- N. S. Bobbitt, A. S. Rosen and R. Q. Snurr, Topological effects on separation of alkane isomers in metal-organic frameworks, Fluid Phase Equilib., 2020, 519, 112642 CrossRef CAS.
- M. Eddaoudi, J. Kim, N. Rosi, D. Vodak, J. Wachter, M. O'Keeffe and O. M. Yaghi, Systematic Design of Pore Size and Functionality in Isoreticular MOFs and Their Application in Methane Storage, Science, 2002, 295, 469–472 CrossRef CAS PubMed.
- S. Amirjalayer and R. Schmid, Conformational Isomerism in the Isoreticular Metal Organic Framework Family: A Force Field Investigation, J. Phys. Chem. C, 2008, 112, 14980–14987 CrossRef CAS.
- S. Bureekaew, V. Balwani, S. Amirjalayer and R. Schmid, Isoreticular isomerism in 4,4-connected paddle-wheel metal–organic frameworks: structural prediction by the reverse topological approach, CrystEngComm, 2015, 17, 344–352 RSC.
- C. Song, J. Hu, Y. Ling, Y. Feng, R. Krishna, D.-l. Chen and Y. He, The accessibility of nitrogen sites makes a difference in selective CO2 adsorption of a family of isostructural metal–organic frameworks, J. Mater. Chem. A, 2015, 3, 19417–19426 RSC.
- P. S. Petkov, V. Bon, C. L. Hobday, A. B. Kuc, P. Melix, S. Kaskel, T. Düren and T. Heine, Conformational isomerism controls collective flexibility in metal–organic framework DUT-8(Ni), Phys. Chem. Chem. Phys., 2019, 21, 674–680 RSC.
- Y. Wang, M. He, X. Gao, S. Li, S. Xiong, R. Krishna and Y. He, Exploring the Effect of Ligand-Originated MOF Isomerism and Methoxy Group Functionalization on Selective Acetylene/Methane and Carbon Dioxide/Methane Adsorption Properties in Two NbO-Type MOFs, ACS Appl. Mater. Interfaces, 2018, 10, 20559–20568 CrossRef CAS PubMed.
- G. E. Cmarik, M. Kim, S. M. Cohen and K. S. Walton, Tuning the Adsorption Properties of UiO-66 via Ligand Functionalization, Langmuir, 2012, 28, 15606–15613 CrossRef CAS PubMed.
- S. M. Chavan, G. C. Shearer, S. Svelle, U. Olsbye, F. Bonino, J. Ethiraj, K. P. Lillerud and S. Bordiga, Synthesis and Characterization of Amine-Functionalized Mixed-Ligand Metal–Organic Frameworks of UiO-66 Topology, Inorg. Chem., 2014, 53, 9509–9515 CrossRef CAS PubMed.
- J. F. Blandez, A. Santiago-Portillo, S. Navalón, M. Giménez-Marqués, M. Álvaro, P. Horcajada and H. García, Influence of functionalization of terephthalate linker on the catalytic activity of UiO-66 for epoxide ring opening, J. Mol. Catal. A: Chem., 2016, 425, 332–339 CrossRef CAS.
- D. Bahamon, W. Anlu, S. Builes, M. Khaleel and L. F. Vega, Effect of Amine Functionalization of MOF Adsorbents for Enhanced CO2 Capture and Separation: A Molecular Simulation Study, Front. Chem., 2021, 8, 1228 Search PubMed.
- P. Skowronek, B. Warżajtis, U. Rychlewska and J. Gawroński, Self-assembly of a covalent organic cage with exceptionally large and symmetrical interior cavity: the role of entropy of symmetry, Chem. Commun., 2013, 49, 2524–2526 RSC.
- G. Ercolani, C. Piguet, M. Borkovec and J. Hamacek, Symmetry Numbers and Statistical Factors in Self-Assembly and Multivalency, J. Phys. Chem. B, 2007, 111, 12195–12203 CrossRef CAS PubMed.
- M. K. Gilson and K. K. Irikura, Symmetry Numbers for Rigid, Flexible, and Fluxional Molecules: Theory and Applications, J. Phys. Chem. B, 2010, 114, 16304–16317 CrossRef CAS PubMed.
- Y. G. Chung, D. A. Gómez-Gualdrón, P. Li, K. T. Leperi, P. Deria, H. Zhang, N. A. Vermeulen, J. F. Stoddart, F. You, J. T. Hupp, O. K. Farha and R. Q. Snurr, In silico discovery of metal-organic frameworks for precombustion CO2 capture using a genetic algorithm, Sci. Adv., 2016, 2, e1600909 CrossRef PubMed.
- S. P. Collins, T. D. Daff, S. S. Piotrkowski and T. K. Woo, Materials design by evolutionary optimization of functional groups in metal-organic frameworks, Sci. Adv., 2016, 2, e1600954 CrossRef PubMed.
- K. Mukherjee and Y. J. Colón, Machine learning and descriptor selection for the computational discovery of metal-organic frameworks, Mol. Simul., 2021, 47, 857–877 CrossRef CAS.
- Z. Wang, T. Zhou and K. Sundmacher, Interpretable machine learning for accelerating the discovery of metal-organic frameworks for ethane/ethylene separation, Chem. Eng. J., 2022, 444, 136651 CrossRef CAS.
- G. S. Fanourgakis, K. Gkagkas, E. Tylianakis and G. E. Froudakis, A Universal Machine Learning Algorithm for Large-Scale Screening of Materials, J. Am. Chem. Soc., 2020, 142, 3814–3822 CrossRef CAS PubMed.
- Z. Wang, Y. Zhou, T. Zhou and K. Sundmacher, Identification of optimal metal-organic frameworks by machine learning: Structure decomposition, feature integration, and predictive modeling, Comput. Chem. Eng., 2022, 160, 107739 CrossRef CAS.
- M. Fernandez, N. R. Trefiak and T. K. Woo, Atomic Property Weighted Radial Distribution Functions Descriptors of Metal–Organic Frameworks for the Prediction of Gas Uptake Capacity, J. Phys. Chem. C, 2013, 117, 14095–14105 CrossRef CAS.
- C. Castillo-Blas, J. M. Moreno, I. Romero-Muñiz and A. E. Platero-Prats, Applications of pair distribution function analyses to the emerging field of non-ideal metal–organic framework materials, Nanoscale, 2020, 12, 15577–15587 RSC.
- M. A. Molina, A. Manjón-Sanz and M. Sánchez-Sánchez, On the contribution of Pair Distribution Function (PDF) to the characterization of nanocrystalline MOFs: The case of M-MOF-74, Microporous Mesoporous Mater., 2021, 319, 110973 CrossRef CAS.
- R. Anderson, A. Biong and D. A. Gómez-Gualdrón, Adsorption Isotherm Predictions for Multiple Molecules in MOFs Using the Same Deep Learning Model, J. Chem. Theory Comput., 2020, 16, 1271–1283 CrossRef CAS PubMed.
- B. J. Bucior, N. S. Bobbitt, T. Islamoglu, S. Goswami, A. Gopalan, T. Yildirim, O. K. Farha, N. Bagheri and R. Q. Snurr, Energy-based descriptors to rapidly predict hydrogen storage in metal–organic frameworks, Mol. Syst. Des. Eng., 2019, 4, 162–174 RSC.
- G. S. Fanourgakis, K. Gkagkas, E. Tylianakis and G. Froudakis, A Generic Machine Learning Algorithm for the Prediction of Gas Adsorption in Nanoporous Materials, J. Phys. Chem. C, 2020, 124, 7117–7126 CrossRef CAS.
- M. Fumanal, G. Capano, S. Barthel, B. Smit and I. Tavernelli, Energy-based descriptors for photo-catalytically active metal–organic framework discovery, J. Mater. Chem. A, 2020, 8, 4473–4482 RSC.
- X. Zhang, K. Zhang and Y. Lee, Machine Learning Enabled Tailor-Made Design of Application-Specific Metal–Organic Frameworks, ACS Appl. Mater. Interfaces, 2020, 12, 734–743 CrossRef CAS PubMed.
- M. Arockiaraj, J. Jency, S. Mushtaq, A. J. Shalini and K. Balasubramanian, Covalent organic frameworks: topological characterizations, spectral patterns and graph entropies, J. Math. Chem., 2023, 61, 1633–1664 CrossRef CAS.
- Y. Lee, S. D. Barthel, P. Dłotko, S. M. Moosavi, K. Hess and B. Smit, Quantifying similarity of pore-geometry in nanoporous materials, Nat. Commun., 2017, 8, 15396 CrossRef CAS PubMed.
- A. S. Krishnapriyan, M. Haranczyk and D. Morozov, Topological Descriptors Help Predict Guest Adsorption in Nanoporous Materials, J. Phys. Chem. C, 2020, 124, 9360–9368 CrossRef CAS.
- N. W. Ockwig, O. Delgado-Friedrichs, M. O'Keeffe and O. M. Yaghi, Reticular Chemistry: Occurrence and Taxonomy of Nets and Grammar for the Design of Frameworks, Acc. Chem. Res., 2005, 38, 176–182 CrossRef CAS PubMed.
- A. Kerber, R. Laue, T. Gruner and M. Meringer, MOLGEN 4.0, MATCH, 1998, 205–208 CAS.
- A. Kerber, R. Laue, M. Meringer and C. Ruecker, Molecules in silico: A graph description of chemical reactions, J. Chem. Inf. Model., 2007, 47, 805–817 CrossRef CAS PubMed.
- A. Jati, K. Dey, M. Nurhuda, M. A. Addicoat, R. Banerjee and B. Maji, Dual Metalation in a Two-Dimensional Covalent Organic Framework for Photocatalytic C–N Cross-Coupling Reactions, J. Am. Chem. Soc., 2022, 144, 7822–7833 CrossRef CAS PubMed.
- B. Kandasamy, E. Lee, D.-L. Long, N. Bell and L. Cronin, Exploring the Geometric Space of Metal–Organic Polyhedrons (MOPs) of Metal-Oxo Clusters, Inorg. Chem., 2021, 60, 14772–14778 CrossRef CAS PubMed.
- G. Zhang and M. Mastalerz, Organic cage compounds – from shape-persistency to function, Chem. Soc. Rev., 2014, 43, 1934–1947 RSC.
- R. L. Greenaway and K. E. Jelfs, High-Throughput Approaches for the Discovery of Supramolecular Organic Cages, ChemPlusChem, 2020, 85, 1813–1823 CrossRef CAS PubMed.
- E. Berardo, R. L. Greenaway, L. Turcani, B. M. Alston, M. J. Bennison, M. Miklitz, R. Clowes, M. E. Briggs, A. I. Cooper and K. E. Jelfs, Computationally-inspired discovery of an unsymmetrical porous organic cage, Nanoscale, 2018, 10, 22381–22388 RSC.
- P. S. Reiss, M. A. Little, V. Santolini, S. Y. Chong, T. Hasell, K. E. Jelfs, M. E. Briggs and A. I. Cooper, Periphery-Functionalized Porous Organic Cages, Chem. – Eur. J., 2016, 22, 16547–16553 CrossRef CAS PubMed.
- V. Santolini, M. Miklitz, E. Berardo and K. E. Jelfs, Topological landscapes of porous organic cages, Nanoscale, 2017, 9, 5280–5298 RSC.
- L. Turcani, E. Berardo and K. E. Jelfs, stk: A python toolkit for supramolecular assembly, J. Comput. Chem., 2018, 39, 1931–1942 CrossRef CAS PubMed.
- R. Warmuth, E. F. Maverick, C. B. Knobler and D. J. Cram, Through-Shell Alkyllithium Additions and Borane Reductions, J. Org. Chem., 2003, 68, 2077–2088 CrossRef CAS PubMed.
- I. M. Isaacs, Algebra: A Graduate Course, American Mathematical Society, 2009 Search PubMed.
- M. A. Addicoat, S. Fukuoka, A. J. Page and S. Irle, Stochastic structure determination for conformationally flexible heterogenous molecular clusters: Application to ionic liquids, J. Comput. Chem., 2013, 34, 2591–2600 CrossRef CAS PubMed.
- M. Miklitz and K. E. Jelfs, pywindow: Automated Structural Analysis of Molecular Pores, J. Chem. Inf. Model., 2018, 58, 2387–2391 CrossRef CAS PubMed.
Footnotes |
| † All code and datasets are on github: https://github.com/maryamnhd/FG-Pair-Distance-Descriptor (ML code and dataset) https://github.com/maryamnhd/Cage-Isomers (cage isomer enumeration and descriptor generation). |
| ‡ Electronic supplementary information (ESI) available. See DOI: https://doi.org/10.1039/d3qi01065a |
| This journal is © the Partner Organisations 2023 |


