
Cationic pair substitution in LaAlO3:Mn4+ for octahedral-tilting-dependent zero-phonon line†
Siyuan
Li
 a,
Chenyu
Zhang
a,
Qi
Zhu
*a and
Ji-Guang
Li
*b
a,
Chenyu
Zhang
a,
Qi
Zhu
*a and
Ji-Guang
Li
*b
aKey Laboratory for Anisotropy and Texture of Materials (Ministry of Education), School of Materials Science and Engineering, Northeastern University, Shenyang, Liaoning 110819, China. E-mail: zhuq@smm.neu.edu.cn; Tel: +86-24-8367-2700
bResearch Center for Functional Materials, National Institute for Materials Science, Namiki 1-1, Tsukuba, Ibaraki 305-0044, Japan. E-mail: LI.Jiguang@nims.go.jp; Tel: +81-29-860-4394
First published on 28th November 2022
Abstract
Zero-phonon line (ZPL) emission of Mn4+, without the participation of phonons, is tightly related to the host crystal structure. However, the intensity of the intrinsic ZPL is much weaker than that of Stokes and anti-Stokes vibrational bands, and it always leads to a discontinuous emission peak. Regulating the ZPL of Mn4+ for a strong emission is very important but remains a challenge for perovskite-type oxides. Here, novel La1−xBaxAl1−xTixO3:0.001Mn4+ (LBAT:0.001Mn4+, x = 0–0.2) and La1−yYyAl1−yGayO3:0.001Mn4+ (LYAG:0.001Mn4+, y = 0–0.2) samples were successfully synthesized through a high-temperature solid-state reaction, and a tunable ZPL of Mn4+ was found by cationic pair substitution of Ba2+–Ti4+ and Y3+–Ga3+ for La3+–Al3+ in LaAlO3:Mn4+. The ZPL intensity is related to the local symmetry around Mn4+ and the ZPL energy corresponds to the Mn–O bond distance and the O–Mn–O bond distortion. Through co-doping Ba2+–Ti4+, the ZPL at 710 nm is enhanced and the intensity increases continuously with increasing the x value, due to the local symmetric degree of Mn4+ decreasing slowly. However, Y3+–Ga3+ co-doping induces a linear and quick increase in the intensity of ZPL at 704 nm with increasing y value, due to the local symmetric degree of Mn4+ decreasing quickly. The octahedral tilting distortion is very important for the local symmetry. Ba2+–Ti4+ co-doping reduces octahedral tilting distortion, but Y3+–Ga3+ co-doping induces a serious octahedral tilting distortion. Consequently, the ZPL emission exhibits an octahedral-tilting dependent behavior. Mainly due to the larger distortion of the O–Mn–O bond, the energy of ZPL for LYAG:0.001Mn4+ is higher than that for LBAT:0.001Mn4+. The outcomes of this work provide a promising way to regulate the ZPL intensity and energy by tuning the local structure around Mn4+, and may have wide implications for Mn4+-doped phosphors and solid-state lighting.
1. Introduction
The ABO3 perovskite oxides present a multitude of functional properties and are widely renowned for their potential in various types of applications, owing to their low cost and high abundance.1,2 For the simple ABO3 perovskite, the A cation connects to 12 oxygen atoms to form an AO12 dodecahedron, and the B cation links with 6 oxygen atoms to form a BO6 octahedron. The BO6 are connected to each other by O vertices to form a three-dimensional framework structure, and A cations are located in the cavities surrounded by eight BO6 octahedra.3,4 The most common distortion for ABO3 perovskite oxide is octahedral tilting, which is related to the rigid BO6 ratios while keeping their corner-sharing connectivity.5,6 Controlling the degree of octahedral tilting is of great interest, owing to its significant effects on the physical and chemical properties.LaAlO3 has rhombohedral symmetry with the pseudo-cubic cell parameters a = b = c = 3.79 Å and β=90.066°, and it is one of the most important ABO3 perovskite oxides.7,8 It is widely known that the phase transition from cubic to rhombohedral takes place at Tc ≈ 817 K through AlO6 octahedron rotation along 〈−11−1〉 with half of the polyhedrons tilting clockwise and half tilting anticlockwise.9 During the rotation, the local structure changes a lot, which can be determined by the analysis of cell parameter variation and Raman spectra. Furthermore, structural changes from rhombohedral to cubic with increasing hydrostatic pressure are also observed, which are induced by decreasing AlO6 octahedron tilting.10 Changes in the temperature and pressure not only alter the tilting degree of AlO6, but also lead to the replacement of La3+ or/and Al3+ by other cations.11,12 For example, when Nd3+ cations substitute for La3+ in LaAlO3, the AlO6 octahedron tilting increases gradually.11 The octahedron tilting distortions will induce huge variations in the local structure and produce an impact on the properties of the functional materials.7
LaAlO3 is an appropriate host for Mn4+ doping to generate near-infrared emission.12 Mn4+ with 3d3 electronic configuration is an excellent luminescent center.13,14 Usually, Mn4+ prefers to occupy the octahedral sites to generate the luminescence, which depends on the covalence and local coordination symmetry around Mn4+ in the host. The emission peak of Mn4+ corresponding to 2Eg–4A2g usually consists of the zero-phonon line (ZPL) transition and the vibrational sidebands of ZPL with phonon assistance (Stokes and anti-Stokes vibronic band) ranging from 600 to 800 nm.15 Compared with the phonon sidebands, the energy and intensity of ZPL are much more sensitive to the local coordinated environment. The reason is that no phonon participates in the ZPL emission process, which is only dependent on the host structure.16,17 Generally, the intensity of the ZPL is related to the structural symmetry around Mn4+. According to the Tanabe–Sugano diagram, the ZPL emission energy remains the same with changing the crystal field splitting. In fact, the energy of Mn4+ emission is based on Mn–ligand hybridization.18,19 Decreasing hybridization should lead to higher 2Eg energies and increase the emission energy. Furthermore, weaker hybridization can be induced via the increased Mn–ligand distance and/or distorted ligand–Mn–ligand bond angles.18 Mn4+-doped phosphors are usually used as the red component in LED devices. Interestingly, when the ZPL is located at a wavelength smaller than 700 nm, the color rendering index of LED devices can be further improved by enhancing the ZPL emission, which is very important to obtain high-quality white LED devices.14 Because the ZPL of the LaAlO3:Mn4+ phosphor is located at a wavelength larger than 700 nm, enhancing the ZPL cannot improve the color rendering index of the white LED device. However, LaAlO3:Mn4+ phosphors can be used as LED devices, which are beneficial for plant growing.13 At the same time, a higher ZPL intensity can induce the two divided emission peaks (Stokes and anti-Stokes) to become a broad band, and then make the emission spectra a better match with the PFR region of the plant absorption spectrum. Consequently, the luminous efficiency of phosphor with a continuous and broad emission band is higher than that of phosphor with a divided emission band.12 Therefore, exploring the changes in ZPL energy and intensity with the local structure is vital for designing high-efficiency deep-red or near-infrared phosphors.
In our previous work,12 zero-phonon line (ZPL) emission of Mn4+ was generated by substituting Mg2+–Ge4+ for Al3+–Al3+ in LaAlO3:Mn4+, which resulted in significant octahedral tilting distortion and a mismatched cation size distortion. The local structure of Mn4+ is influenced by MgO6 and GeO6, which link to MnO6 through the O vertex. In this way, the symmetry degree of Mn4+ decreases gradually along with increasing Mg2+–Ge4+ content, which induces an improvement in ZPL emission. However, the energy of ZPL emission is not discussed in detail in previous work, due to its insufficient impact on the local structure around Mn4+. In order to further reveal the relationship between the local coordinated environment around Mn4+ and the ZPL behavior (energy and intensity), a cationic pair substitution way to tune the local structure is proposed here through replacing La3+–Al3+ rather than Al3+–Al3+ with Ba2+–Ti4+ and Y3+–Ga3+ in LaAlO3:0.001Mn4+. BaO12 and YO12 polyhedrons connect with MnO6 by sharing the same plane and edge, and GaO6 and TiO6 octahedra link to MnO6 through the O vertex. So they would show a more serious effect on the local structure of Mn4+, compared with only sharing the same O vertex by Mg2+–Ge4+ substitution for Al3+–Al3+. Thus, in this work, La1−xBaxAl1−xTixO3:0.001Mn4+ (LBAT:0.001Mn4+, x = 0–0.2) and La1−yYyAl1−yGayO3:0.001Mn4+ (LYAG:0.001Mn4+, y = 0–0.2) samples were successfully synthesized through the high-temperature solid-state reaction in an atmospheric environment. The variations of the local structure were detected using XRD Rietveld refinement, Raman spectra, SEM and TEM analysis. The luminescence properties were obtained via the diffuse reflectance spectra, PLE spectra, PL spectra, lifetime decay curves and temperature-dependent PL spectra. Through the above analysis, the relationship between the local structure of Mn4+ and the ZPL behavior (energy and intensity) is discussed in detail.
2. Experimental section
2.1. Sample preparation
A series of La1−xBaxAl1−xTixO3:0.001Mn4+ (LBAT:0.001Mn4+, x = 0–0.25) and La1−yYyAl1−yGayO3:0.001Mn4+ (LYAG:0.001Mn4+, y = 0–0.25) samples were synthesized using the traditional high-temperature solid-phase reaction technique. La2O3, Al2O3, MnCO3, BaCO3, Y2O3, TiO2 and Ga2O3 were used as the raw materials. La2O3 (99.99%) and Y2O3 (99.999%) were purchased from Huizhou Ruier Rare-Chem. Hi-Tech. Co. Ltd (Huizhou, China). Al2O3 (99.99%), MnCO3 (99.95%), BaCO3 (99.99%), TiO2 (99.8%), and Ga2O3 (99.99%) were purchased from Aladdin Chemical Reagent Co. Ltd (Shanghai, China). La2O3 was heated at 1000 °C for 2 h before use for removing adsorbed water. The raw materials were accurately weighed according to the stoichiometric molar ratio of the designed compositions. Then, these raw materials were placed in an agate mortar and ground for 30 min to mix thoroughly. After that, the mixtures were preheated at 1000 °C for 5 h and then sintered at 1500 °C for 8 h in air. The final powders were obtained for further measurement after cooling down to room temperature naturally.2.2. Characterization methods
The phase compositions of the samples were obtained by X-ray powder diffraction (XRD, model SmartLab, Rigaku, Tokyo, Japan) with the use of nickel-filtered Cu Kα radiation (λ = 0.15406 nm) and 40 kV, 200 mA operating conditions. The scanning range was 10–90° and the scanning rate was 6° per minute. The XRD patterns for Rietveld refinement were acquired in the range of 10–110° at a step size of 0.02° with a step-scan mode of 2.5 s per step. The product morphology, microstructure and element mapping were analyzed through field emission scanning electron microscopy (FE-SEM, model JSM-7001F, JEOL, Tokyo) and transmission electron microscopy (TEM, model JEM-2000FX, JEOL, Tokyo). Raman spectra were collected via a Raman microscope (model R-XploRA Plus, Horiba, Paris, France) with the use of a 638 nm laser. The diffuse reflectance spectra were obtained with a model UV-3600 Plus instrument (Shimadzu, Kyoto, Japan). The photoluminescence and fluorescence decays of the phosphors were recorded on a FP-8600 fluorospectrophotometer (JSACO, Tokyo) with a temperature controller (HPC-836, JSACO) and a liquid nitrogen cooling unit (PMU-830, JSACO). The internal quantum yield (IQY) of the samples was measured using the integrated sphere on the same FP-8600 instrument.3. Results and discussion
3.1. Crystal structure and microstructure
Fig. 1a shows a detailed crystal structure of LaAlO3 and the coordination environment of the cations. AlO6 octahedra are connected with each other by corner-sharing to form the basic framework of LaAlO3. The La3+ ion is coordinated with twelve oxygen atoms and located in the cavities of eight AlO6 octahedra. According to the similar ionic radii between Mn4+ (0.53 Å, CN = 6) and Al3+ (0.535 Å, CN = 6), the luminescence centers of the Mn4+ ions would occupy the crystallographic sites of Al3+ in the AlO6 units. Therefore, from consideration of ionic radii, Ti4+ (0.605 Å, CN = 6) and Ga3+ (0.62 Å, CN = 6) are expected to substitute for Al3+ (0.535 Å, CN = 6). Moreover, Ba2+ (1.61 Å, CN = 12) and Y3+ (1.075 Å, CN = 9) would replace La3+ (1.36 Å, CN = 12). Fig. 1b and c show the XRD patterns of the LBAT:0.001Mn4+ (x = 0–0.25) and LYAG:0.001Mn4+ (y = 0–0.25) samples. Obviously, most of the samples fit well with the standard crystal diffraction data (JCPDS no. 85-0848) of the LaAlO3 compound. However, when the x- and y-values exceed 0.2, the impurities BaTiO3 (JCPDS no. 75-2117)20 and Y4Al2O9 (JCPDS no. 83-0935)21 are yielded, respectively. Therefore, later discussion is based on x- and y-values of no more than 0.2. As seen in Fig. 1b and c, all the diffraction peaks shift to lower angles gradually with increasing x- and y-values. To analyze the shifts in diffraction peak with increasing x- and y-values, enlarged XRD patterns in the range of 32–34° are shown in Fig. 1b and c. The strongest diffraction peak at 33.4° shifts toward lower angles with increasing x- and/or y-value. But the LBAT:0.001Mn4+ (x = 0–0.2) samples show a larger shift than that for LYAG:0.001Mn4+ (y = 0–0.2) samples. Typically, the average ionic radii of Ba2+–Ti4+ and Y3+–Ga3+ pairs are both larger than that of the La3+–Al3+ pair, and Ba2+–Ti4+ is the largest among the three pairs. Modulating the Ba2+–Ti4+ and Y3+–Ga3+ content in LaAlO3:0.001Mn4+ could lead to lattice volume expansion, and the results are in accordance with the experimental data. The dopants entered the crystal structure of LaAlO3:0.001Mn4+ successfully, and homogeneous solid solutions were formed. In addition, the diffraction peaks broaden evidently with increasing x- and/or y-value from 0 to 0.2, demonstrating that the crystal lattice becomes imperfect and the distortion degree of the crystal structures increases.22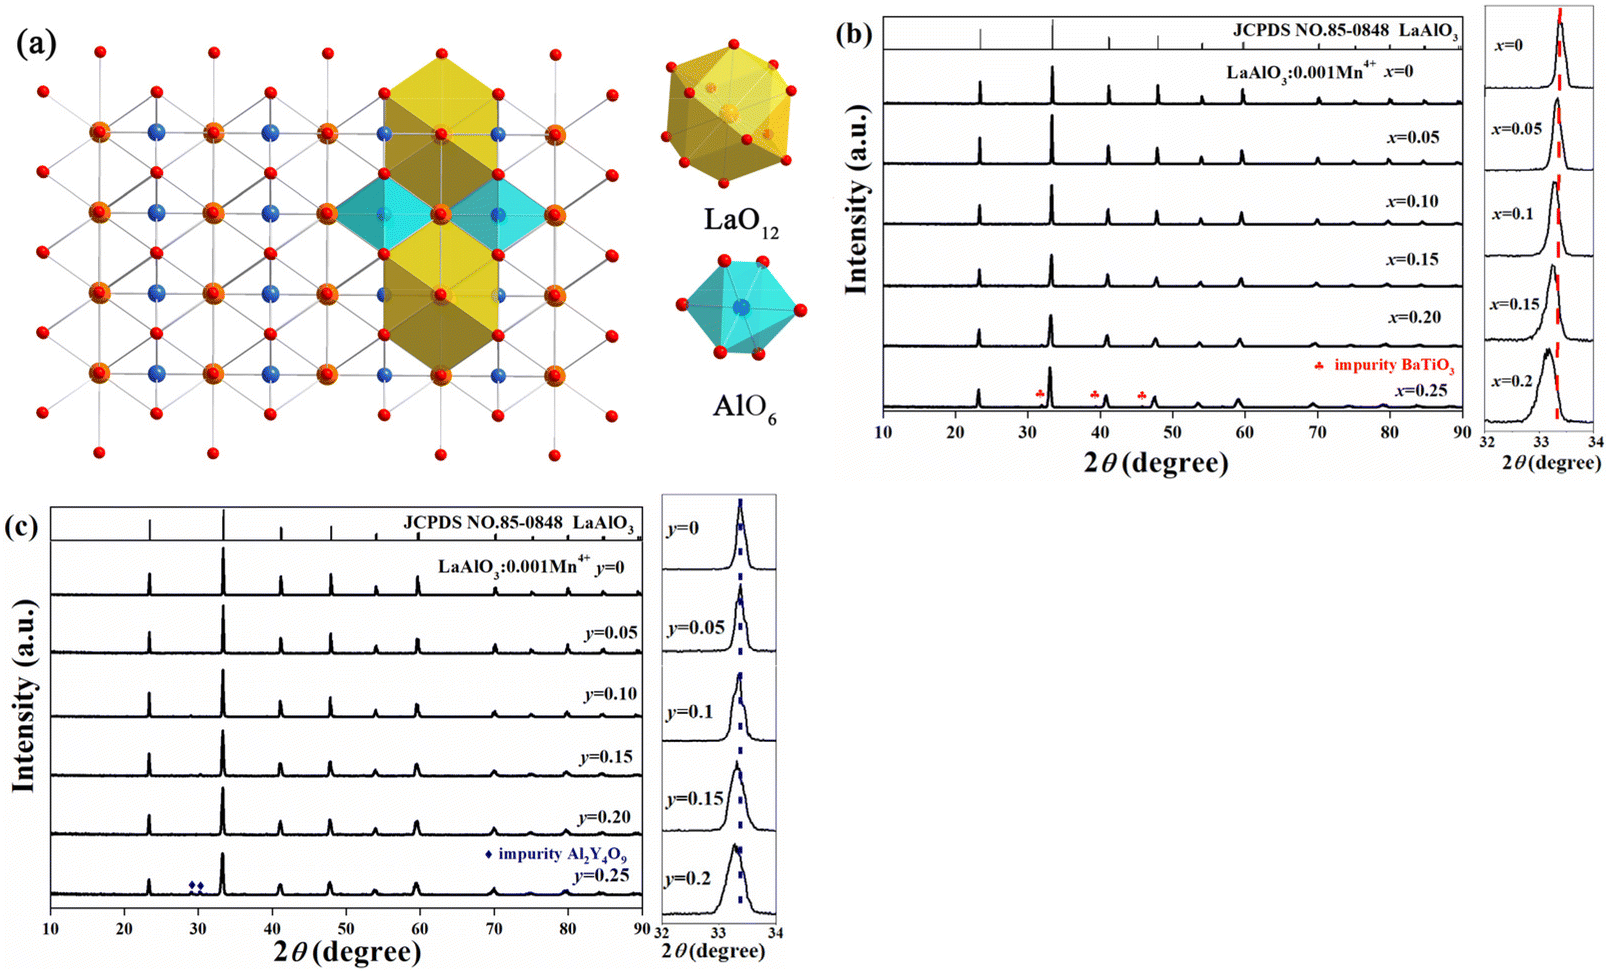 | ||
| Fig. 1 (a) Crystal structure of LaAlO3. XRD patterns of (b) LBAT:0.001Mn4+ (x = 0–0.25) and (c) LYAG:0.001Mn4+ (y = 0–0.25) in the 2θ range of 10–90° and enlarged XRD patterns in the range of 32–34°. | ||
In order to further observe the variation of the crystal lattice of LaAlO3:0.001Mn4+ after the incorporation of Ba2+–Ti4+ and Y3+–Ga3+ pairs, Rietveld refinements were conducted (Fig. S1†). The refinement results for LBAT:0.001Mn4+ (x = 0–0.2) and LYAG:0.001Mn4+ (y = 0–0.2) samples are summarized in Tables S1 and S2,† respectively. As can be seen, the residual factors (Rwp, Rp and χ2) for all the samples converged to low levels, showing that these refinement results are reliable. The lattice constant and the M–O bond length in MO6 octahedra increase linearly with increasing the doping content of Ba2+–Ti4+ and Y3+–Ga3+ (Fig. 2a and b). The O–M–O bond angle shows a decreasing trend with the increase in the x-value, while it shows a remarkably increasing trend with increasing y-value (Fig. 2c). The octahedral tilting can be reflected by the octahedral tilting angle φ between the Al–O bonding and the coordinated axis, which is the angle deviated by 90.00°.7 The increased φ-value shows serious octahedral tilting distortion with Y3+–Ga3+ co-doping, but the value decreases with increasing x-value, implying that the octahedral tilting distortion is suppressed (Fig. 2d). These variations of the samples co-doped with Ba2+–Ti4+ and Y3+–Ga3+ in lattice constant, bond length, bond angle and tilting angle are different from each other, implying that co-doping Ba2+–Ti4+ and Y3+–Ga3+ pairs may result in various distortions of the crystal lattice, owing to the mismatch in ionic radii of doping cations and the resultant octahedral tilting degrees.23,24 Consequently, the distortions of LBAT:0.001Mn4+ (x = 0.05–0.2) samples are caused by the competition between the mismatched ionic radii and the suppression of octahedral tilting. On the contrary, the distortions of LYAG:0.001Mn4+ (x = 0.05–0.2) are composed of the mismatched ionic radii and the increased octahedral tilting.
 | ||
| Fig. 2 The variations of (a) cell parameter, (b) bond length, (c) O–M–O bond angle in a MO6 octahedron and (d) octahedral tilting angle versus various Ba2+–Ti4+ (x = 0–0.2) and Y3+–Ga3+ (y = 0–0.2) content doped LaAlO3:0.001Mn4+ phosphors based on Rietveld refinement results. | ||
Raman spectra is a useful tool to detect the distortion of LaAlO3.7,25Fig. 3a and b display the Raman spectra of LBAT:0.001Mn4+ (x = 0–0.2) samples and LYAG:0.001Mn4+ (y = 0–0.2) samples, respectively. For the LaAlO3:0.001Mn4+ phosphor, two strong peaks at 121 and 152 cm−1 are observed, which are assigned to A1g mode (rotation of the oxygen octahedra) and Eg mode (pure La vibration), respectively. The wavenumber of A1g mode mainly correlates with the tilting angle of the AlO6 octahedron.11 A blue shift of the A1g wavenumber from 121 to 109 cm−1 is detected with increasing the x-value from 0 to 0.2, while a red shift from 121 to 195 cm−1 is observed with increasing the y-value from 0 to 0.2. These phenomena explain that introducing Ba2+–Ti4+ reduces the octahedral tilting, while co-doping with the Y3+–Ga3+ pair increases the octahedral tilting. The results are consistent with the variations in the tilting angle φ (Fig. 2d). At the same time, the Eg wavenumber at 152 cm−1 remains in the same position with increasing the x- or y-value. Because the defects in the crystal structure may contribute to the broadening of the vibrational bands, the full width at half-maximum (FWHM) can reflect the amount of defects.25 The FWHM value of the A1g mode is 15 cm−1 for LaAlO3:0.001Mn4+, and the value shows a continuous increase with increasing the Ba2+–Ti4+ and Y3+–Ga3+ contents. Furthermore, the FWHM value of LYAG:0.001Mn4+ (y = 0.05–2) is always higher than that of LBAT:0.001Mn4+ (x = 0.05–0.2), implying that introducing Y3+–Ga3+ would generate more serious defects in the crystal structure.
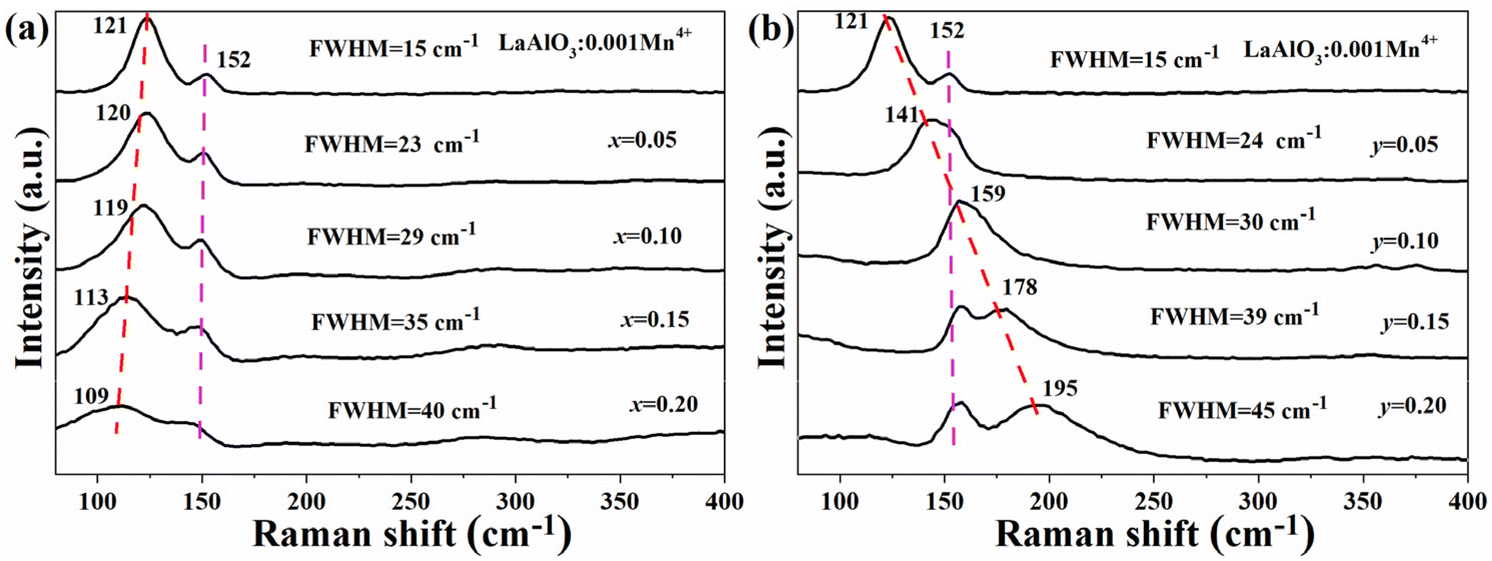 | ||
| Fig. 3 Raman spectra of (a) LBAT:0.001Mn4+ (x = 0–0.20) and (b) LYAG:0.001Mn4+ (y = 0–0.20). | ||
The SEM images, TEM images, HR-TEM lattice fringes and element distributions for LaAlO3:0.001Mn4+, x = 0.2 and y = 0.2 samples are displayed in Fig. 4. The particles are irregular in shape and the sizes are in the range of 1.5–6 μm, which is similar to the particles prepared at higher sintering temperatures.26,27 Their surface morphology does not change significantly depending on the different co-doping amounts. The distinct interplanar space fingers indicate high crystallinity of the samples. The d-values corresponding to the (100) and (011) planes are determined to be ∼0.377 and ∼0.264 nm for LaAlO3:0.001Mn4+ (Fig. 4c). The d-value corresponding to (100) plane is calculated to be ∼0.383 nm for the x = 0.2 sample, and the d-value corresponding to the (011) plane is estimated to be ∼0.270 nm for the y = 0.2 sample. Due to the Ba2+–Ti4+ and Y3+–Ga3+ doping contribution to lattice expansion, an increase in the interplanar spacing is found with increasing the x- and y-values. The element mapping of a single particle indicates a uniform distribution of La, Al, O, Mn, Ba and Ti (Y and Ga) for the x = 0.2 (y = 0.2) sample (Fig. 4g and k). After the comparative analysis, the optimal phosphor samples LBAT:0.001Mn4+ and LYAG:0.001Mn4+ were successfully synthesized.
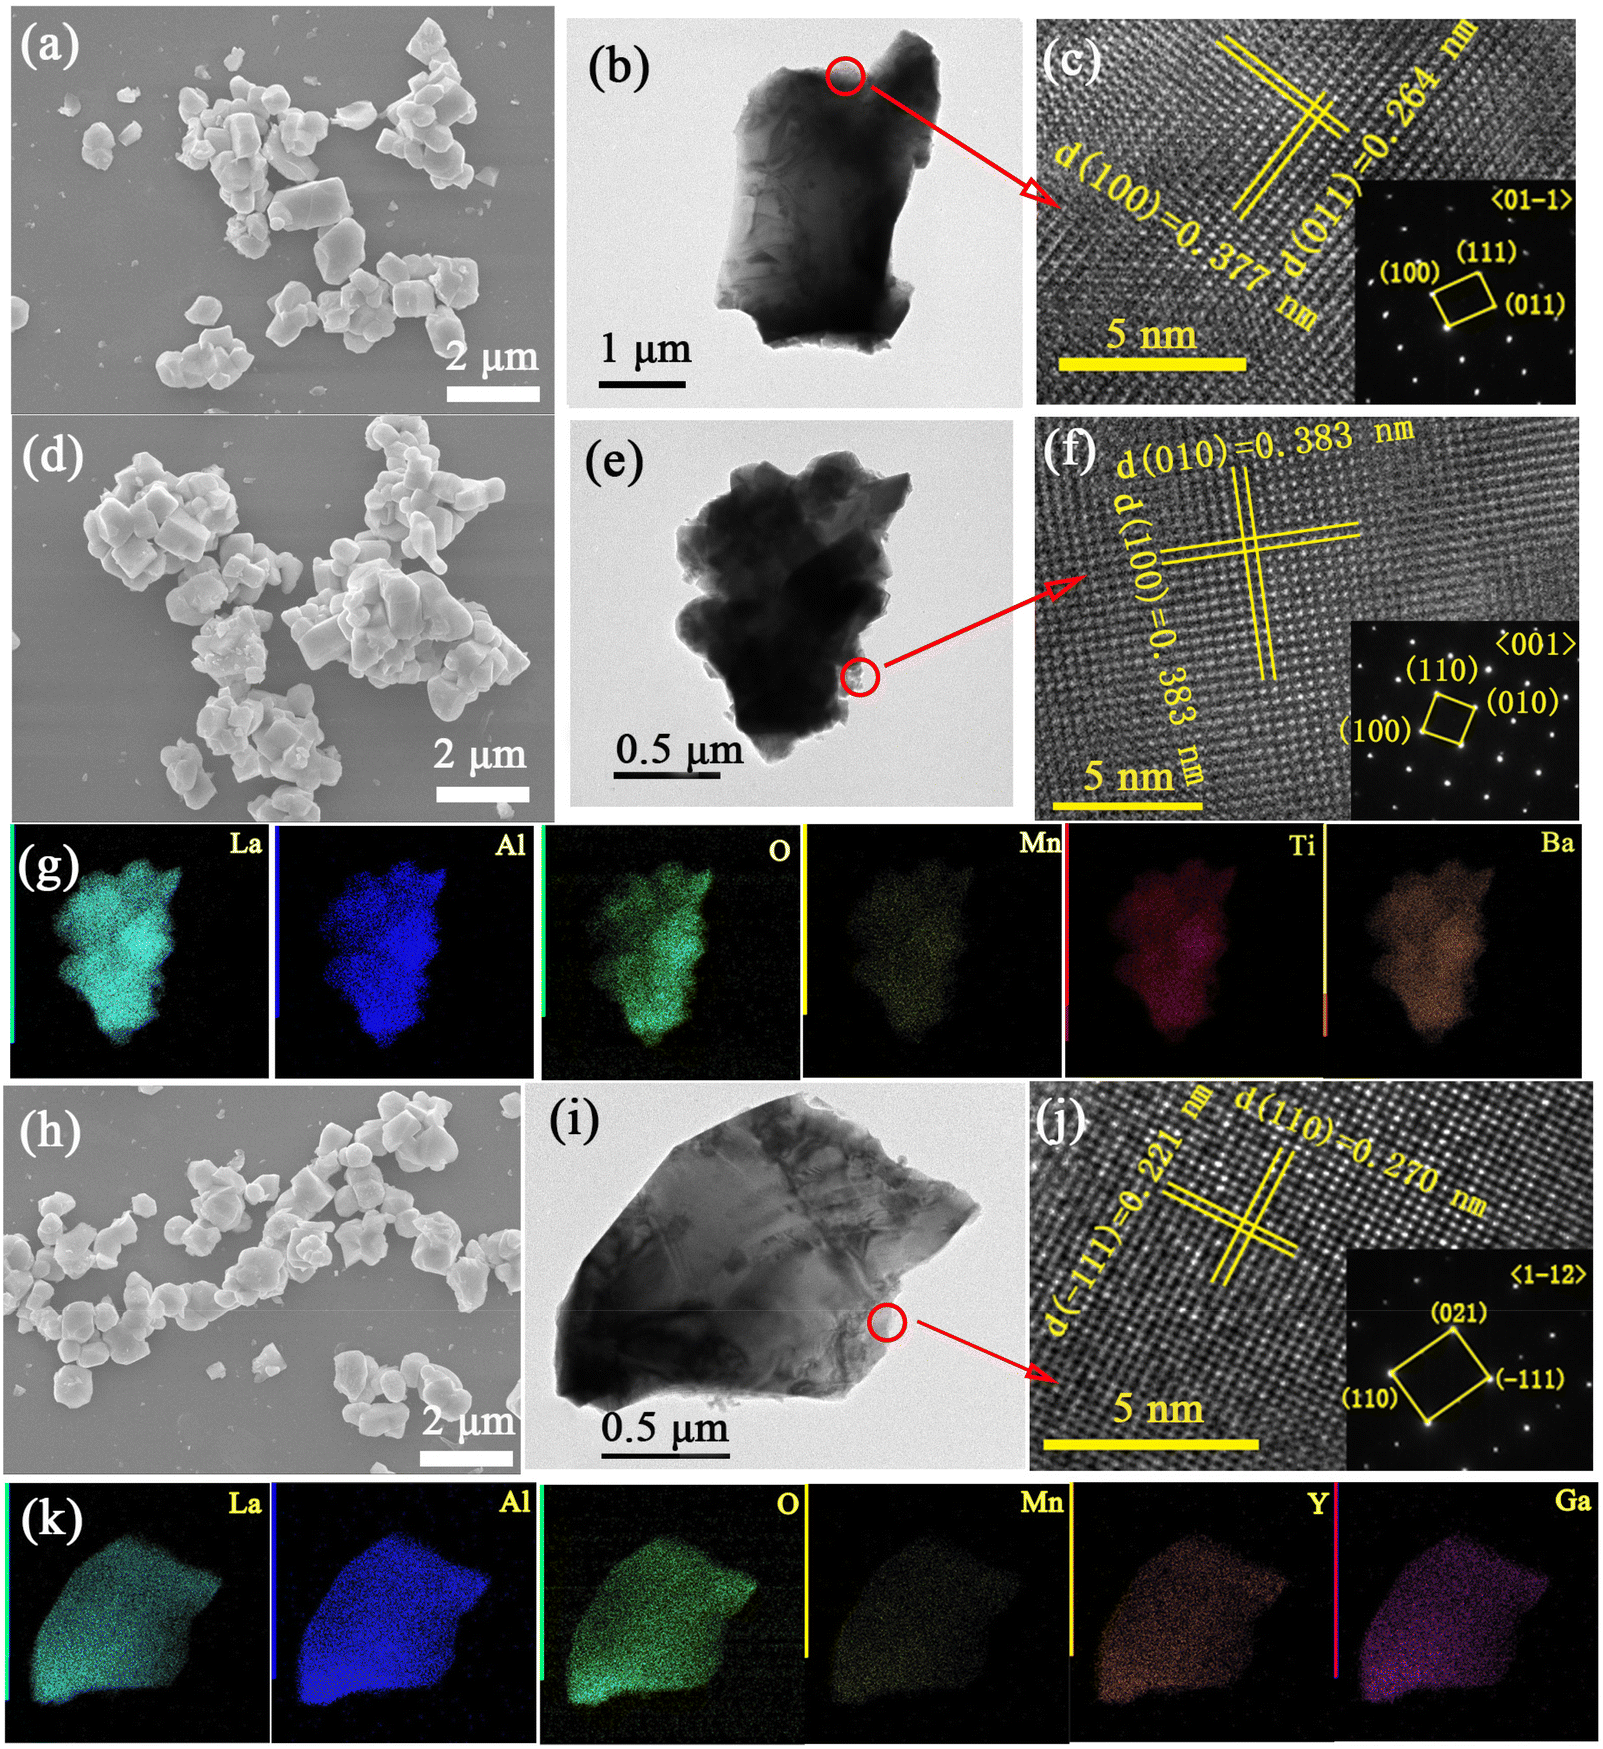 | ||
| Fig. 4 SEM (a, d, h), TEM images (b, e, i), HR-TEM lattice fringes (c, f, j) and element distribution (g, k) for LaAlO3:0.001Mn4+ (a, b, c), x = 0.2 (d, e, f, g) and y = 0.2 (h, i, g, k). | ||
3.2. Photoluminescence of LBAT:0.001Mn4+ and LYAG:0.001Mn4+ samples
Fig. 5a reveals the diffuse reflection spectra of LaAlO3:0.001Mn4+, x = 0.2 and y = 0.2 samples. All of the samples exhibit three strong and wide absorption bands from 240 to 550 nm, which correspond to the strong spin-allowed transition of Mn4+ from 4A2g to the excited levels 4T1g, 2T2g and 4T2g. But a strong band at ∼280 nm related to the Mn4+–O2− charge-transfer band is only observed for the LaAlO3:0.001Mn4+ and LYAG:0.001Mn4+ samples. For the purpose of gaining more information about the band structures of the above materials, the optical band gaps (Eg) were determined for the LaAlO3, La0.8Ba0.2Al0.8Ti0.2O3 and La0.8Y0.2Al0.8Ga0.2O3 hosts. The corresponding equation was used as follows:28–30| (αhν)n = A(hν − Eg) | (1) |
 | ||
| Fig. 5 (a) The diffuse reflection spectra of LaAlO3:0.001Mn4+, x = 0.2 and y = 0.2 samples. (b) The band gap energy determination for the selected hosts. | ||
To investigate the effects of Ba2+–Ti4+ and Y3+–Ga3+ chemical unit doping on the luminescence of Mn4+, the photoluminescence excitation (PLE) and photoluminescence (PL) spectra of LBAT:0.001Mn4+ (x = 0–0.2) and LYAG:0.001Mn4+ (y = 0–0.2) were measured and the results are shown in Fig. 6. There are two characteristic excitation bands that appear when monitored at 726 nm for LaAlO3:0.001Mn4+. The peak at 340 nm is assigned to the overlap of the Mn4+–O2− charge-transfer band and 4A2g–4T1g and 4A2g–2T2g transitions, while the other peak at ∼490 nm is related to the 4A2g–4T2g transition. There is an obvious red shift in the excitation spectra for LBAT:0.001Mn4+ (x = 0–0.2) from ∼333 to ∼356 nm. The shift for LYAG:0.001Mn4+ (y = 0–0.2) is from ∼333 to ∼358 nm. Furthermore, the peak at ∼280 nm disappears for LBAT:0.001Mn4+ (x = 0.05–0.2), while the PLE spectra of the LYAG:0.001Mn4+ (y = 0.05–0.2) samples keep the original shape. The appearance is due to the change of the optical band gap, which will be discussed in later. Under 340 nm excitation, the PL spectrum of LaAlO3:0.001Mn4+ is composed of two bands, including the anti-Stokes phonon band at 698 nm and Stoke phonon band at 726 nm of the 2Eg–4A2g transition. The zero-phonon line (ZPL) emission is too low in intensity to be detected. With the introduction of Ba2+–Ti4+ and Y3+–Ga3+, both peaks remain at the same position and the shape persists. However, a big difference between the anti-Stokes phonon band and the Stokes phonon band is found. A new peak at 710 or 704 nm was generated by co-doping Ba2+–Ti4+ and Y3+–Ga3+ in LaAlO3:0.001Mn4+, and accordingly, the two divided peaks became a broad band. The new peak is related to the ZPL emission. Through the co-substitution of Ba2+–Ti4+, the new peak at 710 nm is enhanced slowly, while an unusual improvement in the peak at 704 nm is obtained by increasing the Y3+–Ga3+ content. Thus, due to the different ZPL energies and intensities, the PL shape of these phosphors shows a huge difference by co-doping different cation pairs.
 | ||
| Fig. 6 PLE (a and c) and PL (b and d) spectra for (a and b) LBAT:0.001Mn4+ (x = 0–0.2) and (c and d) LYAG:0.001Mn4+ (y = 0–0.2) at room temperature. | ||
As is generally known, the emission of Mn4+ is mainly dominated by the vibration of the side bands. In order to observe the variations of the ZPL in detail, the vibration of the side bands should be suppressed. Here, the high-resolution PLE and PL spectra of these samples were recorded at low temperature (77 K), as shown in Fig. 7. The excitation spectra are similar to the spectra measured at room temperature for the LBAT:0.001Mn4+ (x = 0–0.2) and LYAG:0.001Mn4+ (y = 0–0.2) samples. The PLE spectrum of LaAlO3:0.001Mn4+ is fitted into four bands located at 316, 347, 410 and 490 nm, which correspond to the Mn4+–O2− charge-transfer band, and 4A2g–4T1g, 4A2g–2T2g and 4A2g–4T2g transitions of Mn4+. For the LBAT:0.001Mn4+ (x = 0.05–0.2) phosphors, the PLE spectra can be well divided into three sub-bands, which are assigned to the 4A2g–4T1g, 4A2g–2T2g and 4A2g–4T2g transitions of Mn4+. However, the PLE spectra of LYAG:0.001Mn4+ (y = 0.05–0.2) phosphors are well decomposed into four peaks, which are similar to the LaAlO3:0.001Mn4+ sample. Both 4A2g–4T1g and 4A2g–4T2g transition peaks show red shifts for the LBAT:0.001Mn4+ (x = 0–0.2) and LYAG:0.001Mn4+ (y = 0–0.2) phosphors. Notably, under the excitation of 340 nm, the Stokes peak is still at 726 nm and the anti-Stokes peak disappears at 77 K. According to the previous work, the red shift of Mn4+ excitation peaks is mainly due to the change in the crystal field strength (Dq). Dq could be estimated by the following equation:16
 | (2) |
 | ||
| Fig. 7 PLE (a and c) and PL (b and d) spectra for (a and b) LBAT:0.001Mn4+ (x = 0–0.2) and (c and d) LYAG:0.001Mn4+ (y = 0–0.2) at 77 K. | ||
Notably, the ZPL emission peak appears by co-doping Ba2+–Ti4+ and Y3+–Ga3+, but the positions and the intensities of the ZPL band are significantly different. For the LaAlO3:0.001Mn4+ sample, the ZPL emission peak is too low to observe. Based on previous work, the ZPL in LaAlO3:Mn4+ is located at ∼710 nm.15 Introducing Ba2+–Ti4+ to replace La3+–Al3+ results in the appearance of the ZPL at 710 nm, the intensity of which increases slowly with the increase in x. However, for the LYAG:0.001Mn4+ (y = 0.05–0.2) phosphors, the position of the ZPL is at 704 nm, which displays a blue shift compared with that for the LaAlO3:Mn4+ sample, and the ZPL intensity increases with a further increase in the y value. Fig. 8a shows the intensity ratio of the ZPL to the total emission. The intensity and energy of the ZPL, which are related to the emission without the participation of any phonons, are only dependent on the host lattice. Compared with the phonon sidebands, the ZPL is much more sensitive to the local coordination structure. The intensity is determined by the local symmetry around Mn4+.32 With the substitution of Ba2+–Ti4+ for La3+–Al3+, the local symmetry of Mn4+ changes a little due to the competition of the increase in bond distances and the suppression of octahedral tilting, and thus the intensity of the ZPL shows a slow increase. However, when co-doping Y3+–Ga3+, owing to the increase in bond distances and octahedral tilting, the local symmetry of Mn4+ in LYAG:0.001Mn4+ (y = 0.05–0.2) decreases gradually, which thus contributes to an enhanced ZPL intensity. In fact, the emission energy of Mn4+ corresponds to the hybridization, which is related to the Mn–O bond length and O–Mn–O bond angle.18 A longer Mn–O bond length and larger O–Mn–O bond angle distortion generally lead to a smaller Mn–O hybridization, and then contribute to higher emission energies.18,19 According to the XRD Rietveld refinement information, LYAG:0.001Mn4+ (y = 0.05–0.2) samples show a shorter Mn–O bond length compared with that for LBAT:0.001Mn4+ (x = 0.05–0.2), but they exhibit larger O–Mn–O bond angle distortion. Actually, the ZPL emission energies for LYAG:0.001Mn4+ samples are higher than those of LBAT:0.001Mn4+. Thus, through considering the influence of two aspects, the results show that octahedral tilting distortion, which affects the serious O–Mn–O bond angle distortion, is more important for the ZPL energy of Mn4+ in perovskite oxides.
 | ||
| Fig. 8 (a) Related intensity ratio between ZPL and total emission. (b) The variation trend of lifetime at room temperature and 77 K with increasing x- and y-values. (c) Structural distortion trend of the MnO6 octahedron with different doping amounts. | ||
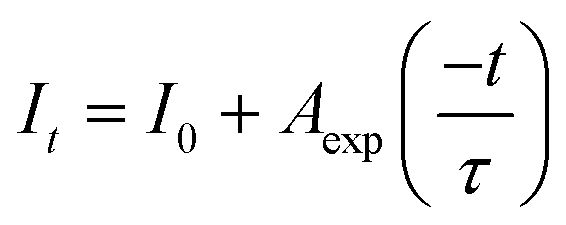
Generally, a long decay time is obtained for luminescence centers in a symmetrical surrounding, while a short decay time is observed when the luminescence centers are located in the distorted site.33 Fig. S3 and S4† show the fluorescence decay curves corresponding to Mn4+ in the LBAT:0.001Mn4+ (x = 0–0.2) and LYAG:0.001Mn4+ (y = 0–0.2) phosphors under excitation at 340 nm, as monitored at 726 nm at room temperature and at 77 K. All decay curves are found to be well fitted by a single exponential function, suggesting the single site occupancy of the Mn4+ in the host lattice. It is expressed as follows:34
 | (3) |
Through the above analysis, the energy and intensity of ZPL emission peak are tightly related to the Mn4+ local structure environment, the same as the decay time. Fig. 8c shows the structural distortion trend of the MnO6 octahedron with different doping types and amounts. When Mn4+ is incorporated into the LaAlO3 host, Mn4+ is surrounded by six coordinated O2− ions to form a MnO6 octahedron. The MnO6 octahedron connects with AlO6 octahedra and LaO12 polyhedrons, and Mn4+ is located in a high-symmetry surrounding environment, leading to a low ZPL intensity and the longest lifetime among all the phosphors. With Ba2+–Ti4+ substitution, some O2− vertexes of the MnO6 octahedron would link to Ba2+ and Ti4+, inducing a change in Mn–O bond length due to the mismatched cation size. However, a reduction of octahedral tilting also takes place with increasing the x-value, which makes the MnO6 more symmetrical. The Mn–O bond lengths and O–M–O bond angles are determined by the two factors. Higher level substitution of Ba2+–Ti4+ contributes to a growing number of BaO12 and TiO6 distributed around MnO6, but the degree of Mn4+ symmetry is almost constant. Thus, the intensity of ZPL increases slowly and the lifetime decreases slowly, owing to the small change of the local symmetry of Mn4+. On the contrary, with the chemical unit co-substitution of Y3+–Ga3+ for La3+–Al3+, the distortions consist of the cation size mismatch and the increased octahedral tilting. The increased octahedral tilting would make Mn4+ be in a more asymmetrical local environment with increasing the y-value. Therefore, the ZPL intensity increases quickly and the lifetime decreases linearly with increasing the y-value. Notably, when a small amount is added, the ZPL intensity for LBAT:0.001Mn4+ (x = 0.05, 0.1) is higher than that for LYAG:0.001Mn4+ (y = 0.05, 0.1) and the lifetime for LBAT:0.001Mn4+ (x = 0.05, 0.1) is shorter than that for LYAG:0.001Mn4+ (y = 0.05, 0.1). This is because the average ionic radius of Ba2+–Ti4+ is larger than that of the Y3+–Ga3+ pair, and so the distortions arising from cation size mismatch were initially dominant. But the LYAG:0.001Mn4+ (y = 0.15, 0.2) phosphors show a higher ZPL intensity and shorter decay time, compared to LBAT:0.001Mn4+ (x = 0.15, 0.2) phosphors, because the octahedral tilting takes the dominant role at higher doping contents.
Fig. 9 displays the mechanisms in LaAlO3:0.001Mn4+, x = 0.2 and y = 0.2 samples for a clear description of the energy transition process. For LaAlO3:0.001Mn4+ and y = 0.2, the electron is excited from the 4A2g energy level to 4T1g, 2T2g, 4T2g and even the Mn4+–O2− charge-transfer band. However, the observation is different from that for the x = 0.2 sample. Because the conduction band bottom shifts down and then drowns the Mn4+–O2− level, the excited electron jumps to the conduction band directly, rather than the Mn4+–O2− level. So the LBAT:0.001Mn4+ (x = 0.05–0.2) phosphors do not show the Mn4+–O2− charge transfer band in excitation spectra. Then the excited electrons relax to the 2Eg level by a non-radiative transition process and finally transfer to the 4A2g energy level with the output of near-infrared emission. According to the PLE spectra (Fig. 6a and c), the samples co-doped by Ba2+–Ti4+ and Y3+–Ga3+ have lower energy in the 4T1g, 4T2g states, which results in a red shift of the excitation peak. At the same time, the Stokes and anti-Stokes emissions are kept at the same positions, but only the energy of the ZPL emission changes, which is clearly described in Fig. 9.
 | ||
| Fig. 9 Mechanisms of luminescence in LaAlO3:0.001Mn4+, x = 0.2 and y = 0.2 samples. | ||
Moreover, the internal quantum yield (IQY) for LaAlO3:0.001Mn4+ has been estimated to be 72.5%. For Ba2+–Ti4+ co-doping, the IQY of the series LBAT:0.001Mn4+ (x = 0.05–0.2) phosphors was analyzed to be 66.7% (x = 0.05), 62.4% (x = 0.1), 59.3% (x = 0.15) and 55.8% (x = 0.2), respectively. For Y3+–Ga3+ co-doping, the IQY of the series LYAG:0.001Mn4+ (y = 0.05–0.2) was analyzed to be 70.0% (y = 0.05), 67.1% (y = 0.1), 63.9% (x = 0.15) and 61.3% (x = 0.2), respectively. The decreased IQY with increasing x- or y-values is mainly due to the lattice expansion, which induces stronger photon–phonon interaction.35
The temperature-dependent luminescence quenching property is essential to evaluate the thermal stability of phosphors.36–38 The temperature luminescent properties were studied in the temperature range of 298–473 K. The temperature-dependent PL spectra of LaAlO3:0.001Mn4+, x = 0.2 and y = 0.2 phosphors are demonstrated in Fig. 10a–c. The relative integral emission intensity of the above three samples is plotted in Fig. 10d. The integral intensity of all the samples decreases monotonically. However, the three samples show different degrees of luminescence quenching with increasing temperature. For better understanding of the thermal quenching behavior, the Arrhenius equation is used to estimate the activation energy (Ea):39
 | (4) |
 | ||
| Fig. 10 Temperature-dependent PL spectra of (a) LaAlO3:0.001Mn4+, (b) x = 0.2 and (c) y = 0.2 phosphors. (d) The relative integrated intensity of the three samples. | ||
4. Conclusion
A series of La1−xBaxAl1−xTixO3:0.001Mn4+ (LBAT:0.001Mn4+, x = 0–0.25) and La1−yYyAl1−yGayO3:0.001Mn4+ (LYAG:0.001Mn4+, y = 0–0.25) samples were successfully synthesized. The substitution of Ba2+–Ti4+ and Y3+–Ga3+ for La3+–Al3+ contributed to the increase in the lattice constant and M–O bond length. Furthermore, co-doping Ba2+–Ti4+ resulted in the suppression of octahedral tilting. However, more serious octahedral tilting was found for the Y3+–Ga3+ substitution. Thus, the distortions of LBAT:0.001Mn4+ (x = 0.05–0.2) samples are caused by the competition between the mismatched ionic radii and the suppression of octahedral tilting. On the contrary, the distortions of LYAG:0.001Mn4+ (x = 0.05–0.2) are composed of the mismatched ionic radii and the increased octahedral tilting. The distortions have a significant influence on the Mn4+ luminescence. Longer Mn–O bond length induces weaker excitation energy through decreasing Dq for LBAT:0.001Mn4+ and LYAG:0.001Mn4+ phosphors. But the various Dq could not change the position of the emission peak. In fact, the emission shape and energy, particularly the ZPL emission, exhibited big changes with co-doping Ba2+–Ti4+ and Y3+-Ga3+. The ZPL intensity increases with substituting Ba2+–Ti4+ and Y3+–Ga3+ for La3+–Al3+. Because the symmetry around Mn4+ decreases more slowly with co-doping Ba2+–Ti4+ than with co-doping Y3+–Ga3+, the intensity of the ZPL for LBAT:0.001Mn4+ increases more slowly than that in LYAG:0.001Mn4+. At the same time, the ZPL energy for LBAT:0.001Mn4+ is higher than that for LYAG:0.001Mn4+, owing to the larger distortion of the O–Mn–O bond angle.Conflicts of interest
There are no conflicts to declare.Acknowledgements
This work was supported in part by the Natural Science Foundation of Liaoning Province (grant 2020-MS-081) and National Natural Science Foundation of China (grants 51302032, 51972047, 52172112).References
- Y. N. Zheng, R. Z. Zhang, L. Zhang, Q. F. Gu and Z.-A. Qiao, A resol-assisted cationic coordinative co-assembly approach to mesoporous ABO3 perovskite oxides with rich oxygen vacancy for enhanced hydrogenation of furfural to furfuryl alcohol, Angew. Chem., Int. Ed., 2021, 60, 4774–4781 CrossRef CAS PubMed.
- J. F. Zhao, J. C. Gao, W. M. Li, Y. T. Qian, X. D. Shen, X. Wang, X. Shen, Z. W. Hu, C. Dong, Q. Z. Huang, L. P. Cao, Z. Li, J. Zhang, C. W. Ren, L. Duan, Q. Q. Liu, R. C. Yu, Y. Ren, S.-C. Weng, H.-J. Lin, C.-T. Chen, L.-H. Tjeng, Y. Long, Z. Deng, J. L. Zhu, X. C. Wang, H. M. Weng, R. Z. Yu, M. Greenblatt and C. Q. Jin, A combinatory ferroelectric compound bridging simple ABO3 and A-site-ordered quadruple perovskite, Nat. Commun., 2021, 12, 747 CrossRef CAS PubMed.
- W. R. Geng, X. W. Guo, Y. L. Zhu, Y. J. Wang, Y. L. Tang, M. J. Han, Y. P. Feng, M. J. Zou, B. Wu, J. Y. Ma, W. T. Hu and X. L. Ma, Oxygen octahedral coupling mediated ferroelectric–antiferroelectric phase transition based on domain wall engineering, Acta Mater., 2020, 198, 145–152 CrossRef CAS.
- R. Huang, H.-C. Ding, W.-I. Liang, Y.-C. Gao, X.-D. Tang, Q. He, C.-G. Duan, Z. Q. Zhu, J. H. Chu, C. A. J. Fisher, T. Hirayama, Y. Ikuhara and Y.-H. Chu, Atomic-scale visualization of polarization pinning and relaxation at coherent BiFeO3/LaAlO3 interfaces, Adv. Funct. Mater., 2014, 24, 793–799 CrossRef CAS.
- W. L. Lu, P. Yang, W. D. Song, G. M. Chow and J. S. Chen, Control of oxygen octahedral rotations and physical properties in SrRuO3 films, Phys. Rev. B: Condens. Matter Mater. Phys., 2013, 88, 214115 CrossRef.
- H. J. Xiang, M. Guennou, J. Íñiguez, J. Kreisel and L. Bellaiche, Rules and mechanisms governing octahedral tilts in perovskites under pressure, Phys. Rev. B, 2017, 96, 054102 CrossRef.
- Y. C. Ji, P. Zhang, L. Q. He, D. Wang, H. Y. Luo, K. Otsuka, Y. Z. Wang and X. B. Ren, Tilt strain glass in Sr and Nb co-doped LaAlO3 ceramics, Acta Mater., 2019, 168, 250–260 CrossRef CAS.
- A. Biswas, C.-H. Yang, R. Ramesh and Y. H. Jeong, Atomically flat single terminated oxide substrate surfaces, Prog. Surf. Sci., 2017, 92, 117–141 CrossRef CAS.
- S. A. Hayward, F. D. Morrison, S. A. T. Redfern, E. K. H. Salje, J. F. Scott, K. S. Knight, S. Tarantino, A. M. Glazer, V. Shuvaeva, P. Daniel, M. Zhang and M. A. Carpenter, Transformation processes in LaAlO3: neutron diffraction, dielectric, thermal, optical, and raman studies, Phys. Rev. B: Condens. Matter Mater. Phys., 2005, 72, 054110 CrossRef.
- P. Bouvier and J. Kreisel, Pressure-induce phase transition in LaAlO3, J. Phys.: Condens. Matter, 2002, 14, 3981–3991 CrossRef CAS.
- M. V. Abrashev, A. P. Litvinchuk, M. N. Iliev, R. L. Meng, V. N. Popov, V. G. Ivanov, R. A. Chakalov and C. Thomsen, Comparative study of optical phonons in the rhombohedrally distorted perovskites LaAlO3 and LaMnO3, Phys. Rev. B: Condens. Matter Mater. Phys., 1999, 59, 4146–4153 CrossRef CAS.
- S. Y. Li, Q. Zhu, X. D. Sun and J.-G. Li, Magical polyhedral twist via chemical unit co-substitution in LaAlO3:Mn4+ to greatly enhance the zero phonon line for high-efficiency plant-growth LEDs, J. Mater. Chem. C, 2021, 9, 7163–7173 RSC.
- S. Q. Fang, T. C. Lang, T. Han, J. Y. Wang, J. Y. Yang, S. X. Cao, L. L. Peng, B. T. Liu, A. N. Yakovlev and V. I. Korepanov, Zero-thermal-quenching of Mn4+ far-red-emitting in LaAlO3 perovskite phosphor via energy compensation of electrons’ traps, Chem. Eng. J., 2020, 389, 124297 CrossRef CAS.
- T. Hu, H. Lin, Y. Cheng, Q. M. Huang, J. Xu, Y. Gao, J. M. Wang and Y. S. Wang, A highly-distorted octahedron with a C2v group symmetry inducing an ultra-intense zero phonon line in Mn4+-activated oxyfluoride Na2WO2F4, J. Mater. Chem. C, 2017, 5, 10524–10532 RSC.
- Y. Li, Y.-Y. Li, K. Sharafudeen, G.-P. Dong, S.-F. Zhou, Z.-J. Ma, M.-Y. Peng and J.-R. Qiu, A strategy for developing near infrared long-persistent phosphors: taking MAlO3:Mn4+,Ge4+ (M = La, Gd) as an example, J. Mater. Chem. C, 2014, 2, 2019–2027 RSC.
- S. S. Liang, G. G. Li, P. P. Dang, Y. Wei, H. Z. Lian and J. Lin, Cation substitution induced adjustment on lattice structure and photoluminescence properties of Mg14Ge5O24:Mn4+: optimized emission for W-LED and thermometry applications, Adv. Opt. Mater., 2019, 7, 1900093 CrossRef.
- M. H. Fang, W. L. Wu, Y. Jin, T. Lesniewski, S. Mahlik, M. Grinberg, M. G. Brik, A. M. Srivastava, C. Y. Chiang, W. Zhou, D. Jeong, S. H. Kim, G. Leniec, S. M. Kaczmarek, H. S. Sheu and R. S. Liu, Control of luminescence by tuning of crystal symmetry and local structure in Mn4+-activated narrow band fluoride phosphors, Angew. Chem., Int. Ed., 2018, 57, 1797–1801 CrossRef CAS PubMed.
- M. H. Du, Chemical trends of Mn4+ emission in solids, J. Mater. Chem. C, 2014, 2, 2475–2481 RSC.
- K. Saritas, W. M. Ming, M. H. Du and F. A. Reboredo, Excitation energies of localized correlated defects via quantum Monte Carlo: a case study of Mn4+-doped phosphors, J. Phys. Chem. Lett., 2019, 10, 67–74 CrossRef CAS PubMed.
- D. Fukuda, Microstructure and photoluminescence properties of Mg-doped BaTiO3:Pr3+ phosphors, J. Am. Ceram. Soc., 2007, 90, 2670–2672 CrossRef CAS.
- G. Gasparotto, L. Tavares, T. Silva, L. Maia and J. Garvalho, Structural and spectroscopic properties of Eu3+ doped Y4Al2O9 compounds through a soft chemical process, J. Lumin., 2018, 204, 513–519 CrossRef CAS.
- T. Ungár, Microstructural parameters from X-ray diffraction peak broadening, Scr. Mater., 2004, 51, 777–781 CrossRef.
- M. S. Cai, T. C. Lang, T. Han, D. Valiev, S. Q. Fang, C. Z. Guo, S. S. He, L. L. Peng, S. X. Cao, B. T. Liu, L. Du, Y. Zhong and E. Polisadova, Novel cyan-green-emitting Bi3+-doped BaScO2F, R+ (R = Na, K, Rb) perovskite used for achieving full-visible-spectrum LED lighting, Inorg. Chem., 2021, 60, 15519–15528 CrossRef CAS PubMed.
- S. Hariyani and J. Brgoch, Local structure distortion induced broad band emission in the all-inorganic BaScO2F:Eu2+ perovskite, Chem. Mater., 2020, 32, 6640–6649 CrossRef CAS.
- J. Q. Chen, C. H. Yang, Y. B. Chen, J. He, Z.-Q. Liu, J. Wang and J. L. Zhang, Local structure modulation induced highly efficient far-red luminescence of La1−xLuxAlO3:Mn4+ for plant cultivation, Inorg. Chem., 2019, 58, 8379–8387 CrossRef CAS PubMed.
- G. X. Li, G. Li, Q. Mao, L. Pei, H. Yu, M. J. Liu, L. Chu and J. S. Zhong, Efficient luminescence lifetime thermometry with enhanced Mn4+-activated BaLaCa1−xMgxSbO6 red phosphors, Chem. Eng. J., 2022, 430, 132923 CrossRef CAS.
- Z.-Q. Ye, S.-G. Xiao and X.-L. Yang, Up-conversion of Nd3+/Yb3+/Tm3+ tri-doped CaTeO3 compound under excitation of 808 nm, Rare Met., 2021, 40, 1008–1013 CrossRef CAS.
- L. Ma, Z. G. Xia, V. Atuchin, M. Molokeev, S. Auluck, A. H. Reshak and Q. L. Liu, Enginering oxygen vacancies towards self-activated BaLuAlx,Zn4−xO7−(1−x)/2 photoluminescent materials: An experimental and theoretical analysis, Phys. Chem. Chem. Phys., 2015, 17, 31188–31194 RSC.
- V. Atuchin, L. Isaenko, V. Kesler, M. Molokeev, A. Yelisseyev and S. Zhurkov, Exploration on anion ordering, optical properties and electronic structure in K3WO3F3 elpasolite, J. Solid State Chem., 2012, 187, 159–164 CrossRef CAS.
- H. P. Ji, Z. H. Huang, Z. G. Xia, M. S. Molokeev, X. X. Jiang, Z. S. Lin and V. V. Atuchin, Comparative investigations of the crystal structure and photoluminescence property of eulytite-type Ba3Eu(PO4)3 and Sr3Eu(PO4)3, Dalton Trans., 2015, 44, 7679–7686 RSC.
- S. Y. Li, Q. Zhu, J. Q. Xiahou and J.-G. Li, Doping Pb2+ in LaAlO3 to generate dual emission centers and an optical storage container for visible and near infrared persistent luminescence, Dalton Trans., 2022, 51, 1112–1122 RSC.
- Y. Zhou, X. M. Wang, C. P. Wang, T. Zhang, Y. G. Wang, F. Dou and H. Jiao, A strong zero-phonon line red phosphor BaNbF7:Mn4+ for white LEDs, Inorg. Chem. Front., 2020, 7, 3371–3378 RSC.
- T. S. Sreena, P. P. Rao, A. K. V. Raj and T. R. A. Thara, Exploitation of Eu3+ red luminescence through order–disorder structural transitions in lanthanide stannate pyrochlores for warm white LED applications, Phys. Chem. Chem. Phys., 2018, 20, 24287–24299 RSC.
- Q. Zhou, J. Wan, Y. Y. Zhou, S. Zhang, D. X. Shi, X. L. Xie, H. Q. Pu, Y. Q. Ye and Z. L. Wang, Ultraintense zero-phonon line from a Mn4+ red-emitting phosphor for high-quality backlight display applications, Inorg. Chem., 2021, 60, 19197–19205 CrossRef CAS PubMed.
- J. A. Nelson, E. L. Brant and M. J. Wagner, Nanocrystalline Y2O3:Eu phosphors prepared by alkalide reduction, Chem. Mater., 2003, 15, 688–693 CrossRef CAS.
- H. P. Ji, Z. H. Huang, Z. G. Xia, M. S. Molokeev, M. Y. Chen, V. V. Atuchin, M. H. Fang, Y. G. Liu and X. W. Wu, Phase transformation in Ca3(PO4)2:Eu2+ via the controlled quenching and increased Eu2+ content: identification of new cyan-emitting α-Ca3(PO4)2:Eu2+ phosphor, J. Am. Ceram. Soc., 2015, 98, 3280–3284 CrossRef CAS.
- Y. Wei, C. C. Lin, Z. W. Quan, M. S. Molokeev, V. V. Atuchin, T.-S. Chan, J. Lin and G. G. Li, Structural evolution induced preferential occupancy of designated cation sites by Eu2+ in M5(Si3O9)2 (M = Sr, Ba, Y, Mn) phosphors, RSC Adv., 2016, 6, 57261–57265 RSC.
- G. G. Li, C. C. Lin, W.-T. Chen, M. S. Molokeev, V. V. Atuchin, C.-Y. Chiang, W. Z. Zhou, C.-W. Wang, W.-H. Li, H.-S. Sheu, T.-S. Chan, C. G. Ma and R. S. Liu, Photoluminescence tuning via cation substitution in oxonitridosilicate phosphors: DFT calculations, different site occupations, and luminescence mechanisms, Chem. Mater., 2014, 26, 2991–3001 CrossRef CAS.
- S. Q. Fang, T. C. Lang, T. Han, M. S. Cai, S. X. Cao, L. L. Peng, B. T. Liu, Y. Zhong, A. N. Yakovlev and V. I. Korepanov, A novel efficient single-phase dual-emission phosphor with high resemblance to the photosynthetic spectrum of chlorophyll A and B, J. Mater. Chem. C, 2020, 8, 6245–6253 RSC.
Footnote |
| † Electronic supplementary information (ESI) available. See DOI: https://doi.org/10.1039/d2qi01683d |
| This journal is © the Partner Organisations 2023 |