 Open Access Article
Effect of the water coverage on the interaction of O2 and H2 with the Na-LTA zeolite by first-principles simulations
Joharimanitra
Randrianandraina
 a,
Michael
Badawi
 *b,
Christophe
Ramseyer
 a,
Bruno
Cardey
 a,
Jean-Emmanuel
Groetz
a,
Noah
Perreau
a,
Freddy
Torrealba-Anzola
a,
Caroline
Chambelland
c,
Didier
Ducret
c and
Manuel
Grivet
a,
Jean-Emmanuel
Groetz
a,
Noah
Perreau
a,
Freddy
Torrealba-Anzola
a,
Caroline
Chambelland
c,
Didier
Ducret
c and
Manuel
Grivet
 *a
*a
aLaboratoire Chrono-Environnement, UMR 6249, Université de Bourgogne Franche-Comté, F-25000, Besançon, France. E-mail: manuel.grivet@univ-fcomte.fr; Tel: +33 3 81 66 65 16
bLaboratoire de Physique et Chimie Théoriques, UMR 7019, CNRS, Université de Lorraine, F-54000, Nancy, France. E-mail: michael.badawi@univ-lorraine.fr; Tel: +33 3 72 74 98 67
cCEA, Centre d’études de Valduc, F-21120 Is-sur-Tille, France
First published on 11th November 2022
Abstract
The very wide applications of LTA zeolites, e.g. tritiated water storage, imply that a precise atomic-scale description of the adsorption processes taking place in their structure is crucial. The zeolite structure seems to have a catalytic effect on the O2/H2 recombination during the storage process after water radiolysis. To look closely at the conditions that could bring O2 and H2 to this particular point, we have conducted investigations using static DFT and systematic ab initio molecular dynamics calculations. We have investigated the interaction of these two molecules with the sodium cations, on which the adsorption capacity of the Na-LTA zeolite depends. The O2 and H2 molecules’ behaviour inside the cavities is linked to the Na+ position and availability. The latter is regulated by the presence of H2O which interacts with Na+ in a stronger way than O2 and H2. Thus, the adsorption studies of different mixtures (O2/H2O, H2/H2O and H2/O2) have been carried out to characterise the competition between water and other guest molecules. The absence of an obvious interaction between the adsorbates strongly suggests a potential reaction path involving the catalytic effect of the zeolite. Since we have been able to show that the behaviour of O2 and H2 molecules is directly affected by the water coverage rate, the reaction path is very likely to be affected too. These results mark a step towards the description of a recombination mechanism between O2 and H2 in a zeolite structure, a crucial issue for such systems involving tritiated water adsorbed in nanoporous materials.
1. Introduction
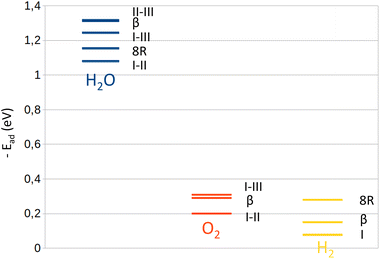
With the development of projects requiring the use of tritium such as ITER, the treatment of tritiated waste will be a major environmental issue in the future. This waste can be found in the form of tritiated water adsorbed in nanoporous materials such as zeolites, during which a water radiolysis phenomenon occurs where oxygen and hydrogen are the main gas products. Experimental studies carried out by L. Frances et al.1,2 showed a progressive decrease of these products from the resulting gaseous formation through time until their total disappearance. Although the water radiolysis reaction is enhanced by the catalytic effect of the zeolite into which it is contained, L. Frances et al. presumed that the aluminosilicate structure also contributes to the recombination of O2 and H2 back to H2O, with which is associated the gaseous quantity decrease. The period in which these decays occur depends on the loading rate of water present in the zeolite: the higher the loading rate, the later they start. The strong affinity between the water molecules and the Na+ cations of the Na-LTA zeolite, as observed in our previous study,3 leads us to link this time lag to the hindrance to the access of O2 and H2 molecules to the cationic sites by H2O. Therefore, the zeolite contributes to the catalysis of the recombination reaction of the two molecules through the Na+ cations. This implies that the dihydrogen and dioxygen molecules must interact with the zeolite, i.e., the cations, for the recombination reaction to start.The role of the adsorbent surface as a catalyst has already been studied on other surfaces than zeolites, mostly metallic.4–8 G. J. K. Acres9 observed the inhibitory effect (as a decrease of the reaction rate) of water on H2/O2 recombination on a platinum surface. As the surface catalyses the dissociation of dihydrogen and dioxygen molecules, its coating by water prevents both from interacting with the surface. Acres thus showed the necessity for the molecules to be in contact with the adsorbing surface in order to be activated, in good agreement with the observations from the experimental works by L. Frances et al.1 concerning the delaying effect of water on the decrease of the amounts of O2 and H2 molecules in zeolites. L. Morales,10 who studied the recombination on a plutonium dioxide surface, emphasizes the important role of a catalyst that the surface plays in the reaction and minimizes that of the radicals formed during radiolysis. Lloyd and Eller11 define this catalytic role of the surface as being a platform on which the O2 and H2 molecules dissociate before recombining. Like Acres,9 Morales also noted that the presence of water on the surface reduces the rate of the reaction because its strong affinity limits the access of O2 to the surface. The adsorption studies of H2O, O2 and H2 in zeolites showed that the order of the adsorption affinity of the molecules in zeolites is as follows: H2O ≫ O2 > H2![[thin space (1/6-em)]](https://www.rsc.org/images/entities/char_2009.gif) 12–18 as represented in Fig. 1. The affinity of O2 for zeolites is thus more important than that of H2. In addition to the presence of H2O, this difference also affects the rate of the reaction between O2 and H2 as shown by G. J. K. Acres,9 who observed a faster rate of reaction when O2 is previously present on the Pt surface and inversely when it is the case of H2. A strong interaction of the molecule, whether O2 or H2, with the surface thus accelerates its activation to dissociation followed by recombination. Numerous studies of O2 and H2 molecules’ dissociation in zeolites19–21 highlighted the contribution of cations on their activation. These play a significant part in the catalysis by zeolites, especially by controlling the interaction between adsorbates and adsorbents. These observations lead us to assume that a possible path to recombination between the two adsorbed molecules is through their dissociation via the adsorbent surface, where water plays a disruptive role.
12–18 as represented in Fig. 1. The affinity of O2 for zeolites is thus more important than that of H2. In addition to the presence of H2O, this difference also affects the rate of the reaction between O2 and H2 as shown by G. J. K. Acres,9 who observed a faster rate of reaction when O2 is previously present on the Pt surface and inversely when it is the case of H2. A strong interaction of the molecule, whether O2 or H2, with the surface thus accelerates its activation to dissociation followed by recombination. Numerous studies of O2 and H2 molecules’ dissociation in zeolites19–21 highlighted the contribution of cations on their activation. These play a significant part in the catalysis by zeolites, especially by controlling the interaction between adsorbates and adsorbents. These observations lead us to assume that a possible path to recombination between the two adsorbed molecules is through their dissociation via the adsorbent surface, where water plays a disruptive role.
To our knowledge, no study has yet been carried out to describe the O2/H2 competition, let alone their recombination mechanism in zeolites with Na+ cations, neither numerically nor experimentally. Yet, the different works cited above show the interest of understanding such competition governed by H2O in an accessible and no less efficient porous material such as a zeolite. Given the stronger interaction of O2 molecules with zeolites compared to that of H2, we have described the O2⋯Na+ and H2⋯Na+ interactions and looked carefully at the influence of the occupancy rate of Na+ sites by H2O since there is probably a competition between the stable products of radiolysis and the water molecules. The recombination mechanism of the two molecules will not be described in this paper since our study on this topic is still in progress, but we will focus here on the path that leads to this phenomenon through the O2 and H2 molecules’ adsorption on dehydrated and hydrated Na-LTA zeolites. In particular, we demonstrate the important role played by the Na+ cation in the activation of O2 and H2 and assess how the water loading rate in the zeolite affects its catalytic efficiency. For this purpose, numerical methods like static and dynamic DFT have been used to provide a detailed description of the behavior of these molecules on the adsorption sites of the studied zeolites.
2. Materials and methods
2.1.Z4A and ZK4 models
Two zeolites from the LTA framework have been used for this work. Since the Z4A unit cell (672 atoms) cannot be reduced due to Lowenstein's rule,22,23 the smaller elementary lattice of the ZK4 zeolite was used as a substitute for ab initio molecular dynamics (AIMD) calculations.The optimised unit cell of the dehydrated Z4A framework has the chemical formula Na96Si96Al96O384![[thin space (1/6-em)]](https://www.rsc.org/images/entities/char_2009.gif) 24 with a Si/Al ratio of 1 and the following lattice parameters: a = 24.47 Å, b = 24.65 Å, c = 24.82 Å, α = 90.7°, β = 89.8° and γ = 90.1°. These are very similar to the initial values given by J. J. Pluth et al.25 The ZK4 unit cell was created from the optimised Z4A by extracting 1/8th of its lattice, i.e., one sodalite cage. Si and Al distributions have been rearranged to avoid the Al–O–Al sequence according to the model used by Yoshida et al.,26 who already used the ZK4 structure to substitute the Z4A unit cell for AIMD calculations. The ZK4 unit cell has the formula Na9Si15Al9O48 with a Si/Al ratio of 1.66 and the lattice parameters a = 12.35 Å b = 12.28 Å c = 12.19 Å α = 90.3°, β = 90.4°, and γ = 89.7° after DFT geometry optimisation.
24 with a Si/Al ratio of 1 and the following lattice parameters: a = 24.47 Å, b = 24.65 Å, c = 24.82 Å, α = 90.7°, β = 89.8° and γ = 90.1°. These are very similar to the initial values given by J. J. Pluth et al.25 The ZK4 unit cell was created from the optimised Z4A by extracting 1/8th of its lattice, i.e., one sodalite cage. Si and Al distributions have been rearranged to avoid the Al–O–Al sequence according to the model used by Yoshida et al.,26 who already used the ZK4 structure to substitute the Z4A unit cell for AIMD calculations. The ZK4 unit cell has the formula Na9Si15Al9O48 with a Si/Al ratio of 1.66 and the lattice parameters a = 12.35 Å b = 12.28 Å c = 12.19 Å α = 90.3°, β = 90.4°, and γ = 89.7° after DFT geometry optimisation.
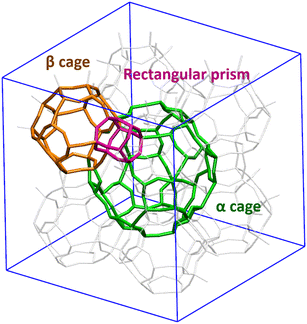
Both Z4A and ZK4 structures have three types of windows (4R, 8R and 8R) that allow the communication between the different cavities (Fig. 2). The 4R window is a pathway allowing access from the α and β cages to a rectangular prism. The 6R window is a passage between the α and β cages and the 8R window gives access between two α cages.
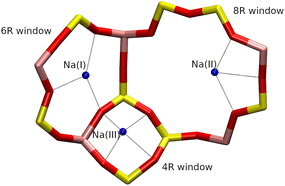
The Na+ cations are located on three cationic sites, denoted I, II and III, respectively (Fig. 3). In the Z4A unit cell, they are distributed as follows: 64 Na+ on site I on the 6R windows, denoted Na(I), 24 on site II inside the 8R windows, denoted Na(II), and 8 on site III, in front of the 4R windows, denoted Na(III). Thus, all 6R and 8R windows are occupied by one cation, in agreement with the description made by J. J. Pluth et al.25 To ensure the presence of local atomic configurations that can be found in both ZK4 and Z4A structures, the Na+ cations inside the ZK4 unit cell were distributed as follows: 6 on site I, 2 on site II and 1 on site III (Fig. 3).
2.2. Computational methods
To perform geometry optimisation and energy determination, density functional theory calculations were carried out using the Vienna Ab initio Simulation Package (VASP 5.4) code27 with the generalized gradient approximation and the Perdew–Burke–Ernzerhof exchange correlation functional.28,29 Pseudopotentials were described by using the projector-augmented wave method,30,31 and the D2 dispersion correction of Grimme32,33 was applied for the description of van der Waals forces. The plane wave cut-off energy was set to 520 eV. The Brillouin zone and the reciprocal space were sampled through the Γ-point sampling. The convergence criterion for ionic relaxation was set to 0.01 eV Å−1 for static DFT calculations.Ab initio molecular dynamics simulations (AIMD) were performed with the electronic parameters set for static DFT relaxations over a minimum total simulation time of 110 ps including a 15 ps of equilibration period. Systems containing hydrogen atoms require the use of a time step smaller than 1 fs (ref. 34 and 35) to avoid fictitious molecular splitting. Another method, that we did not apply in this work, consists of increasing the mass of the hydrogen atom to 3, which corresponds to the atomic mass of tritium. Thus, the time step of 1 fs would be suitable for reaction studies.36,37 The energy criterion for electronic convergence was set to 10−4 eV. The temperature was set to a mean of 298 K using the Andersen thermostat.38 The adsorption energies for static simulations (or binding energies, depending on the community) were calculated using the following expression:
 | (1) |
All of the illustration figures of the system and the RDF graphs have been generated with the VMD (visual molecular dynamics) program.†![[thin space (1/6-em)]](https://www.rsc.org/images/entities/char_2009.gif) 39
39
Because of the large size of the system with the Z4A unit cell (672 atoms), several optimisation steps were taken to ensure a smooth and accurate energy minimization of the structure. A first classical geometry optimisation was necessary using the general utility lattice program40 in order to preoptimise the structure, thus saving the computation time for the following DFT calculations as performed in our previous study.3
3. Results and discussion
3.1. O2 adsorption
To clarify how the O2 molecule interacts with the zeolite, we studied its adsorption in three types of structures (Fig. 4): purely silicated (Pur-Si), with one Al and one Na (1Al–1Na), and with two Al and two Na (2Al–2Na). Table 1 summarizes the calculated adsorption energies for these three systems.| System | E ad (eV) | O2⋯Na(Å) | O–O (Å) |
|---|---|---|---|
| Pur-Si | −0.114 | — | 1.23 |
| 1Al–1Na | −0.213 | 2.55 | 1.23 |
| 2Al–2Na | −0.294 | 2.66 and 2.69 | 1.23 |
These results show the important effect of Na+ cations on the adsorption of the O2 molecule inside the zeolite. It is the most stable when the molecule is interacting with two cations where the adsorption energies are ∼158% and ∼38% stronger than those for the silicated and 1Al–1Na systems, respectively.
The cationic sites of the LTA zeolite are distributed in its α and β cages. Although the probability for the O2 molecule to be present in the β cage is very weak, as shown in experimental adsorption studies, inside the dehydrated zeolites,16 water radiolysis leading to the production of oxygen occurs in both cavities. In this context, the β cage can therefore be occupied by the O2 molecule and the α cage. Thus, we have studied its adsorption inside both these parts of the Na-LTA zeolites.
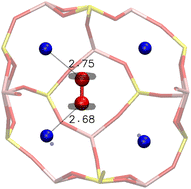
Inside the β cage, the optimised position of the O2 molecule lies unsurprisingly between two Na+ cations, with an adsorption energy of −0.290 eV. This stability is justified by the distribution of the electronic density around the oxygen atoms of O2 obtained from an electron localization function (ELF) study, as shown in Fig. 5, which illustrates the optimised position of the molecule inside the β cage. The electrons are distributed around the oxygen atoms of the molecule on a perpendicular plane to the O–O axis, which limits the configuration possibilities of the molecule with respect to the cation. In this represented configuration, each oxygen atom of O2 is interacting with one Na+ cation, with O(O2)⋯Na+ distances of 2.68 and 2.75 Å and a O–O bond length of 1.24 Å.
The dynamics (AIMD) calculations show that another possible configuration of O2 inside the β cage is when only one of its two O atoms interacts with two Na+ cations, as shown in Fig. 7 (config. 1). The mobility of the O2 molecule inside the β cage is then mainly oscillating between its four surrounding Na+ cations by alternating these configurations and gives the adsorbed molecule a very strong stability on its adsorption site.
A comparison between both the configurations will be discussed in the adsorption studies inside the α cage part, where both of them can be encountered as well.
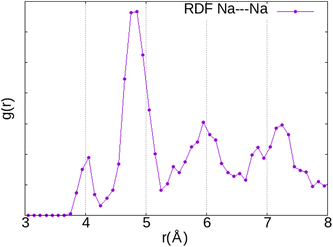
Since the interaction of the O2 molecule with the zeolite framework is mainly through the Na+ cation, its location inside the α cage should follow the distribution of the cationic sites (I, II and III). The radial function distribution (RDF) calculation of the Na⋯Na distance (Fig. 6) indicates that the shortest distance is located around 4 Å (first peak), mainly associated with those between Na(I) and Na(III) (∼3.90 Å) but also between Na(I) and Na(II) (∼4.4 Å), while the majority of Na+ cations are separated from each other by around 4.8 Å (second peak), which is associated with the distance between Na(I) cations. The shortest distance between the Na(II) and Na(III) cations is located around ∼5.2 Å. Therefore, taking into account the O2⋯Na distances calculated previously (2.6–2.7 Å), it is highly likely for the O2 molecule to be located between two cations. Hence, we have chosen the initial positions of the molecule before optimisation using static DFT calculations with reference to this observation.
The mobility of the cations of the Na-LTA zeolite depends on the sites on which they are located. The cations of sites II and III are more mobile than those located on site I.41–44 This is due to the coordination of Na+ with the oxygen atoms of the window where the site is located. This mobility of the cations has an influence on the stability of the adsorbed molecules, in particular, that of O2. For the static studies inside the α cage, we placed the O2 molecule on the two cationic sites of the Na-LTA zeolite between two cations: Na(I)–Na(II) and Na(I)–Na(III). For each position, the two configurations described above have been applied (Fig. 7):
• config. 1: one oxygen atom interacting with two cations,
• config. 2: each of the oxygen atoms of the molecule interacting with a cation.
The calculation of the adsorption energies shows that the affinity of the adsorbed O2 molecule with the zeolite structure varies according to its stabilized position. This affinity seems stronger when the guest molecule is located between Na(I) and Na(III), and preferably positioned according to the configuration config. 2 (Table 2). This can be explained by the higher mobility of the Na(III) cation compared with those belonging to the other sites.25,41,45 The Na+ cation and the O2 molecule thus approach each other mutually. Moreover, the O–O bond seems to stretch in this particular position (1.25 Å).
| Position | Values | Config. 1 | Config. 2 | Diff |
|---|---|---|---|---|
| Inside the β cage | E ad | — | −0.290 | — |
| Na(I)⋯Na(I) | — | 4.47 | — | |
| O(O2)⋯Na(I) | — | 2.68 and 2.75 | — | |
| O2 bond length | — | 1.24 | — | |
| Na(I)/Na(II) | E ad | −0.200 | −0.233 | 0.033 |
| Na(I)⋯Na(II) | 4.38 | 4.45 | 0.07 | |
| O(O2)⋯Na(I) | 2.90 | 2.68 | 0.22 | |
| O(O2)⋯Na(II) | 2.75 | 2.63 | 0.12 | |
| O2 bond length | 1.24 | 1.23 | 0.01 | |
| Na(I)/Na(III) | E ad | −0.309 | −0.332 | 0.023 |
| Na(I)⋯Na(III) | 3.85 | 3.92 | 0.07 | |
| O(O2)⋯Na(I) | 2.65 | 2.63 | 0.02 | |
| O(O2)⋯Na(III) | 2.57 | 2.50 | 0.07 | |
| O2 bond length | 1.24 | 1.25 | 0.01 | |
Whether or not this elongation (+0.02 Å compared with the bond length in the gaseous phase) is significant enough to be considered as a preparation of the molecule for dissociation remains to be discussed. When O2 is located between Na(I) and Na(II), its bond length is shortened by 0.01 Å from config. 1 to config. 2 (Table 2). However, this configuration seems to be more favorable energetically speaking and referring to the relationship between the bond order and the bond length made by T. Chen and T. A. Manz,46,47 a variation of the bond length means a variation of the bond order. In our case, we observe a decrease of the O–O bond order, i.e. a weakening of the bond.
From a dynamics perspective, both configurations can be encountered during the evolution of the O2 molecule in the α cage (Fig. 8). In a time interval of 120 ps, the molecule has moved from its initial cationic site to a neighbouring site with a residence time of about 30 ps at each site, whereas the molecule remains 1 to 2 ps in one configuration before changing to another.
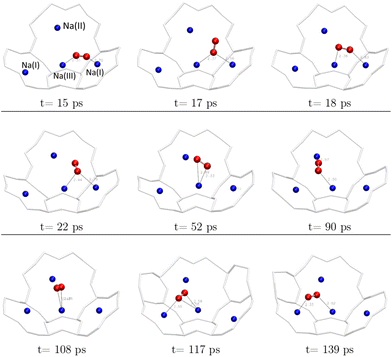 | ||
| Fig. 8 Transition from one cationic site to another of the O2 molecule during the AIMD calculations (duration: 139 ps) – each figure represents a snapshot of the position of the molecule at moment t. | ||
Therefore, the cations slow down the diffusion of the O2 molecule inside the α cage by moving it from one cationic site to another – at least in the case of a fully dehydrated zeolite where all Na+ sites are available to the molecule.
Actually, given the stronger interaction of water with the Na+ cation compared with that of O2,16,18,48,49 the latter has only access to the cationic sites that are still unoccupied by the H2O molecules. Indeed, static DFT calculations of the co-adsorption of the two molecules have shown that the presence of O2 near the H2O adsorption site is not sufficient to remove the watermolecule from it, either in the β or α cage.
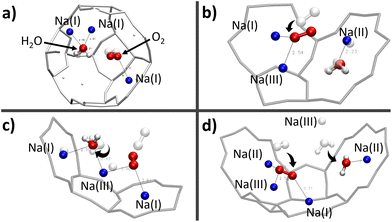
The first observation is that, in most configurations, the water molecule remains on its adsorption site (Fig. 9a–c) where its equilibrium position has already been well optimised. Even the fact that both O2 and H2O molecules interact with the same Na(III) cation (Fig. 9c) is not sufficient to release the water molecule from its adsorption site. Instead, it reorientates itself while remaining in interaction with the two cations Na(I) and Na(III). However, when the H2O molecule is placed between Na(II) and Na(III) (Fig. 9d), the water molecule is only in a pseudostable position considering the distance of Na(II)⋯Na(III) (∼5.2 Å), which is longer than those of Na(I)⋯Na(III) and Na(I)⋯Na(II) as we have seen earlier on the description of the intercationic distances (Fig. 6). The perturbation brought by the addition of the O2 molecule naturally leads the water molecule to reconfigure its equilibrium position for a more stable site nearby, i.e., the 8R window. One of the atoms of O2 is then interacting with two cations Na(II) and Na(III), which are separated by a Na(II)⋯Na(III) distance of 4.79 Å, with Na⋯O2 distances of 2.60 and 2.52 Å, respectively, while the other oxygen atom is interacting with one Na(I) at a distance of 2.71 Å. The observations made on these systems do not show a clear interaction between H2O and O2, both molecules tend to favor interactions with the Na+ cations. There is thus a competition between O2 and H2O molecules to occupy the cationic sites. More precisely, since both molecules interact preferably with the Na+ cations, the occupation of the site by the O2 molecule depends on its availability, and thus its occupancy rate by H2O molecules. This was confirmed by our AIMD calculations where the evolution of two O2 molecules inside the α cage has been studied as a function of the number of water molecules in the cage (N). As N increases, the dioxygen molecules have less and less access to the cationic sites, as shown by the radial distribution function of the O2⋯Na distance (Fig. 10) where the intensity of the first peak (located at ∼2.75 Å), representing the distance between O2 and the nearest Na+ cation, decreases as the water loading increases until N = 15. Then its intensity becomes lower than that of the other peaks located at other distances.
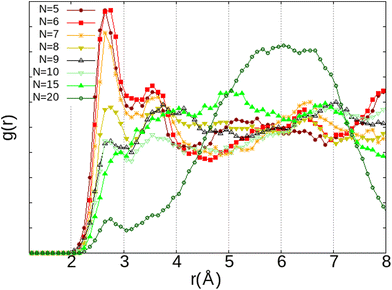 | ||
| Fig. 10 RDF of the O2⋯Na+ distance depending on the number of H2O molecules (N) inside the α cage from AIMD calculations – each system is constituted of N H2O and 2 O2. | ||
This correlates with the experimental observation by Izumi and Suzuki50 where a clear decrease of the O2 adsorption capacity of the Na-LTA zeolite is noted from a water loading rate of 15% (approximately ∼15 H2O in the α cage), which supports the role of Na+ cations in the adsorption of the O2 molecule. At this particular point of the water filling of the α cage, it is relevant to state that the majority of the cations are occupied at least by one water molecule.3 Accordingly, the interaction of the O2 molecules with the cationic sites is more and more restricted by the presence of water until there is no (or very little) access to cations, as shown in Fig. 10 at N = 20, corresponding to the number of H2O molecules in the α cage near the saturation of the zeolite which is around 25 H2O per α cage.41,49,51,52 At this stage of water filling, the O2 molecules are mostly distributed around 6 Å from the nearest Na+ cation, the majority peak is shifted by +3.25 Å with respect to the positions of the other water quantities, even if the O2 molecules occasionally interact with the cations at a distance of 2.75 Å (Fig. 10, N = 20). However, an increase in the number of water molecules does not promote the formation of hydrogen bonds between O2 and H2O molecules, which remain mostly at a distance of 3.75 Å from each other, as shown by the radial distribution function of the distance O(O2)⋯HW between the oxygen atom of O2 and the hydrogen atom of H2O (Fig. 11). Again, at N = 10, the reciprocal behavior of O2 and H2O is different from those associated with other water quantities. The results obtained from Fig. 10 and 11 allow us to say that the mobility of the O2 molecule in the α cage is particularly important when 15 water molecules are present since as we said previously, all the cations are occupied by at least one H2O molecule. This step represents the saturation of the cationic sites of the α cage and the accentuation of the growth in the number of hydrogen bonds between the water molecules53 (Fig. 12).
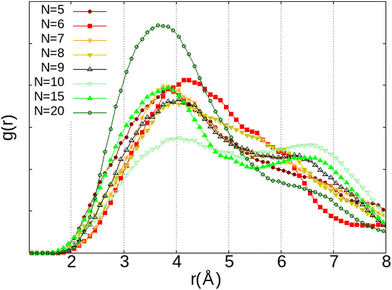 | ||
| Fig. 11 RDF of the distance between the oxygen atom of O2 and the hydrogen atom of H2O (O2⋯HW) as a function of the number of H2O molecules (N) inside the α cage obtained from AIMD calculations. | ||
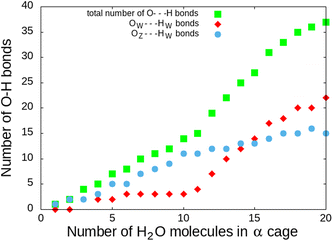 | ||
| Fig. 12 Number of H bonds during water filling of the α cage of the Na-LTA zeolite – OW⋯HW is the H-bond formed between the water molecules and OZ⋯HW is the H-bond formed between the water molecule and the zeolite structure.53 O⋯H distances less than 2.1 Å have been taken into account as the H bond. | ||
Therefore, the amount of water in the cavity not only affects the interaction of the O2 molecules with the zeolite but also their mobility. On the one hand because of the competition between the two molecules (O2 and H2O) for the occupation of the cationic sites, on the other hand because of the congestion created by the water molecules forming rings between them via hydrogen bonds and Na+ cations. One of the direct consequences of this phenomenon was observed experimentally by L Frances et al.1 on the consumption of the gaseous phase composed, among other elements, of O2 that has been released following the radiolysis of water in the Na-A zeolite (Fig. 13). The delay between each decrease in the O2 component is closely related to the amount of water present in the structure, i.e., the water loading rate that is indicated in mass % in the results. It is interesting to note that this decay does not occur when the zeolite is saturated, i.e., when the O2 molecules in the zeolite do not have access to the Na+ sites because of their total occupation by water molecules. One of the hypothesis to explain this decrease in the quantity of O2 is its recombination with H2, which is also a product of water radiolysis, to form back water. This implies that the recombination reaction requires the contact of the reactants O2 and most likely H2 with the cations, which underlines the catalytic role of the zeolite.
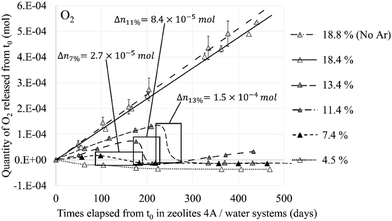 | ||
| Fig. 13 Released quantity of O2 from the NaA zeolite at different water loading rates – framed periods indicate the gas decrease and the quantity of reacting O2. Reprinted with permission from L. Frances et al.1 Copyright 2015 Amercian Chemical Society. | ||
Hence, as for the O2 molecule, we have studied the interaction of H2 with the Na-LTA zeolite and the other adsorbates (H2O and O2).
3.2. H2 adsorption
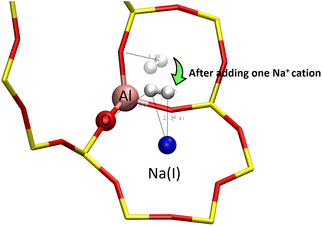
First, to describe the interaction of the H2 molecule with the zeolite framework, its adsorption was studied through the static DFT method inside two types of LTA structures: purely silicated (no cation) and with one Na+ cation (Fig. 14).The adsorption energy calculations yielded a more stable configuration when the molecule is adsorbed on a cation at the H2⋯Na distances of 2.34 and 2.41 Å (Table 3). When adsorbed inside the structure composed of one Na+ cation, the distance of 2.64 Å between the H2 molecule and one oxygen atom of the zeolite framework indicates the formation of a weak hydrogen bond between the adsorbate and the adsorbent. Therefore, the H2 molecule also interacts with the oxygen of the zeolite in addition to Na+, although the latter remains the main actor in the interaction of H2 with the zeolite. The most stable configuration for the molecule seems to be when its two hydrogen atoms are in interaction with the same Na+ cation, which is described as the most stable equilibrium geometry for the Na+H2 complex.54–56
| System | E ad (eV) | H2⋯Na+ (Å) | H2⋯OZ (Å) | H–H (Å) |
|---|---|---|---|---|
| Pur-Si | −0.049 | — | 3.24 | 0.75 |
| 1Al–1Na | −0.182 | 2.34 and 2.41 | 2.64 | 0.75 |
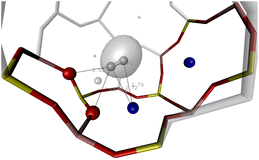
The way H2 interacts with the oxygen atoms of the zeolite depends on its environment and the proximity of the oxygen atoms. For example, inside the β cage, the proximity between the oxygen atoms of the wall provided by the confinement of the cage gives H2 the possibility to interact with two oxygen atoms from the zeolite wall, which results in an asymmetry in the distribution of the electronic isodensity around the molecule (Fig. 15) and an adsorption energy of −0.077 eV.
Elsewhere, inside the α cage, H2 adopts the same configuration as in the β cage, i.e., the two hydrogen atoms are interacting with the same Na+ cation, while a hydrogen bond is formed between the adsorbate and the adsorbent, with an adsorption energy of −0.151 eV. These interactions between the H2 molecule and the zeolite remain short-range, the molecule very weakly perceives the effect of the adsorbent surface when it is placed close to the middle of the α cage, ∼4.5 Å from the nearest Na+ cation (adsorption energy of −0.027 eV). It is interesting to note that this value represents a weaker adsorption of the H2 molecule compared to that in the purely silicated structure (−0.049 eV, Table 3). This can be explained by the position of the molecule which is closer to the walls of the zeolite in this latter case, the influence of the adsorbing surface through its oxygen atoms is therefore more important with respect to the case where the H2 molecule is at least at 4.75 Å from the closest Na+ cation and 5.38 Å from the nearest oxygen atom of the cage (Table 4). The values in Table 4 are given to compare the interactions of the H2 molecule with the zeolite according to its localisation and configuration inside the α cage. In each case, the bond length of the molecule remained equal to 0.75 Å. The adsorption of the H2 molecule does not seem to affect its geometry, except for one particular configuration where it is located on a 8R window (Fig. 16).
| Location | E ad (eV) | H2⋯Na (Å) | H2⋯OZ (Å) |
|---|---|---|---|
| Inside β | −0.077 | 2.72 and 2.79 | 2.65 and 2.67 |
| Close to the α center | −0.027 | 4.57 | 5.38 |
| Near the Na+ cation in the α cage | −0.151 | 2.43 and 2.37 | 2.59 |
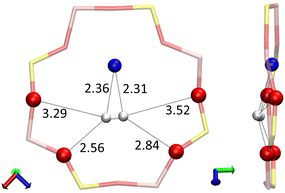
When adsorbed on the 8R window, the two hydrogen atoms of the H2 molecule interact with the same Na(II) cation at H2⋯Na+ distances of 2.31 and 2.36 Å, each of them also form hydrogen bonds with the oxygen atoms of the window where the shortest H2⋯OZ distances are at 2.84 and 2.56 Å. This configuration gives the H2 molecule a bond length of 0.76 Å (0.01 Å longer than for the other configurations). However, the most peculiar value is that of the adsorption energy of −0.280 eV, which is unusually strong for the H2 molecule, because this implies a stronger adsorption than for some O2 sites as seen in Fig. 1.
This “abnormally” high value of the adsorption energy of the H2 molecule is also noticed by Areán et al.57 for the same configuration, in their adsorption studies of the molecule in a CaA zeolite (of the LTA structure with Ca2+ cations). They attribute this strong stability of the molecule to its particularly favorable configuration with a strong electrostatic interaction with the oxygen atoms of the zeolite, in addition to its interaction with the cation. This configuration thus seems very stable for H2. It turns out that the 8R window is also among the most stable adsorption site for the H2O molecule inside the α cage.3 Further investigations are obviously needed on this particular adsorption site since it amplifies the catalytic effect of the zeolite on H2O and H2 molecules. Ab initio molecular dynamics calculations inside the α cage have confirmed the H2 molecule preference to interact with the Na+ cation instead of the oxygen atom of the zeolite, as shown by the radial distribution functions where the distances between the H2 molecule and the Na+ cations (H2⋯Na+) are mostly distributed around 2.45 Å (Fig. 17a). This result is consistent with the potential energy studies of the Na+–H2 interaction,54,58 albeit longer (∼+0.1 Å) than the value that we have obtained from static calculations. The distribution for those between the adsorbed molecule and the oxygen atoms of the structure (H2⋯OZ) is wider (Fig. 17b), showing a small contribution of Oz atoms to the displacement of H2.
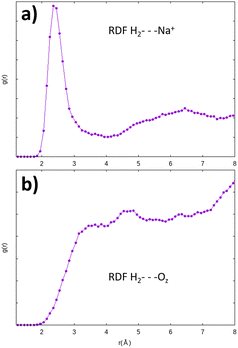 | ||
| Fig. 17 Radial distribution function of the H2⋯Na+ (a) and H2⋯OZ (b) distances obtained from AIMD calculations – the interaction of H2 with the Na+ cation is preponderant. | ||
The residence time of the H2 molecule on the cationic sites is less than 1 ps (∼0.22 ps), which is a much shorter duration than for the O2 molecule (∼30 ps). The mobility of the H2 molecule in the α cage is therefore more important than that of O2 although both evolve from a cationic site to another, which is in accordance with the results of Kahn et al.59 who describe the movement of the H2 molecule in the zeolite as a succession of jumps from one site to another.
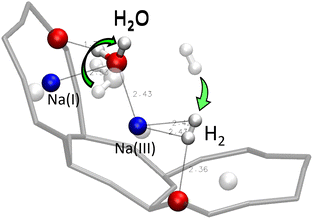 | ||
| Fig. 18 Optimised position of the H2/H2O mixture inside the α cage after static DFT calculations – the positions of the adsorbed molecules before the optimisation are represented in transparent. | ||
In this configuration, the two atoms of H2 interact with the same Na(III) cation, at H2⋯Na(III) distances of 2.42 and 2.43 Å, while one of them is forming in parallel a hydrogen bond with the oxygen atom of the zeolite (H2⋯OZ distance of 2.36 Å). The H–H bond length is at 0.76 Å (+0.01 Å compared with the gas phase). However, the oxygen atom of the H2O molecule interacts with one Na(I) cation and the Na(III) cation, with which it shares the interaction with H2, it also forms an hydrogen bond with the oxygen of the structure, at a H2O⋯OZ distance of 1.71 Å, which is shorter than the one formed between H2 and the cage, i.e., the hydrogen bond between the water molecule and the zeolite is stronger than between the dihydrogen molecule and the adsorbant. At the same time, there seems to be no significant interaction between the guest molecules H2 and H2O, and the interaction with the zeolite being favored by both of them.
3.3. O2/H2 mixture studies
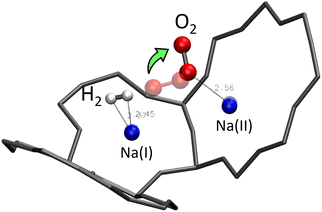
The absence of an obvious interaction is true between H2 (or O2) and the water molecule, but also between the H2 and O2 molecules. Static studies of the simultaneous adsorption of the two molecules inside the Na-LTA zeolite showed that the introduction of a H2 molecule near the optimised position of the O2 molecule can disturb its configuration, especially when H2 is directly placed on the Na+ cation with which the O2 molecule is already interacting (Fig. 19).In this particular configuration, the presence of H2 causes O2 to interact with only one Na+ located on site II, while both atoms of H2 interact with the same Na(I) with which O2 has previously interacted. The reasons for this reconfiguration of the O2 position are, on the one hand, the weakening of the O2⋯Na(I) interaction due to the positioning of H2 on the same cation, and on the other hand, the distance imposed by the repulsion between O2 and H2 that the dynamic calculations have estimated mainly around 3.85 Å for the co-adsorption of the two molecules inside the α cage (Fig. 20). Even increasing the probability of meeting between the two molecules by increasing their number in the alpha cage is not enough to sufficiently reduce the O2⋯H2 distance (which is decreased to 3.35 Å) to form a hydrogen bond.
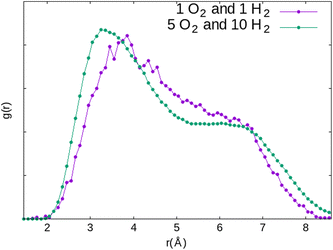 | ||
| Fig. 20 Comparison of the RDF of the O2⋯H2 distance in the α cage for two systems constituted of different numbers of adsorbates (1O2 + 1H2 and 5O2 + 10H2) obtained from AIMD calculations. | ||
This value of 3.35 Å is too important to consider the formation of a hydrogen bond between the two molecules even if the probability for this to occur is not zero if we take into account the O2⋯H2 distances between 2 and 3 Å regarded as weak hydrogen bonds (Fig. 20, 1 O2 and 1 H2). Therefore, as for the O2 molecule, water is the main regulator of the H2 molecules access to the cationic sites. Thus, even if the H2⋯Na+ interaction is weaker than that of O2⋯Na+, the impact of the occultation of these cationic sites by water on the H2 interaction with the zeolite and its mobility should be as consequential as for O2. The experimental observation of the consumption of gaseous hydrogen formation, released during water radiolysis in the NaA zeolite,1 is in line with our numerical calculations. As for O2 (Fig. 13), the time at which H2 decays start depends on the water loading rate in the zeolite (Fig. 21): the higher the coverage of the Na+ sites by H2O, the later the disappearance of H2 from the gaseous phase. Also, no decrease was observed when the Na-LTA zeolite is saturated with water, i.e., when no cationic site is available or to interact with H2. This behaviour should be observed from the point where all the cationic sites are occupied by H2O (at a loading rate of around 13–15%) and eventually O2, since the latter has priority over H2 in their occupation given a stronger O2 interaction with the cations.
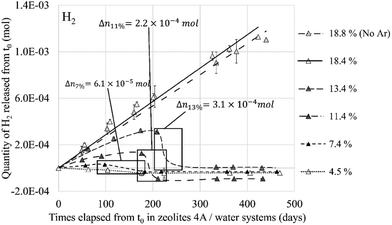 | ||
| Fig. 21 Released quantity of H2 from the NaA zeolite at different water loading rates – framed periods indicate the gas decrease and the quantity of reacting H2. Reprinted with permission from L. Frances et al.1 Copyright 2015 Amercian Chemical Society. | ||
The behaviour of both H2 and O2 molecules within the zeolite structure depends on the availability of the cationic sites, which is directly linked to their occupancy by water molecules. Experimental observations of the production and consumption of the two gases1 highlight this dependence (Fig. 13 and 21). Since a decrease in the quantity was observed for both O2 and H2 molecules, the hypothesis of recombination where the zeolite and the water would play a role in the catalyst and inhibitor, respectively, is put forward, considering the application of the Na+ cations in their adsorption as shown in this work. However, since no direct interaction leading to a reaction between H2 and O2 molecules has been noted inside the Na-LTA zeolite, the path to the recombination through the activation of the two molecules via the adsorbent surface, as described by L. Benco et al.19 and L. Chen et al.,20 is still under study.
4. Conclusions
The O2 molecule exhibits a higher affinity for the Na-LTA zeolite than H2 despite the fact that both interact with the Na+ cations. Therefore, as expected, the mobility of the H2 molecule in the structure is higher compared to that of O2, as shown by our ab initio molecular dynamics (AIMD) studies. As a result, both molecules evolve from one cationic site to another in the α cage, but the residence time of the O2 molecule is significantly longer than that of H2. This behaviour around the Na+ cations leads us to consider that the ‘vectorization’ of the displacement of H2 increases its probability to meet O2 while the latter is slowed down on its cationic site, especially since the studies of the co-adsorption of both molecules have shown that the interaction with the cations is favored rather than with the co-adsorbate. However, inside the hydrated zeolite structure, the cationic sites are mostly occupied by H2O molecules and their interaction with the cations is much stronger than those of O2 and H2 molecules. Thus, since the water molecule can hardly be removed by H2 and O2 from its adsorption site, only the remaining available sites will be occupied by O2 as shown previously by the RDF calculations (see Fig. 10). An increase of the water loading significantly reduces the possibility of O2 (and even more for H2) to access the Na+ sites which affect, on the one hand, its mobility and, on the other hand, its activation for the recombination reaction, as described by Acres9 on the reduction of the reaction rate due to the presence of water on the adsorbant surface. Then, with a high water loading rate, O2 and H2 molecules have less interaction with Na+ cations and higher mobility, thus reducing the probability of encounter between the two via a cation-guided trajectory. Experimental studies by L. Frances et al.2 have shown the important role that the amount of water adsorbed in the zeolite has in the production and consumption of O2 and H2 (Fig. 13 and 21). Through a simulation study, we have established a link between these experimental observations and the occupancy rate of the cationic sites which states that once all the cationic sites are hydrated, i.e., saturation of the Na+ sites, the consumption of O2 and H2 stops, leading to a continuous production of both gases as can be seen at a water loading rate of ∼18% in Fig. 13 and 21. The synchronized disappearance of both O2 and H2 being associated with the recombination phenomenon, these combined experimental and simulation results imply that the main actor in the catalytic role of the Na-LTA zeolite for H2/O2 recombination is the Na+ cation. The availability of cationic sites and the nature of the cation itself are therefore important factors to consider for an efficient catalytic effect of the zeolite.Conflicts of interest
There are no conflicts to declare.Acknowledgements
The computations in this work were performed on the supercomputer facilities of the Mésocentre de calcul de Franche-Comté and on the TGCC (Très Grand Centre de Calcul du CEA). We were granted access to the HPC resources of TGCC under the allocations 2019-A0060910785 and 2020-A0080910785 provided by GENCI.References
- L. Frances, M. Douilly, M. Grivet, D. Ducret and M. Théobald, Self-Radiolysis of Tritiated Water Stored in Zeolites 4A: Production and Behavior of H2 and O2, J. Phys. Chem. C, 2015, 119, 28462–28469 CrossRef CAS.
- L. Frances, M. Grivet, J.-P. Renault, J.-E. Groetz and D. Ducret, Hydrogen radiolytic release from zeolite 4A/water systems under γ irradiations, Radiat. Phys. Chem., 2015, 110, 6–11 CrossRef CAS.
- J. Randrianandraina, M. Badawi, B. Cardey, M. Grivet, J.-E. Groetz, C. Ramseyer, F. T. Anzola, C. Chambelland and D. Ducret, Adsorption of water in Na-LTA zeolites: an ab initio molecular dynamics investigation, Phys. Chem. Chem. Phys., 2021, 23, 19032–19042 RSC.
- S. Motoo and N. Furuya, Hydrogen and oxygen adsorption on Ir (111), (100) and (110) planes, J. Electroanal. Chem. Interfacial Electrochem., 1984, 167, 309–315 CrossRef CAS.
- J. E. Benson and M. Boudart, Hydrogen-oxygen titration method for the measurement of supported platinum surface areas, J. Catal., 1965, 4, 704–710 CrossRef CAS.
- J. Clavilier, A. Rodes, K. El Achi and M. Zamakhchari, Electrochemistry at platinum single crystal surfaces in acidic media: hydrogen and oxygen adsorption, J. Chim. Phys., 1991, 88, 1291–1337 CrossRef CAS.
- A. G. Sault, R. J. Madix and C. T. Campbell, Adsorption of oxygen and hydrogen on Au (110)-(1×2), Surf. Sci., 1986, 169, 347–356 CrossRef CAS.
- J. L. Gland, G. B. Fisher and E. B. Kollin, The hydrogen-oxygen reaction over the Pt (111) surface: Transient titration of adsorbed oxygen with hydrogen, J. Catal., 1982, 77, 263–278 CrossRef CAS.
- G. Acres, The reaction between hydrogen and oxygen on platinum, Platinum Met. Rev., 1966, 10, 60–64 CAS.
- L. Morales, Preliminary report on the recombination rates of hydrogen and oxygen over pure and impure plutonium oxides, Los Alamos National Laboratory, 1998, pp. 1–37 Search PubMed.
- J. A. Lloyd, P. G. Eller and L. Hyder, Literature search on hydrogen/oxygen recombination and generation in plutonium storage environments, Los Alamos National Laboratory, LA-UR-98-4557, Los Alamos, NM, 1998 Search PubMed.
- K. Chandrakumar and S. Pal, DFT and local reactivity descriptor studies on the nitrogen sorption selectivity from air by sodium and calcium exchanged zeolite-A, Colloids Surf., A, 2002, 205, 127–138 CrossRef CAS.
- P. F. Zito, A. Caravella, A. Brunetti, E. Drioli and G. Barbieri, Light gases saturation loading dependence on temperature in LTA 4A zeolite, Microporous Mesoporous Mater., 2017, 249, 67–77 CrossRef CAS.
- J. Salazar, S. Lectez, C. Gauvin, M. Macaud, J. Bellat, G. Weber, I. Bezverkhyy and J. Simon, Adsorption of hydrogen isotopes in the zeolite NaX: Experiments and simulations, Int. J. Hydrogen Energy, 2017, 42, 13099–13110 CrossRef CAS.
- N. Bouaziz, M. B. Manaa, F. Aouaini and A. B. Lamine, Investigation of hydrogen adsorption on zeolites A, X and Y using statistical physics formalism, Mater. Chem. Phys., 2019, 225, 111–121 CrossRef CAS.
- A. Goulay, J. Tsakiris and E. Cohen de Lara, Molecular interactions in nanoporous adsorbents. Adsorption of N2 and O2 in zeolites with cavities or channels: Na12A, Ca6A, NaX, and decationated mordenite, Langmuir, 1996, 12, 371–378 CrossRef CAS.
- F. Stéphanie-Victoire, A.-M. Goulay and E. Cohen de Lara, Adsorption and coadsorption of molecular hydrogen isotopes in zeolites. 1. Isotherms of H2, HD, and D2 in NaA by thermomicrogravimetry, Langmuir, 1998, 14, 7255–7259 CrossRef.
- J. M. Castillo, J. Silvestre-Albero, F. Rodriguez-Reinoso, T. J. Vlugt and S. Calero, Water adsorption in hydrophilic zeolites: experiment and simulation, Phys. Chem. Chem. Phys., 2013, 15, 17374–17382 RSC.
- L. Benco, T. Bucko, J. Hafner and H. Toulhoat, A density functional theory study of molecular and dissociative adsorption of H2 on active sites in mordenite, J. Phys. Chem. B, 2005, 109, 22491–22501 CrossRef CAS PubMed.
- L. Chen, H. Falsig, T. V. Janssens, J. Jansson, M. Skoglundh and H. Grönbeck, Effect of Al-distribution on oxygen activation over Cu–CHA, Catal. Sci. Technol., 2018, 8, 2131–2136 RSC.
- A. Shubin, G. Zhidomirov, V. Kazansky and R. Van Santen, DFT cluster modeling of molecular and dissociative hydrogen adsorption on Zn2+ ions with distant placing of aluminum in the framework of high-silica zeolites, Catal. Lett., 2003, 90, 137–142 CrossRef CAS.
- R. Bell, R. Jackson and C. Catlow, Löwenstein's rule in zeolite A: A computational study, Zeolites, 1992, 12, 870–871 CrossRef CAS.
- W. Loewenstein, The distribution of aluminum in the tetrahedra of silicates and aluminates, Am. Mineral., 1954, 39, 92–96 CAS.
- R. A. Jackson and C. R. A. Catlow, Computer Simulation Studies of Zeolite Structure, Mol. Simul., 1988, 1, 207–224 CrossRef.
- J. J. Pluth and J. V. Smith, Accurate redetermination of crystal structure of dehydrated zeolite A. Absence of near zero coordination of sodium. Refinement of silicon, aluminum-ordered superstructure, J. Am. Chem. Soc., 1980, 102, 4704–4708 CrossRef CAS.
- K. Yoshida, K. Toyoura, K. Matsunaga, A. Nakahira, H. Kurata, Y. H. Ikuhara and Y. Sasaki, Atomic sites and stability of Cs+ captured within zeolitic nanocavities, Sci. Rep., 2013, 3, 2457 CrossRef PubMed.
- G. Kresse and J. Furthmüller, Software VASP, Vienna (1999), Phys. Rev. B: Condens. Matter Mater. Phys., 1996, 54, 169 CrossRef PubMed.
- J. P. Perdew, K. Burke and M. Ernzerhof, Generalized Gradient Approximation Made Simple, Phys. Rev. Lett., 1996, 77, 3865–3868 CrossRef CAS PubMed.
- J. P. Perdew, K. Burke and Y. Wang, Generalized gradient approximation for the exchange-correlation hole of a many-electron system, Phys. Rev. B: Condens. Matter Mater. Phys., 1996, 54, 16533–16539 CrossRef CAS PubMed.
- G. Kresse and D. Joubert, From ultrasoft pseudopotentials to the projector augmented-wave method, Phys. Rev. B: Condens. Matter Mater. Phys., 1999, 59, 1758–1775 CrossRef CAS.
- P. E. Blöchl, Projector augmented-wave method, Phys. Rev. B: Condens. Matter Mater. Phys., 1994, 50, 17953–17979 CrossRef PubMed.
- S. Grimme, Semiempirical GGA-type density functional constructed with a long-range dispersion correction, J. Comput. Chem., 2006, 27, 1787–1799 CrossRef CAS.
- T. Bucko, J. Hafner, S. Lebegue and J. G. Angyán, Improved description of the structure of molecular and layered crystals: ab initio DFT calculations with van der Waals corrections, J. Phys. Chem. A, 2010, 114, 11814–11824 CrossRef CAS.
- D. G. Sangiovanni, G. Gueorguiev and A. Kakanakova-Georgieva, Ab initio molecular dynamics of atomic-scale surface reactions: Insights into metal organic chemical vapor deposition of AlN on graphene, Phys. Chem. Chem. Phys., 2018, 20, 17751–17761 RSC.
- C. Liu, H. Gao, A. Hermann, Y. Wang, M. Miao, C. J. Pickard, R. J. Needs, H.-T. Wang, D. Xing and J. Sun, Plastic and superionic helium ammonia compounds under high pressure and high temperature, Phys. Rev. X, 2020, 10, 021007 CAS.
- T. Bučko, S. Chibani, J.-F. Paul, L. Cantrel and M. Badawi, Dissociative iodomethane adsorption on Ag-MOR and the formation of AgI clusters: an ab initio molecular dynamics study, Phys. Chem. Chem. Phys., 2017, 19, 27530–27543 RSC.
- Y. Foucaud, S. Lebégue, L. O. Filippov, I. V. Filippova and M. Badawi, Molecular insight into fatty acid adsorption on bare and hydrated (111) fluorite surface, J. Phys. Chem. B, 2018, 122, 12403–12410 CrossRef CAS.
- H. C. Andersen, Molecular dynamics simulations at constant pressure and/or temperature, J. Chem. Phys., 1980, 72, 2384–2393 CrossRef CAS.
- W. Humphrey, A. Dalke and K. Schulten, VMD: Visual molecular dynamics, J. Mol. Graphics, 1996, 14, 33–38 CrossRef CAS.
- J. D. Gale, GULP: A computer program for the symmetry-adapted simulation of solids, J. Chem. Soc., Faraday Trans., 1997, 93, 629–637 RSC.
- J. Adams, D. Haselden and A. Hewat, The structure of dehydrated Na zeolite A (SiAl = 1.09) by neutron profile refinement, J. Solid State Chem., 1982, 44, 245–253 CrossRef CAS.
- P. Demontis and G. B. Suffritti, A comment on the flexibility of framework in molecular dynamics simulations of zeolites, Microporous Mesoporous Mater., 2009, 125, 160–168 CrossRef CAS.
- N. E. Zimmermann, S. Jakobtorweihen, E. Beerdsen, B. Smit and F. J. Keil, In-depth study of the influence of host- framework flexibility on the diffusion of small gas molecules in one-dimensional zeolitic pore systems, J. Phys. Chem. C, 2007, 111, 17370–17381 CrossRef CAS.
- A. García-Sánchez, D. Dubbeldam and S. Calero, Modeling adsorption and self-diffusion of methane in LTA zeolites: the influence of framework flexibility, J. Phys. Chem. C, 2010, 114, 15068–15074 CrossRef.
- D. A. Faux, W. Smith and T. R. Forester, Molecular Dynamics Studies of Hydrated and Dehydrated Na+-Zeolite-4A, J. Phys. Chem. B, 1997, 101, 1762–1768 CrossRef CAS.
- T. Chen and T. A. Manz, Bond orders of the diatomic molecules, RSC Adv., 2019, 9, 17072–17092 RSC.
- T. A. Manz, Introducing DDEC6 atomic population analysis: part 3. Comprehensive method to compute bond orders, RSC Adv., 2017, 7, 45552–45581 RSC.
- J. Soussen-Jacob, J. Tsakiris and E. Cohen De Lara, Adsorption of oxygen molecule in NaA zeolite: isotherms and infrared measurements, J. Chem. Phys., 1989, 91, 2649–2655 CrossRef CAS.
- F.-X. Coudert, F. Cailliez, R. Vuilleumier, A. H. Fuchs and A. Boutin, Water nanodroplets confined in zeolite pores, Faraday Discuss., 2009, 141, 377–398 RSC.
- J. Izumi and M. Suzuki, Oxygen selectivity of calcined Na-A type zeolite, Adsorption, 2000, 6, 23–31 CrossRef CAS.
- V. Crupi, D. Majolino, P. Migliardo, V. Venuti and U. Wanderlingh, A FT-IR absorption analysis of vibrational properties of water encaged in NaA zeolites: evidence of a “structure maker” role of zeolitic surface, Eur. Phys. J. E: Soft Matter Biol. Phys., 2003, 12, 55–58 CrossRef.
- B. Morris, Heats of sorption in the crystalline linde-A zeolite-water vapor system, J. Colloid Interface Sci., 1968, 28, 149–155 CrossRef CAS.
- A. Baudiquez, Mechanism of recombination of H2 and O2 in zeolite : adsorption study on water, M.Sc. thesis, Université de Franche-Comté, 2019.
- M. Falcetta, J. Pazun, M. Dorko, D. Kitchen and P. Siska, Ab initio study of the potential energy surface for the interaction of sodium (1+) with molecular hydrogen and the geometries and energies of Na + (H2) n, n = 2–4, J. Phys. Chem., 1993, 97, 1011–1018 CrossRef CAS.
- D. A. Dixon, J. L. Gole and A. Komornicki, Lithium and sodium cation affinities of hydrogen, nitrogen, and carbon monoxide, J. Phys. Chem., 1988, 92, 1378–1382 CrossRef CAS.
- C. W. Bauschlicher Jr., H. Partridge and S. R. Langhoff, Theoretical study of chromium (1+) and cobalt (1+) bound to hydrogen and nitrogen, J. Phys. Chem., 1992, 96, 2475–2479 CrossRef.
- C. O. Areán, G. T. Palomino, E. Garrone, D. Nachtigallova and P. Nachtigall, Combined theoretical and FTIR spectroscopic studies on hydrogen adsorption on the zeolites Na- FER and K- FER, J. Phys. Chem. B, 2006, 110, 395–402 CrossRef.
- J. Salazar, M. Badawi, B. Radola, M. Macaud and J. Simon, Quantum effects on the diffusivity of hydrogen isotopes in zeolites, J. Phys. Chem. C, 2019, 123, 23455–23463 CrossRef CAS.
- R. Kahn, E. Cohen de Lara and E. Viennet, Diffusivity of the hydrogen molecule sorbed in NaA zeolite by a neutron scattering experiment, J. Chem. Phys., 1989, 91, 5097–5102 CrossRef CAS.
Footnote |
| † https://www.ks.uiuc.edu/Research/vmd/. |
| This journal is © the Partner Organisations 2023 |

