 Open Access Article
Creative Commons Attribution 3.0 Unported Licence
Insight into the melt-processed polylimonene oxide/polylactic acid blends†
Miguel
Palenzuela
a,
Juan F.
Vega
 bc,
Virginia
Souza-Egipsy
 b,
Javier
Ramos
bc,
Christian
Rentero
a,
Valentina
Sessini
 *a and
Marta E. G.
Mosquera
 *a
*a
aDepartamento de Química Orgánica y Química Inorgánica, Instituto de Investigación Química “Andrés M. del Río”, Campus Universitario, E-28871 Alcalá de Henares, Spain. E-mail: martaeg.mosquera@uah.es; valentina.sessini@uah.es
bBIOPHYM, Departamento de Física Macromolecular, Instituto de Estructura de la Materia, IEM-CSIC, c/Serrano 113 bis, 28006 Madrid, Spain
cInterdisciplinary Platform for Sustainable Plastics towards a Circular Economy, SUSPLAST-CSIC, 28006 Madrid, Spain
First published on 28th July 2023
Abstract
In this work, the polymerization of limonene oxide (LO) has been optimized at room temperature with two different aluminium-based catalysts [AlMeX{2,6-(CHPh2)2-4-tBu-C6H2O}] (X = Me (1), Cl (2)). A fully bio-based ether, polylimonene oxide (PLO), has been synthesized with low molecular weight and good thermal stability, being a potential sustainable polymeric additive for other bio-based and biodegradable polymers such as polylactic acid (PLA). Hence, we have explored its ability to influence the thermal, mechanical and morphological properties of PLA by preparing their blends by melt processing. The addition of a low amount of PLO led to a nearly 10 °C decrease in the PLA glass transition temperature. Moreover, a decrease in the PLA melting temperature and the degree of crystallinity was observed. Interestingly, a remarkable increase in the flexibility of PLA-based films was noticed. All the results point to the existence of strong interactions between the components, suggesting their partial miscibility.
Introduction
The use of renewable monomers from biomass to produce alternative polymers to traditional oil-derived ones is in increasing demand.1–8 Among them, monomers coming from non-edible crops and plants arouse particular interest. In this context, terpenes and their derivatives are very interesting substrates as they are produced mainly by plants and can be found in leaves, flowers, fruits, trees, and spices.9 Furthermore, terpenes can be produced in biorefineries from biomass coming from different types of waste such as agricultural residues.Terpenes and terpenoids represent one of the largest families of natural products with a wide structural diversity that can be employed for many applications.10 From a structural point of view, terpenes contain at least one double bond in their structure and can be considered derivatives of isoprene. These functionalized molecules can be easily derivatized to introduce new functional groups for use in polymerization and other reactions.11–13 A particularly straightforward modification is the oxidation of the double bond to obtain epoxides, which can be used as monomers in ring-opening polymerization (ROP) reactions to produce polymers. Within terpene derivatives, limonene oxide (LO) can be easily produced from limonene, a terpene produced from the peel of some citrus fruits, using conventional epoxidation methods. Although LO has high potential as a monomer due to its multifunctionality, the thermodynamic barrier for ring opening is high because it is an internal trisubstituted epoxide. As a result, there are limited numbers of studies on the polymerization of LO in the literature, with most focusing on copolymerization reactions.14–38
LO homopolymerization was first reported in 2012 by Park et al.39 as a photoinitiated cationic ring-opening polymerization. However, this method yields numerous side reactions that limit the obtention of high molecular weight polymers. Since then, only our group has reported the synthesis of polylimonene oxide (PLO) using a metal catalyst. We have also shown the suitability of the low molecular weight PLO prepared as a green biobased additive for polylactic acid (PLA).40 PLA is an interesting biodegradable polyester that could act as a biobased alternative to oil-based polymers. Nevertheless, its brittleness and rigidity have limited its application in many fields.41 In our previous studies, we observed that the addition of only 10 wt% of PLO led to an improvement in PLA properties in terms of its flexibility, thermal stability, and hydrophobicity.40
The increasing demand for non-toxic biobased plasticizers fabricated via environmentally friendly strategies42,43 has inspired and motivated the current work where we have gone further in our studies and has allowed us to optimize the PLO synthesis as well as the processing method for fabricating PLA/PLO blends using a more sustainable approach. The materials prepared are potential biobased alternatives for food packaging applications and agricultural mulch films. The thermal properties of the neat materials and their blends with different amounts of PLO have been characterized along with their thermal stability, mechanical properties and morphology. Moreover, an in-depth study of the influence of PLO as a plasticizer on the PLA behavior has been performed showing their partial miscibility at the right proportions.
Experimental
Materials
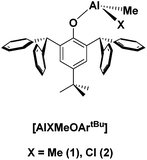
(+)-Limonene oxide (43.5% cis-isomer and 56.5% trans-isomer)40 was purchased from Sigma-Aldrich. Poly(lactic acid) (PLA) 2003D, with a density of 1.24 g cm−3, a molecular weight (Mn) of ca. 1.2 × 10⁴ g mol−1, and a melt flow index (MFI) of 6 g 10 min−1 (210 °C, 2.16 kg) was supplied by Nature Works®, USA. The aluminium compounds [AlMeX{2,6-(CHPh2)2-4-tBu-C6H2O}] (X = Me (1), Cl (2)) were prepared as previously reported by us.44Synthetic procedures
The monomer was purified by vacuum distillation using CaH2 as a drying agent. Once purified, it was stored at −20 °C under argon and in the absence of light. The PLO was synthesized by optimizing the procedure previously reported.40 In particular, the catalyst (0.011 g, 0.02 mmol) was dissolved in (+)-limonene oxide (0.818 ml, 5.0 mmol) in a glovebox. The polymerization was performed in bulk in an inert ambient environment under magnetic stirring at 25 °C. At the end of the polymerization, one aliquot was taken and quenched with wet CDCl3 to determine the conversion of (+)-limonene oxide to polymer by 1H-NMR spectroscopy. The conversion of PLO was determined by the integration of the signals observed in the methine region of the monomers at 3 ppm versus the signals of LO isomers above 4 ppm, and the polymer chain centred at 3.5 ppm.The polymeric samples were purified by washing the remaining monomers and catalyst with methanol and drying at 25 °C. Finally, the samples were dried in a vacuum oven at 60 °C overnight. The final product was characterized by NMR spectroscopy.
PLA/PLO blend preparation
PLA and PLO were melt-blended using a microextruder equipped with twin conical corotating screws (MiniLab Haake Rheomex CTW5, Thermo Fisher Scientific) with a capacity of 7 cm3. Prior to the melt processing of the samples, the materials were dried in a vacuum oven at 40 °C for 24 h. After weighing the materials, PLA and PLO were manually pre-mixed and then added to the extruder. The extruder worked at a screw rotation rate of 50 rpm, a temperature of 180 °C, and a residence time of 3 min. The processed blends were named PLA5PLO, PLA10PLO, PLA15PLO and PLA20PLO, highlighting the PLO amount in the blends. The extruded blends were successively thermo-compressed in a Dr Collin 200 mm × 200 mm press at 180 °C and 100 bar for 5 min to obtain films (∼0.5 mm thickness) for characterization. A neat PLA sample was also prepared following the same methodology for comparison and it was named PLA.Characterization methods
NMR spectra were recorded at 400.13 (1H) and 100.62 (13C) MHz on a Bruker AV400 at room temperature. Chemical shifts (δ) are given in ppm using C6D6 and CDCl3 as the solvent. The 1H and 13C resonances were measured with respect to solvent peaks considering TMS δ = 0 ppm.The GC-MS analysis of the LO rearrangement products was performed using an ITQ 900 ion trap Thermo Scientific mass spectrometer coupled with a Trace GC ultra gas chromatograph with an automatic injector. Electron impact ionization was used as the ionization method within an m/z range of 30–550 Da.
Size-exclusion chromatography analyses were carried out on an Agilent 1260 Infinity II high-speed liquid chromatograph in order to determine the molecular weights (Mn and Mw) and polydispersity (PDI) of PLO. Sample solutions (1 mg ml−1) in tetrahydrofuran (THF) were injected at a 1 ml min−1 flow rate at 35 °C, in two MIXED D columns connected in series. Calibrations were performed using polystyrene standards.
The thermal stability of the PLO was studied by thermogravimetric analysis (TGA) using a TGA55 analyzer (TA Instruments). Isothermal experiments were performed under an oxygen atmosphere to verify its melt processability at 180 °C. Thermal characterization was performed by dynamic differential scanning calorimetry (DSC). For DSC measurements, a DSC 3 Mettler Toledo, Module 444 (software STARE System SW 14.00 and Intracooler Huber TC45) was used with a heating/cooling/heating cycle program in the range of 0–200 °C at a heating/cooling rate of 10 °C min−1 under a nitrogen purge (30 mL min−1). The glass transition temperature (Tg) was calculated from the second heating scan and was taken at the mid-point of heat capacity changes. The melting temperature (Tm), final melting temperature (Tend) and cold crystallization temperature (Tcc) were obtained from the second heating, and the degree of crystallinity (χc) was determined using eqn (1):
 | (1) |
 is the enthalpy of fusion of a 100% crystalline PLA, taken as 93 J g−1,45 and 1 − mf is the weight fraction of PLA in the sample. The thermal properties have also been determined in the first heating run in order to discuss the mechanical properties of the film.
Dynamic mechanical analysis (DMA) was performed in a PerkinElmer DMA7 in the flexural mode at room temperature under the controlled stress mode. Measurements were made in the Linear Viscoelastic Region by dynamic force sweeps between 100 and 3000 mN at a fixed frequency of 1 Hz. The generated dynamic strain ε* as a consequence of the imposed dynamic stress σ* varied up to a maximum value of 0.10%, well within the LVR. The values of the complex flexural modulus E* at 1 Hz were obtained from the slope of the plot of the applied tensile dynamic stress versus the produced tensile dynamic strain.
Atomic force microscopy (AFM) imaging of the films was carried out using a μTA™ 2990 Micro-Thermal Analyzer (TA Instruments, Inc., New Castle, DE, USA). Topography micrographs were recorded in contact mode at room temperature. A V-shaped silicon nitride probe with a cantilever length of 200 μm and a spring constant of 0.032 N m−1 was used. The blends were sandwiched between PTFE sheets, heated at 180 °C under minimal pressure for 5 minutes, and isothermally crystallized at 120 °C. The polymeric films were supported on glass wafers for morphological observations.
Results and discussion
Limonene oxide polymerization studies
In our previous work, we have assessed the activity of the compound [AlClMe{2,6-(CHPh2)2-4-tBu-C6H2O}] (2) as a catalyst for the ROP of cis/trans-(+)-limonene oxide in bulk at 130 °C.40 Under these conditions, PLO chains of low molecular weights were produced within minutes. Interestingly, there have been very few catalysts reported in the literature which can reach the high kinetic activation barrier that leads to the ROP of this internal trisubstituted epoxide.46,47In this study, we extended our studies to the derivative bearing two methyl groups bonded to the aluminium [AlMe2{2,6-(CHPh2)2-4-tBu-C6H2O}] (1) (Fig. 1). As for compound 2, these aluminium derivatives are mononuclear in solution as shown by DOSY experiments.44 We performed the polymerization in bulk with a catalyst to monomer ratio of 1![[thin space (1/6-em)]](https://www.rsc.org/images/entities/char_2009.gif) :
:![[thin space (1/6-em)]](https://www.rsc.org/images/entities/char_2009.gif) 100 and 1
100 and 1![[thin space (1/6-em)]](https://www.rsc.org/images/entities/char_2009.gif) :
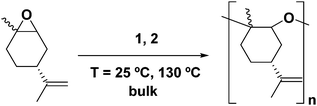
:![[thin space (1/6-em)]](https://www.rsc.org/images/entities/char_2009.gif) 250 at 130 °C (Scheme 1). As observed for derivative 2, the polymerization took place in only 30 minutes. We also explored the influence of temperature, and we carried out the reaction at room temperature (25 °C); under these conditions, both catalysts were active.
250 at 130 °C (Scheme 1). As observed for derivative 2, the polymerization took place in only 30 minutes. We also explored the influence of temperature, and we carried out the reaction at room temperature (25 °C); under these conditions, both catalysts were active.
The results of the polymerization are reported in Table 1. The activity of both catalysts was similar even though compound 2 was more active in the ROP of other monomers such as glycidyl methacrylate, due to its higher Lewis acid character.44 In this case, the main difference is observed in the molecular weights of the polymers obtained which are slightly higher for the ones prepared using compound 1, in agreement with a more controlled polymerization. This behaviour has been previously observed for the polymerization of glycidyl methacrylate using these catalysts.44
| Ent. | [Al] | [Al]![[thin space (1/6-em)]](https://www.rsc.org/images/entities/char_2009.gif) : :![[thin space (1/6-em)]](https://www.rsc.org/images/entities/char_2009.gif) [LO] [LO] |
T (°C) | %Conv. in PLOa |
M
n,theo![[thin space (1/6-em)]](https://www.rsc.org/images/entities/char_2009.gif) b (KDa) b (KDa) |
M
n,GPC![[thin space (1/6-em)]](https://www.rsc.org/images/entities/char_2009.gif) c (KDa) c (KDa) |
PDIc |
|---|---|---|---|---|---|---|---|
| a Determined by 1H-NMR spectroscopy. b M n,theo = [LO]/[Al]·%conv. in PLO·152 + 152. c Determined by GPC-SEC in THF with polystyrene standards. | |||||||
| 1 | 1 | 1![[thin space (1/6-em)]](https://www.rsc.org/images/entities/char_2009.gif) : :![[thin space (1/6-em)]](https://www.rsc.org/images/entities/char_2009.gif) 100 100 |
130 | 42 | 6.5 | 1.6 | 1.47 |
| 2 | 1 | 1![[thin space (1/6-em)]](https://www.rsc.org/images/entities/char_2009.gif) : :![[thin space (1/6-em)]](https://www.rsc.org/images/entities/char_2009.gif) 100 100 |
25 | 63 | 9.7 | 2 | 1.43 |
| 3 | 1 | 1![[thin space (1/6-em)]](https://www.rsc.org/images/entities/char_2009.gif) : :![[thin space (1/6-em)]](https://www.rsc.org/images/entities/char_2009.gif) 250 250 |
130 | 54 | 20.7 | 2.0 | 1.27 |
| 4 | 1 | 1![[thin space (1/6-em)]](https://www.rsc.org/images/entities/char_2009.gif) : :![[thin space (1/6-em)]](https://www.rsc.org/images/entities/char_2009.gif) 250 250 |
25 | 70 | 26.8 | 2.3 | 1.42 |
| 5 | 2 | 1![[thin space (1/6-em)]](https://www.rsc.org/images/entities/char_2009.gif) : :![[thin space (1/6-em)]](https://www.rsc.org/images/entities/char_2009.gif) 100 100 |
130 | 40 | 6.2 | 1.8 | 1.47 |
| 6 | 2 | 1![[thin space (1/6-em)]](https://www.rsc.org/images/entities/char_2009.gif) : :![[thin space (1/6-em)]](https://www.rsc.org/images/entities/char_2009.gif) 100 100 |
25 | 70 | 10.8 | 1.7 | 1.31 |
| 7 | 2 | 1![[thin space (1/6-em)]](https://www.rsc.org/images/entities/char_2009.gif) : :![[thin space (1/6-em)]](https://www.rsc.org/images/entities/char_2009.gif) 250 250 |
130 | 48 | 18.4 | 1.5 | 1.27 |
| 8 | 2 | 1![[thin space (1/6-em)]](https://www.rsc.org/images/entities/char_2009.gif) : :![[thin space (1/6-em)]](https://www.rsc.org/images/entities/char_2009.gif) 250 250 |
25 | 60 | 22.9 | 2.3 | 1.37 |
A significant improvement in the reaction was observed when it was carried out at RT. As such, higher conversion of PLO was achieved for both compounds [AlMeX{2,6-(CHPh2)2-4-tBu-C6H2O}] (X = Me (1), Cl (2)) compared to when the reaction was performed at 130 °C (Table 1). The behaviour observed at high temperatures could be attributed to the occurrence of secondary reactions, such as LO isomerization processes that lead to the formation of side products, which would be more favoured at 130 °C.
As shown in Table 1, the obtained polymers showed low molecular weights (∼2 kDa), and moderate PDI (∼1.3). Besides, the increase in the monomer to catalyst ratio led to PLO with a similar molecular weight. The low molecular weights obtained could be attributed to the occurrence of chain transfer reactions promoted by the alcohol species derived from the rearrangement reactions of the limonene oxide.40 In fact, we detected these side products by GC-MS analysis of the LO-polymerization reaction filtrate (see the ESI, Fig. S1–S4†). The role of these LO alcoholic derivatives as initiators of the polymerization has been confirmed by MS analysis of the polymers.40
We tried to accomplish better control over the process by adding a well-known initiator such as benzyl alcohol (BnOH). We performed the reaction of 1 with BnOH and LO at a ratio of 1![[thin space (1/6-em)]](https://www.rsc.org/images/entities/char_2009.gif) :
:![[thin space (1/6-em)]](https://www.rsc.org/images/entities/char_2009.gif) 1
1![[thin space (1/6-em)]](https://www.rsc.org/images/entities/char_2009.gif) :
:![[thin space (1/6-em)]](https://www.rsc.org/images/entities/char_2009.gif) 250; however, the same results as without BnOH were obtained.
250; however, the same results as without BnOH were obtained.
We performed the reaction with a commercial mixture of cis/trans-(+)-limonene oxide, and in our initial studies, the presence of unreacted trans-LO 1H-NMR spectra made us think that only the cis-isomer polymerized.40 To quantify the real conversion of both monomers, in this work we performed the ROP in the presence of an external standard compound such as tetraphenylnaphthalene (TPhN). The reaction was carried out at a [Al]![[thin space (1/6-em)]](https://www.rsc.org/images/entities/char_2009.gif) :
:![[thin space (1/6-em)]](https://www.rsc.org/images/entities/char_2009.gif) TPhN
TPhN![[thin space (1/6-em)]](https://www.rsc.org/images/entities/char_2009.gif) :
:![[thin space (1/6-em)]](https://www.rsc.org/images/entities/char_2009.gif) LO ratio of 1
LO ratio of 1![[thin space (1/6-em)]](https://www.rsc.org/images/entities/char_2009.gif) :
:![[thin space (1/6-em)]](https://www.rsc.org/images/entities/char_2009.gif) 2
2![[thin space (1/6-em)]](https://www.rsc.org/images/entities/char_2009.gif) :
:![[thin space (1/6-em)]](https://www.rsc.org/images/entities/char_2009.gif) 250. After 30 minutes, 70% conversion of the trans isomer was observed by 1H NMR spectroscopy, while total conversion of the cis one was achieved, indicating that both isomers polymerize, but the cis-LO conversion is faster than that of trans-LO (see the ESI, Fig. S6†).
250. After 30 minutes, 70% conversion of the trans isomer was observed by 1H NMR spectroscopy, while total conversion of the cis one was achieved, indicating that both isomers polymerize, but the cis-LO conversion is faster than that of trans-LO (see the ESI, Fig. S6†).
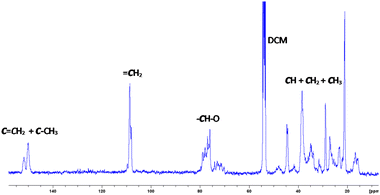
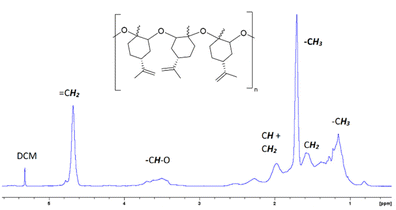
Fig. 2 and 3 show the 1H-NMR and 13C-NMR spectra, respectively, of the isolated PLO. The broad signals observed in the 1H and 13C-NMR spectra suggest a random disposition of both monomers in the polymer chain. As such, for the related poly(limonene)carbonate, one signal has been observed for the cis isomer polymer and two for the trans one.18 In the 13C-NMR spectra of our PLO, at 70–80 ppm the signal corresponding to the CH–O carbon appears which is composed of several peaks in agreement with the polymerization of both isomers. The smaller peaks at a higher field correspond to the polymer terminations (see the ESI, Fig. S7†). If both isomers are randomly distributed into the polymeric chain and the epoxide ring opens every time on the same side, two peaks corresponding to the two different diads, racemo and meso, will be expected. In our case, the presence of several peaks for each set of signals in the methine region may correspond to different triads and tetrads, indicating that the opening of the epoxide ring has taken place through both sides, giving different conformations. Similar results have been observed by Kleij et al.18 for the copolymerization of CO2 with LO. Therefore, we can propose that an atactic polymer is formed by the polymerization of both isomers of (+)-limonene oxide through the openings on both sides of the epoxide ring (Fig. 2).
PLA/PLO blend studies
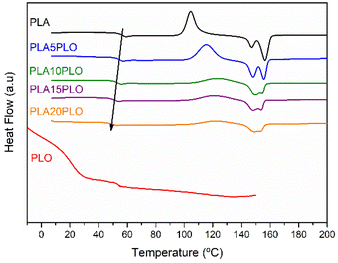
In order to study the effect of PLO on the PLA properties, different amounts (5, 10, 15, and 20 wt%) of PLO have been added to PLA by melt processing. Firstly, TGA isothermal experiments under an air atmosphere were performed on PLO to verify its melt processability at the processing temperature of PLA, 180 °C (see the ESI, Fig. S13†). The weight loss was monitored for 15 minutes at the selected temperature. It is easy to notice that after 3 minutes (the residence time used for processing different PLA/PLO blends), PLO's weight loss is only 2%, and after 15 minutes, it is 4%, indicating that PLO can be melt-blended with PLA without undergoing thermal degradation.The thermal properties of the neat polymers, PLA and PLO, as well as those of their blends, have been studied by DSC analysis. As previously reported in our work, the thermal properties of PLA can be tuned by adding a low amount of PLO as a biobased additive. These variations follow the same trend as in this work even if the blends were obtained by melt processing; thus a deep study of the interactions between PLA and PLO is proposed here. The DSC traces (2nd heating runs) obtained for PLA, PLO and their blends are shown in Fig. 4 and the thermal properties are reported in Table 2. The DSC thermograms reveal a Tg value for pure PLA of 57.4 °C. The Tg value for the PLO component is reported to be around 21 °C. In the blends, a shift in the Tg of the PLA component to lower temperatures is reported (see Table 2), indicating a decrease in the rigidity of the polymer matrix due to the incorporation of the low molecular weight PLO plasticizer.
| Samples | T g (°C) |
T
m![[thin space (1/6-em)]](https://www.rsc.org/images/entities/char_2009.gif) a (°C) a (°C) |
T end (°C) |
T
m![[thin space (1/6-em)]](https://www.rsc.org/images/entities/char_2009.gif) b (°C) b (°C) |
X
c![[thin space (1/6-em)]](https://www.rsc.org/images/entities/char_2009.gif) b (%) b (%) |
E (GPa) |
|---|---|---|---|---|---|---|
| a 2nd peak. b 1st run of DSC. | ||||||
| PLA | 57.0 | 156.0 | 161.0 | 159.1 | 13.0 | 0.79 |
| PLA5PLO | 55.0 | 155.8 | 160.8 | 159.0 | 7.0 | 0.68 |
| PLA10PLO | 53.0 | 155.3 | 160.3 | 158.4 | 5.4 | 0.60 |
| PLA15PLO | 51.0 | 154.6 | 159.6 | 157.7 | 2.0 | 0.55 |
| PLA20PLO | 50.0 | 154.7 | 158.7 | 156.8 | 1.0 | 0.41 |
| PLO | 21 | — | — | — | — | — |
The extent of the Tg depression clearly depends on the concentration, as the decrease is stronger for the highest PLO contents. The degree and the type of the interactions between the two components are also factors to consider. The decrease observed in Tg in the blends is typical of miscible and partially miscible blends, in which the plasticizer increases the mobility of polymer chains and reduces the strength of the PLA intermolecular interactions. Prior to the 2nd heating cycle, the samples have been cooled quickly enough, thus a cold crystallization event is observed during heating. This event is observed in all cases, and the temperature peak Tcc increases as the amount of PLO does. Finally, at higher temperatures, melting occurs. In all the samples, two well-separated peaks are observed, the low-temperature peak that corresponds to the melting of the crystalline material present in the samples, and the high-temperature peak associated with the melting of the recrystallized material during heating. A clear shift to lower end melting temperatures, Tend, is observed for all the mixtures. It is interesting to note that the thickening process is still happening but it is less visible in the blends as the PLO content increases.
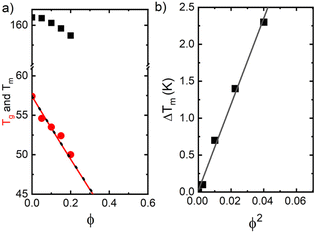
For the evaluation of the glass transition and melting depression, the values of Tg and Tend have been located and plotted as a function of composition (fraction of second PLO component) in Fig. 5a, for the whole set of mixtures studied.
We find that both Tg and Tend decrease with increasing PLO concentration. The level of the experimental depression is pronounced, much more so than the corresponding values of experimental variability in DSC experiments (typically ±0.1 °C). The level of Tg depression is around 7 °C in the compositional range studied, and it is nicely explained by the Gordon–Taylor48 and Fox49 approaches given by eqn (2) and (3), respectively:
 | (2) |
 | (3) |
According to Nishi and Wang,51 the thermodynamics of mixing amorphous/crystalline polymers can result in a melting-point depression that can be expressed in relation to the Flory–Huggins interaction parameter, χ12, such that
 | (4) |
 is the equilibrium melting temperature of PLA,
  is the enthalpy of fusion per mole of the repeating unit of PLA, and ϕ is the volume fraction of PLO. The Nishi–Wang equation clearly states a linear dependency of ΔTm with ϕ2. Of course, the melting temperature changes can be explained not only by the exothermic interaction between the PLA crystal and the amorphous PLO component, but also by morphological and kinetic effects as a consequence of the thermal history or because the crystals actually grow far from the equilibrium. The thermal histories in the blends studied in this case are assumed to be the same, as in the DSC experiments the memory has been erased during the first heating, and the crystallization step is exactly the same in all cases. Nonetheless, it is clear from the results in Fig. 5b that the linear correlation predicted by Nishi–Wang holds for the system under study. Conventionally, the application of the Nishi–Wang approach requires determination of the equilibrium melting temperatures provided by Hoffman–Weeks plots.52 However, PLA and PLO are prone to thermal degradation at crystallization temperatures close to Tm, making the use of this procedure problematic for long crystallization times. Therefore, an estimate of the value of χ12 was performed as suggested by Pizzoli et al.53 using the nonequilibrium melting peak and end temperatures determined by DSC instead (see Table 2). Considering eqn (4) and the linear fit in Fig. 5b, the value for χ12 can be obtained from the slope. Considering the values V1 = 141.3 mL mol−1, V2 = 59.3 mL mol−1 (PLA), ΔH = 6,752 J mol−1, the interaction parameter is found to be small and negative (χ12 = −0.6), indicating that PLA and PLO are thermodynamically miscible in the melt, or at least that they interact likely due to hydrogen bonding.
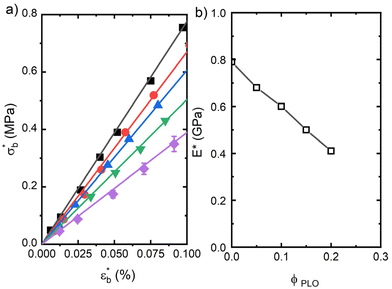
We have additionally evaluated the mechanical properties of the films prepared from compression moulding. Obviously, the mechanical properties of such samples will depend on their initial microstructure and morphology. The details of this microstructure may be understood from the DSC features obtained in the first melting cycle, as listed in Table 2. A decrease in the crystal content as the PLO content increases is envisaged from the data, pointing again towards a plasticization effect of PLO. This fact directly affects the mechanical properties as observed in Fig. 6. The dependence of the dynamic bending stress,  , on the dynamic strain,
  , (dynamic stress–strain curves) at a frequency of 1 Hz in the samples is observed in Fig. 6a. The results represent the average obtained from three independent measurements in each sample.
The dynamic flexural stress–strain curves show a large difference between the pure PLA sample and the blends. The values of the slope for small values of the dynamic strain (LVR) directly yield the dynamic flexural modulus, E*.
PLA shows a value of the flexural modulus of 0.80 GPa. PLA/PLO samples show the typical behaviour associated with plasticization, as the tensile modulus decreases with the presence of PLO to a value of around 0.40 GPa for the blend with the highest PLO content (Fig. 6b). The low-Mw plasticizer actually behaves like solvent molecules, leading to a decrease in the density of interactions among PLA macromolecules. These results again point towards a certain level of miscibility between PLA and PLO.
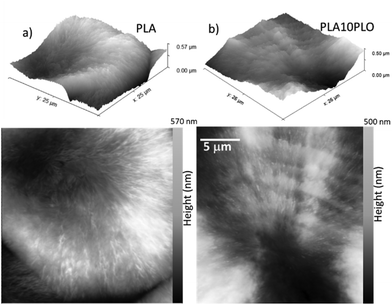
The morphology of neat PLA was compared to that of PLA blended with 10% PLO. The morphological aspects are observed in Fig. 7 for films prepared by complete crystallization at T = 120 °C from the melt.
The AFM images in Fig. 7 indicate the absence of a ring-band pattern in the neat PLA (left panel). However, the presence of PLO alters the spherulitic morphology, as observed in the right panel B. The AFM images show that the distance between ridges is approximately 2 μm, and the height difference between the ridges and valleys is around 20–50 nm. Furthermore, irregular intermediate ridges are present between the long ridges and the valleys. This hierarchical organization of the crystalline structure within the ridges and valleys suggests some type of segmental interaction and partial miscibility between the PLA and PLO. The growth of spherulites with ringed bands is a commonly reported phenomenon in blends with interactions between the components. In particular, this phenomenon has been observed in polyesters mixed with polar diluents, as documented in a study by Keith et al.54 Based on these findings, the morphological characteristics observed in the PLA/PLO blends under study may be attributed to segmental interactions and partial miscibility between the two components.
Conclusions
The aluminium catalysts [AlMeX{2,6-(CHPh2)2-4-tBu-C6H2O}] (X = Me (1), Cl (2)) are active catalysts for the ROP polymerization of LO even at room temperature, leading to greener synthetic parameters. This allowed us to obtain polylimonene oxide totally derived from renewable sources under sustainable conditions. The polyether obtained had a low molecular weight and good thermal properties, being a promising green additive to be melt-blended with other bioplastics such as PLA.The PLA/PLO blends show a decrease in the glass transition and melting points of the main PLA component. In fact, the application of the Fox and Nishi–Wang approaches points to the existence of interactions between the components, suggesting partial miscibility. The mechanical properties of the blends also showed plasticization, with a decreased elastic modulus resulting in less fragile systems compared to neat PLA.
These sustainable materials are entirely derived from renewable sources and their obtention is fully scalable by the industrial methods used for traditional polymers, being interesting for many applications such as biodegradable food packaging or agricultural mulch films.
Author contributions
The manuscript was written through the contributions of all authors. All authors have given approval to the final version of the manuscript.Conflicts of interest
There are no conflicts to declare.Acknowledgements
The authors would like to thank the Comunidad de Madrid (EPU-INV/2020/001) and the Ministerio de Ciencia e Innovación (Spain) through the projects TED2021-130871B-C22, PID2021-122708OB-C31, PID2019-107710 GB-I00, and RYC2021-033921-I for their financial support. BIOPHYM Service at the IEM-CSIC and POLYMAT (Rheology Lab) are acknowledged for granting the use of their facilities. This project has received funding from the European Union's Horizon 2020 research and innovation programme under the Marie Skłodowska-Curie grant agreement No. 754382, GOT ENERGY TALENT. The content of this article does not reflect the official opinion of the European Union. Responsibility for the information and views expressed herein lies entirely with the authors.References
- K. Yao and C. Tang, Macromolecules, 2013, 46, 1689–1712, DOI:10.1021/ma3019574.
- M. N. Belgacem and A. Gandini, Monomers, polymers and composites from renewable resources, Elsevier, 2011 Search PubMed.
- A. Llevot, P.-K. Dannecker, M. von Czapiewski, L. C. Over, Z. Söyler and M. A. R. Meier, Chem. – Eur. J., 2016, 22, 11510–11521, DOI:10.1002/chem.201602068.
- D. J. Jansen and R. A. Shenvi, Future Med. Chem., 2014, 6, 1127–1148, DOI:10.4155/fmc.14.71.
- Y. Zhu, C. Romain and C. K. Williams, Nature, 2016, 540, 354–362, DOI:10.1038/nature21001.
- R. Ciriminna, M. Lomeli-Rodriguez, P. Demma Carà, J. A. Lopez-Sanchez and M. Pagliaro, Chem. Commun., 2014, 50, 15288–15296, 10.1039/C4CC06147K.
- X. Zhang, M. Fevre, G. O. Jones and R. M. Waymouth, Chem. Rev., 2018, 118, 839–885, DOI:10.1021/acs.chemrev.7b00329.
- R. Mülhaupt, Macromol. Chem. Phys., 2013, 214, 159–174, DOI:10.1002/macp.201200439.
- R. T. Mathers and S. P. Lewis, in Green Polymerization Methods: Renewable StartingMaterials, Catalysis and Waste Reduction, ed. R. T. Mathers and M. A. R. Meier, 2011, ch. 89–128. DOI:10.1002/9783527636167.ch5.
- M. Palenzuela, D. Sánchez-Roa, J. Damián, V. Sessini and M. E. Mosquera, in Adv. Organomet. Chem, Elsevier, 2021, vol. 75, pp. 55–93 Search PubMed.
- A. Behr and L. Johnen, ChemSusChem, 2009, 2, 1072–1095, DOI:10.1002/cssc.200900186.
- J. Kühlborn, J. Groß and T. Opatz, Nat. Prod. Rep., 2020, 37, 380–424, 10.1039/c9np00040b.
- M. Eggersdorfer, Terpenes, Wiley, 2000 Search PubMed.
- C. M. Byrne, S. D. Allen, E. B. Lobkovsky and G. W. Coates, J. Am. Chem. Soc., 2004, 126, 11404–11405, DOI:10.1021/ja0472580.
- R. C. Jeske, A. M. DiCiccio and G. W. Coates, J. Am. Chem. Soc., 2007, 129, 11330–11331, DOI:10.1021/ja0737568.
- C. Robert, F. de Montigny and C. M. Thomas, Nat. Commun., 2011, 2, 586, DOI:10.1038/ncomms1596.
- E. H. Nejad, A. Paoniasari, C. G. W. van Melis, C. E. Koning and R. Duchateau, Macromolecules, 2013, 46, 631–637, DOI:10.1021/ma301904y.
- L. Peña Carrodeguas, J. González-Fabra, F. Castro-Gómez, C. Bo and A. W. Kleij, Chem. – Eur. J., 2015, 21, 6115–6122, DOI:10.1002/chem.201406334.
- O. Hauenstein, M. Reiter, S. Agarwal, B. Rieger and A. Greiner, Green Chem., 2016, 18, 760–770, 10.1039/C5GC01694K.
- C. Martín and A. W. Kleij, Macromolecules, 2016, 49, 6285–6295, DOI:10.1021/acs.macromol.6b01449.
- F. Isnard, M. Lamberti, C. Pellecchia and M. Mazzeo, ChemCatChem, 2017, 9, 2972–2979, DOI:10.1002/cctc.201700234.
- N. Kindermann, À. Cristòfol and A. W. Kleij, ACS Catal., 2017, 7, 3860–3863, DOI:10.1021/acscatal.7b00770.
- S. Paul, Y. Zhu, C. Romain, R. Brooks, P. K. Saini and C. K. Williams, Chem. Commun., 2015, 51, 6459–6479, 10.1039/C4CC10113H.
- J. M. Longo, M. J. Sanford and G. W. Coates, Chem. Rev., 2016, 116, 15167–15197, DOI:10.1021/acs.chemrev.6b00553.
- L. Peña Carrodeguas, C. Martín and A. W. Kleij, Macromolecules, 2017, 50, 5337–5345, DOI:10.1021/acs.macromol.7b00862.
- S. J. Poland and D. J. Darensbourg, Green Chem., 2017, 19, 4990–5011, 10.1039/C7GC02560B.
- M. Reiter, S. Vagin, A. Kronast, C. Jandl and B. Rieger, Chem. Sci., 2017, 8, 1876–1882, 10.1039/C6SC04477H.
- T. Stößer, C. Li, J. Unruangsri, P. K. Saini, R. J. Sablong, M. A. R. Meier, C. K. Williams and C. Koning, Polym. Chem., 2017, 8, 6099–6105, 10.1039/C7PY01223C.
- D. Zhang, E. A. del Rio-Chanona and N. Shah, ACS Sustainable Chem. Eng., 2017, 5, 4388–4398, DOI:10.1021/acssuschemeng.7b00429.
- C. Martín, A. Pizzolante, E. C. Escudero-Adán and A. W. Kleij, Eur. J. Inorg. Chem., 2018, 2018, 1921–1927, DOI:10.1002/ejic.201800142.
- M. Martínez de Sarasa Buchaca, F. de la Cruz-Martínez, J. Martínez, C. Alonso-Moreno, J. Fernández-Baeza, J. Tejeda, E. Niza, J. A. Castro-Osma, A. Otero and A. Lara-Sánchez, ACS Omega, 2018, 3, 17581–17589, DOI:10.1021/acsomega.8b02759.
- F. Parrino, A. Fidalgo, L. Palmisano, L. M. Ilharco, M. Pagliaro and R. Ciriminna, ACS Omega, 2018, 3, 4884–4890, DOI:10.1021/acsomega.8b00644.
- T. S. Anderson and C. M. Kozak, Eur. Polym. J., 2019, 120, 109237, DOI:10.1016/j.eurpolymj.2019.109237.
- J. Bailer, S. Feth, F. Bretschneider, S. Rosenfeldt, M. Drechsler, V. Abetz, H. Schmalz and A. Greiner, Green Chem., 2019, 21, 2266–2272, 10.1039/C9GC00250B.
- S. Fukuoka, I. Fukawa, T. Adachi, H. Fujita, N. Sugiyama and T. Sawa, Org. Process Res. Dev., 2019, 23, 145–169, DOI:10.1021/acs.oprd.8b00391.
- F. Isnard, F. Santulli, M. Cozzolino, M. Lamberti, C. Pellecchia and M. Mazzeo, Catal. Sci. Technol., 2019, 9, 3090–3098, 10.1039/C9CY00806C.
- S. Kernbichl, M. Reiter, J. Mock and B. Rieger, Macromolecules, 2019, 52, 8476–8483, DOI:10.1021/acs.macromol.9b01777.
- F. Santulli, I. D'Auria, L. Boggioni, S. Losio, M. Proverbio, C. Costabile and M. Mazzeo, Organometallics, 2020, 39, 1213–1220, DOI:10.1021/acs.organomet.0c00016.
- H. J. Park, C. Y. Ryu and J. V. Crivello, J. Polym. Sci., Part A: Polym. Chem., 2013, 51, 109–117, DOI:10.1002/pola.26280.
- V. Sessini, M. Palenzuela, J. Damián and M. E. G. Mosquera, Polymer, 2020, 210, 123003, DOI:10.1016/j.polymer.2020.123003.
- M. Maiza, M. T. Benaniba, G. Quintard and V. Massardier-Nageotte, Polimeros, 2015, 25 DOI:10.1590/0104-1428.1986.
- S. Caillol, Eur. Polym. J., 2023, 193, 112096, DOI:10.1016/j.eurpolymj.2023.112096.
- G. I. C. Righetti, R. Nasti, G. Beretta, M. Levi, S. Turri and R. Suriano, Polymer, 2023, 15, 1848, DOI:10.3390/polym15081848.
- M. T. Muñoz, M. Palenzuela, T. Cuenca and M. E. G. Mosquera, ChemCatChem, 2018, 10, 936–939, DOI:10.1002/cctc.201701377.
- D. Battegazzore, S. Bocchini and A. Frache, eXPRESS Polym. Lett., 2011, 5, 849–858, DOI:10.3144/EXPRESSPOLYMLETT.2011.84.
- F. Castro-Gómez, G. Salassa, A. W. Kleij and C. Bo, Chem. – Eur. J., 2013, 19, 6289–6298, DOI:10.1002/chem.201203985.
- A. Rehman, A. M. López Fernández, M. F. M. Gunam Resul and A. Harvey, J. CO2 Util., 2019, 29, 126–133, DOI:10.1016/j.jcou.2018.12.001.
- M. Gordon and J. S. Taylor, J. Appl. Chem., 1952, 2, 493–500, DOI:10.1002/jctb.5010020901.
- T. G. Fox, Bull. Am. Phys. Soc., 1952, 1, 123 Search PubMed.
- R. Simha and R. F. Boyer, J. Chem. Phys., 2004, 37, 1003–1007, DOI:10.1063/1.1733201.
- T. Nishi and T. T. Wang, Macromolecules, 1975, 8, 909–915, DOI:10.1021/ma60048a040.
- J. D. Hoffman and J. J. Weeks, J. Chem. Phys., 2004, 37, 1723–1741, DOI:10.1063/1.1733363.
- M. Pizzoli, M. Scandola and G. Ceccorulli, Macromolecules, 2002, 35, 3937–3941, DOI:10.1021/ma012122x.
- H. D. Keith, F. J. Padden Jr. and T. P. Russell, Macromolecules, 1989, 22, 666–675, DOI:10.1021/ma00192a027.
Footnote |
| † Electronic supplementary information (ESI) available. See DOI: https://doi.org/10.1039/d3py00667k |
| This journal is © The Royal Society of Chemistry 2023 |

![[double bond, length as m-dash]](https://www.rsc.org/images/entities/char_e001.gif) C (LO)), 3.20–3.90 (s, 1H, C
C (LO)), 3.20–3.90 (s, 1H, C