 Open Access Article
Creative Commons Attribution 3.0 Unported Licence
Tailoring thermoresponsiveness of biocompatible polyethers: copolymers of linear glycerol and ethyl glycidyl ether†
Verena
Müller
 a,
Rebecca
Matthes
a,
Manfred
Wagner
b,
Matthias
Bros
c,
Philip
Dreier
*a and
Holger
Frey
a,
Rebecca
Matthes
a,
Manfred
Wagner
b,
Matthias
Bros
c,
Philip
Dreier
*a and
Holger
Frey
 *a
*a
aDepartment of Chemistry, Johannes Gutenberg University, Duesbergweg 10-14, D-55128 Mainz, Germany. E-mail: hfrey@uni-mainz.de
bMax Planck Institute for Polymer Chemistry, Ackermannweg 10, D-55128 Mainz, Germany
cUniversity Medical Centre, Johannes Gutenberg University, Langenbeckstraße 1, D-55101 Mainz, Germany
First published on 14th April 2023
Abstract
Linear polyglycerol is known as a highly hydrophilic and biocompatible polymer that is currently considered for numerous medical applications. Derived from this well-known structure, the synthesis of highly biocompatible, thermoresponsive polyether copolymers via statistical anionic ring-opening copolymerization of ethyl glycidyl ether (EGE) and ethoxy ethyl glycidyl ether (EEGE) is described. Subsequent deprotection of the acetal groups of EEGE yields copolymers of linear glycerol (linG) and EGE, P(linG-co-EGE). These copolymers showed monomodal and narrow molecular weight distributions with dispersities Đ ≤ 1.07. The microstructure was investigated via in situ1H NMR kinetics experiments, revealing reactivity ratios of rEEGE = 1.787 ± 0.007 and rEGE = 0.560 ± 0.002, showing a slightly favored incorporation of EEGE over EGE. Due to the deliberate incorporation of rather hydrophobic EGE units into the water soluble linPG, tunable thermoresponsive behavior is achieved with cloud point temperatures Tcp between 9.0–71.4 °C. Besides the commonly utilized method turbidimetry, temperature-dependent 1H NMR measurements were used for more accurate and reproducible results. The change of the hydrodynamic radii rH of the copolymers and their aggregates upon reaching Tcp was investigated via DOSY NMR spectroscopy. To explore possible biomedical applications, as an example, the cell viability and immunology of an exemplary P(linG-co-EGE) copolymer sample was investigated. Since both, cell viability and immunology are comparable to the gold standard PEG, the herein presented copolymers show high potential as biocompatible and thermoresponsive alternatives to PEG for biomedical applications.
Introduction
Polymers showing responsive behavior to external stimuli, especially thermoresponsive behavior, are promising materials for many applications, e.g. drug delivery1,2 or tissue engineering.3,4 Thermoresponsive polymers with a lower critical solution temperature (LCST) are water soluble due to strong hydration of the polymer molecules below a critical temperature, the cloud point temperature Tcp. Upon temperature increase above the Tcp, the polymer chains aggregate due to inter- and intramolecular interaction.5,6 Thermodynamically, the cloud point phase separation is driven by unfavorable entropy of mixing.2,4,5The most intensely studied thermoresponsive polymer is poly(N-isopropylacrylamide) (PNIPAAm), which exhibits LCST behavior with Tcp = 32 °C.7 However, there is a controversial discussion regarding the toxicity of PNIPAAm. Monomer impurities in the polymer can cause cytotoxicity and therefore PNIPAAm has been viewed to be problematic for biomedical applications.8
Biocompatible alternatives to PNIPAAm may be found in the polymer class of thermoresponsive polyethers.9 Generally, aliphatic polyethers can be synthesized via anionic ring-opening polymerization (AROP),10 monomer-activated ring-opening polymerization (MAROP)11 or AROP with phosphazene bases12–14 amongst other (organo-)catalytic pathways. The AROP of glycidyl ethers is limited with respect to molecular weights due to proton abstraction in α-position of the epoxide moiety under the harsh, basic polymerization conditions.15 This side reaction, also known for the AROP of propylene oxide,10 can be prevented to some extent, if a weakly binding counterion like Cs+ is utilized in a polar and aprotic solvent at room temperature.10,16 Nevertheless, to obtain higher molecular weights, both AROP with phosphazene bases and MAROP were introduced. The drawback of both polymerization techniques is the demanding work-up procedure and the toxicity of impurities, i.e. phosphazene base or inorganic salt, which can cause cytotoxicity of the obtained polymers.10–13,17 If biomedical applications of polyethers are targeted, AROP is best suited and highly established for medical grade PEG, because no toxic catalyst is required, and highly defined materials are obtained.18
Aoki et al.19 investigated the thermoresponsive behavior of poly(glycidyl ether) homopolymers, namely poly(glycidyl methyl ether) (PGME) and poly(ethyl glycidyl ether) (PEGE) via turbidimetry and reported a Tcp of 57.7 °C and 14.6 °C, respectively. Schmalz et al.20 introduced statistical copolymers of glycidyl methyl ether (GME) and ethyl glycidyl ether (EGE) (P(GME-co-EGE)) with Tcp between 10 and 58 °C, depending on the copolymer composition. An increase of the amount of the more hydrophilic comonomer GME leads to an increasing Tcp. The Tcp is not merely dependent on the copolymer composition, but equally on the polymer solution concentration and molecular weight.21,22 In a detailed study, Weinhart et al.21 synthesized random P(GME-co-EGE) copolymers and investigated the effect of increasing concentration and molecular weight on the Tcp, both leading to decreased Tcp.5,21 The presence of hydroxy functionalities instead of methoxy or ethoxy groups in each repeating unit results in the homopolymer of glycerol, linear polyglycerol (linPG), which shows very high aqueous solubility and biocompatibility, surpassing even the current gold standard poly(ethylene glycol) (PEG).23–25 Since direct AROP of the corresponding monomer glycidol leads to hyperbranched polyglycerol, linPG is commonly obtained via deprotection of various poly(glycidyl ethers), based on ethoxy ethyl glycidyl ether (EEGE), allyl glycidyl ether (AGE), tert-butyl glycidyl ether (tBGE) or benzyl glycidyl ether (BnGE).24,26,27 Due to the presence of the side chains and their atactic nature resulting from the polymerization of racemic monomer mixtures, linPG is obtained as an amorphous material.24 In contrast, PEG, which is a biocompatible polyether used in medicine and pharmaceutics, possesses no side chains and represents a semi-crystalline polymer.10,28 As recently shown by Kakuchi et al.,27 the copolymerization of protected glycidol with a more hydrophobic comonomer relying on phosphazene-base promoted AROP can be exploited to tailor the LCST behavior of the resulting copolymers. The authors reported the synthesis of the copolymer P(linG-co-EGE) and corresponding (multi)block copolymers. These P(linG-co-EGE) copolymers showed thermoresponsive behavior in aqueous solution with Tcp values ranging between 30.5 and 70.4 °C, depending on the copolymer composition.
The thermoresponsive behavior of copolymers depends on the copolymer microstructure, which is governed by the polymerization technique. The reactivity ratios of the copolymerization of GME and EGE are very similar, when the polymerization is conducted via MAROP (rGME = 0.98 and rEGE = 0.95 (Kelen-Tüdõs method)21), albeit very different under AROP conditions (rGME = 1.31 and rEGE = 0.55 (Fineman-Ross method)20). The ideally random EGE/GME copolymers prepared via MAROP by Weinhart et al.21 exhibit a sharp decrease of transmittance with increasing temperature. In contrast, the decrease of transmission was broadened for copolymers synthesized via AROP, which exhibit a soft gradient in the microstructure. As the molecular weights of the copolymers are comparable (Mn = 2200 g mol−1 (MAROP) and Mn = 1800 g mol−1 (AROP)) and the ratio of EGE![[thin space (1/6-em)]](https://www.rsc.org/images/entities/char_2009.gif) :
:![[thin space (1/6-em)]](https://www.rsc.org/images/entities/char_2009.gif) GME is the same (3
GME is the same (3![[thin space (1/6-em)]](https://www.rsc.org/images/entities/char_2009.gif) :
:![[thin space (1/6-em)]](https://www.rsc.org/images/entities/char_2009.gif) 1), this difference was assigned to the different copolymer microstructure.21 Kakuchi et al.27 investigated the difference in the thermoresponsive behavior of statistical and (multi)block copolymers of EGE and linG. The statistical copolymer P(linG-co-EGE) with an EGE-amount of 60% exhibited thermoresponsive behavior with Tcp = 50.5 °C. Both the triblock copolymer P(EGE-b-linG-b-EGE) and the pentablock copolymer P(EGE-b-linG-b-EGE-b-linG-b-EGE) with an EGE amount of 70% and 60%, respectively, showed thermoresponsive behavior with similar cloud points. In contrast, the block copolymer P(linG-b-EGE) with an EGE amount of 60% shows a two-step change in transmission. First the transmittance decreases with increasing temperature, before it increases again.
1), this difference was assigned to the different copolymer microstructure.21 Kakuchi et al.27 investigated the difference in the thermoresponsive behavior of statistical and (multi)block copolymers of EGE and linG. The statistical copolymer P(linG-co-EGE) with an EGE-amount of 60% exhibited thermoresponsive behavior with Tcp = 50.5 °C. Both the triblock copolymer P(EGE-b-linG-b-EGE) and the pentablock copolymer P(EGE-b-linG-b-EGE-b-linG-b-EGE) with an EGE amount of 70% and 60%, respectively, showed thermoresponsive behavior with similar cloud points. In contrast, the block copolymer P(linG-b-EGE) with an EGE amount of 60% shows a two-step change in transmission. First the transmittance decreases with increasing temperature, before it increases again.
The commonly utilized method for characterization of thermoresponsive behavior is turbidimetry due to its simple implementation in a temperature-controlled UV/Vis spectrometer. The drawback of this method is that measurements can be influenced by multiple factors, e.g. heating rate, wavelength, stirring rate and the cuvette.5 Further, external factors like humidity or air bubbles may also influence the measurements. Other characterization methods for thermoresponsive behavior are dynamic light scattering (DLS),5,29 differential scanning calorimetry (DSC)5,30 or 1H NMR spectroscopy.5,31 The latter detects the thermoresponsive change in structure on a molecular level and is therefore highly precise.5
Here we describe the synthesis of thermoresponsive statistical P(linG-co-EGE) copolymers via AROP of EEGE with EGE and subsequent removal of the acetal protective groups. Since the polymers are intended for biomedical purposes, the use of phosphazene bases is avoided, and “classical” AROP was employed. Molecular weights in the range of 3000 to 4500 g mol−1 were targeted, since this molecular weight range is often utilized in biomedical or pharmaceutical applications of PEG.25 Reactivity ratios are determined via precise in situ1H NMR kinetics measurements to elucidate the respective copolymer microstructure. An in-depth comparison of the critical solution behavior studied both via turbidimetry and 1H NMR spectroscopy is presented. Since no toxic catalysts or additives are required for the AROP, the synthesized copolymers are promising for biomedical applications. To evidence suitability for this field, the biocompatibility is demonstrated by cell viability and immunology assays with several murine cell types.
Experimental
Materials
All reagents were purchased from TCI, Sigma Aldrich, Acros Organics or VWR and used as received, unless otherwise stated. Ethyl glycidyl ether (EGE) was distilled before use. THF was flushed through basic Al2O3 to remove the stabilizer butylated hydroxytoluene (BHT). The synthesis of ethoxy ethyl glycidyl ether (EEGE) was performed according to a literature synthesis by Fitton et al.32 EGE and EEGE were dried over CaH2 before all polymerizations. Dowex® was activated with conc. aqueous HCl. Deuterated solvents were purchased from Deutero GmbH.Instrumentation
1H NMR spectra at 400 MHz and 13C NMR spectra at 100 MHz were recorded on a Bruker Advance II 400 and are referenced internally to residual proton signals of the deuterated solvent. In situ1H NMR kinetics studies were performed at 300 MHz on a Bruker Advance III HD 300, referenced internally to residual proton signals of the deuterated solvent. The graphic representation of the in situ1H NMR kinetics was achieved with NIREVAL software from Steube, Johann, Frey et al.33 For Tcp measurements, 1H NMR spectra at 500 MHz were recorded on a Bruker Advance III BR 500/51 and are referenced internally to residual proton signals of the deuterated solvent. The samples were brought to a specific temperature, and this temperature was kept constant for 30 min before a spectrum was measured. After that, the temperature was increased by 1 °C. DOSY measurements were recorded at 500 MHz on a Bruker III BR 500/51. SEC measurements were performed in DMF (flow rate: 1 mL min−1) with the internal standard toluene using an Agilent 1100 series with a HEMA 300/100/40 Å column cascade and RI detector. Calibration was carried out using poly(ethylene glycol) (PEG) standards provided by PSS. Matrix-assisted laser desorption and ionization time-of-flight mass spectroscopy (MALDI-ToF MS) measurements were performed on a Bruker Autoflex Max MALDI-ToF/ToF using trans-2-[3-(4-tert-butylphenyl)-2-methyl-2-propenyliden]malononitrile (DCTB) or α-cyano-4-hydroxycinnamic acid (HCCA) as a matrix and trifluoroacetic acid potassium salt (KTFA) or lithium chloride (LiCl) as a salt additive. UV/Vis transmittance measurements were performed with a Jasco V-630 UV/Vis spectrometer (λ = 600 nm, quartz cuvette, d = 10 mm). Measurements were performed in Milli-Q water at varying concentrations between 0.1 and 10.0 mg mL−1 at heating/cooling rates of 1.0 °C min−1. The normalized transmittance vs. temperature curve was fitted via sigmoidal fit. The cloud point temperature Tcp was defined as the temperature with 50% normalized transmittance.In situ 1H NMR kinetic studies and determination of reactivity ratios
The pre-dried initiator, the cesium salt of 2-benzyloxyethanol, was dissolved in DMSO-d6 and an aliquot was added to an NMR tube equipped with a Teflon stopcock. The monomers (24 mol% EEGE, 76 mol% EGE, total: 20 vol-%) were dried over CaH2 and added at −60 °C to the initiator solution. The solution was heated up to 25 °C right before the NMR measurement. All spectra were measured at 300 MHz with a time interval of 5 min between the spectra. The copolymerization ratios were determined via the non-terminal Jaacks method34 by the decreasing monomer proton signals at 2.70–2.71 ppm (EGE) and 2.74–2.75 ppm (EEGE). More details can be found in the ESI.† Due to the calculated copolymerization parameters, the microstructure of the copolymer was determined using NIREVAL software from Steube, Johann, Frey et al.33Investigation of immune cell viability and immunophenotype
Spleens were retrieved from C57BL/6 mice using a 40 μm cell strainer (Greiner Bio-One) to obtain a single cell suspension. Erythrocytes were lysed with a hypotonic lysis buffer. Spleen cells (4 × 10⁶ mL−1) were resuspended in IMDM culture medium supplemented with 5% fetal bovine serum, 100 U mL−1 penicillin, 100 μg mL−1 streptomycin, 50 μm β-mercaptoethanol and 2 mm L-glutamine and transferred into FACS tubes (500 μL). The copolymer or mPEG (M = 5000 g mol−1) was added (c = 1 and 10 μg mL−1) and samples were incubated overnight. After washing, the samples were incubated with fluorescence-labeled antibodies (CD-11b-SB600, CD11c-BV421, CD19-SB702, CD86-FITC, Ly6G-PE/eFl610, MHCII-APC, NK1.1-PE; all from Biolegend) and FVD-eFl780 (ThermoFisher) to discriminate viable/dead cells. Then, the samples were fixed in PBS containing 2 mm EDTA and 0.7% paraformaldehyde and analyzed in an Attune NxT flow cytometer (ThermoFisher). The spleen cell populations were identified via sequential gating.Synthesis of protected poly(ethoxy ethyl glycidyl ether-co-ethyl glycidyl ether) (P(EEGE-co-EGE))
Synthesis of deprotected poly(linear glycerol-co-ethyl glycidyl ether) (P(linG-co-EGE))
Results and discussion
Synthesis of protected poly(ethoxy ethyl glycidyl ether-co-ethyl glycidyl ether) (P(EEGE-co-EGE)) via AROP
The monomer ethoxy ethyl glycidyl ether (EEGE) was synthesized from ethyl vinyl ether and glycidol according to an established protocol.32 The 1H NMR spectrum of the synthesized EEGE is shown in Fig. S1 (ESI).† For copolymerizations, the initiator 2-benzyloxyethanol was deprotonated with CsOH resulting in a degree of deprotonation of 90%. The copolymers with comonomer ratios between 10![[thin space (1/6-em)]](https://www.rsc.org/images/entities/char_2009.gif) :
:![[thin space (1/6-em)]](https://www.rsc.org/images/entities/char_2009.gif) 90 and 80
90 and 80![[thin space (1/6-em)]](https://www.rsc.org/images/entities/char_2009.gif) :
:![[thin space (1/6-em)]](https://www.rsc.org/images/entities/char_2009.gif) 20 mol% (EEGE
20 mol% (EEGE![[thin space (1/6-em)]](https://www.rsc.org/images/entities/char_2009.gif) :
:![[thin space (1/6-em)]](https://www.rsc.org/images/entities/char_2009.gif) EGE) and the corresponding homopolymers were synthesized at room temperature (25 °C) in DMSO (Scheme 1). These polymerization conditions were crucial to suppress proton abstraction from the glycidyl ethers during polymerization.10,16 Compilations of all 1H NMR spectra and 13C NMR spectra are shown in Fig. S2 and S3 (ESI),† respectively. All signals can be assigned to the targeted copolymer structure. Importantly, there are no signals of allylic species (δ = 5.5–6.5 ppm), consequently no significant extent of proton abstraction was observed. The degrees of polymerization (Xn) and copolymer compositions are listed in Table 1. The compositions were calculated from the corresponding 1H NMR spectra by comparison of the integrals of the methyl groups (CH3(5): δ = 1.17 ppm and CH3(4): δ = 1.19 ppm). The detailed calculation of the composition can be found in the ESI.† The determined compositions are in good agreement with the monomer ratios employed. Small deviations are caused by systematic errors during integration of the 1H NMR spectra.
EGE) and the corresponding homopolymers were synthesized at room temperature (25 °C) in DMSO (Scheme 1). These polymerization conditions were crucial to suppress proton abstraction from the glycidyl ethers during polymerization.10,16 Compilations of all 1H NMR spectra and 13C NMR spectra are shown in Fig. S2 and S3 (ESI),† respectively. All signals can be assigned to the targeted copolymer structure. Importantly, there are no signals of allylic species (δ = 5.5–6.5 ppm), consequently no significant extent of proton abstraction was observed. The degrees of polymerization (Xn) and copolymer compositions are listed in Table 1. The compositions were calculated from the corresponding 1H NMR spectra by comparison of the integrals of the methyl groups (CH3(5): δ = 1.17 ppm and CH3(4): δ = 1.19 ppm). The detailed calculation of the composition can be found in the ESI.† The determined compositions are in good agreement with the monomer ratios employed. Small deviations are caused by systematic errors during integration of the 1H NMR spectra.
| Copolymer |
X
n,th. (EEGE![[thin space (1/6-em)]](https://www.rsc.org/images/entities/char_2009.gif) : :![[thin space (1/6-em)]](https://www.rsc.org/images/entities/char_2009.gif) EGE) EGE) |
X
n![[thin space (1/6-em)]](https://www.rsc.org/images/entities/char_2009.gif) a (EEGE a (EEGE![[thin space (1/6-em)]](https://www.rsc.org/images/entities/char_2009.gif) : :![[thin space (1/6-em)]](https://www.rsc.org/images/entities/char_2009.gif) EGE) EGE) |
mol% EEGEth. | mol% EEGEa | |
|---|---|---|---|---|---|
| a Determined by 1H NMR spectroscopy (400 MHz, DMSO-d6). | |||||
| 1 | PEGE | 0![[thin space (1/6-em)]](https://www.rsc.org/images/entities/char_2009.gif) : :![[thin space (1/6-em)]](https://www.rsc.org/images/entities/char_2009.gif) 30 30 |
0![[thin space (1/6-em)]](https://www.rsc.org/images/entities/char_2009.gif) : :![[thin space (1/6-em)]](https://www.rsc.org/images/entities/char_2009.gif) 37 37 |
0 | 0 |
| 2 | P(EEGE0.9-co-EGE0.91) | 3![[thin space (1/6-em)]](https://www.rsc.org/images/entities/char_2009.gif) : :![[thin space (1/6-em)]](https://www.rsc.org/images/entities/char_2009.gif) 27 27 |
3![[thin space (1/6-em)]](https://www.rsc.org/images/entities/char_2009.gif) : :![[thin space (1/6-em)]](https://www.rsc.org/images/entities/char_2009.gif) 31 31 |
10 | 9 |
| 3 | P(EEGE0.43-co-EGE0.57) | 10![[thin space (1/6-em)]](https://www.rsc.org/images/entities/char_2009.gif) : :![[thin space (1/6-em)]](https://www.rsc.org/images/entities/char_2009.gif) 15 15 |
11![[thin space (1/6-em)]](https://www.rsc.org/images/entities/char_2009.gif) : :![[thin space (1/6-em)]](https://www.rsc.org/images/entities/char_2009.gif) 14 14 |
40 | 43 |
| 4 | P(EEGE0.50-co-EGE0.50) | 13![[thin space (1/6-em)]](https://www.rsc.org/images/entities/char_2009.gif) : :![[thin space (1/6-em)]](https://www.rsc.org/images/entities/char_2009.gif) 13 13 |
11![[thin space (1/6-em)]](https://www.rsc.org/images/entities/char_2009.gif) : :![[thin space (1/6-em)]](https://www.rsc.org/images/entities/char_2009.gif) 11 11 |
50 | 50 |
| 5 | P(EEGE0.57-co-EGE0.43) | 18![[thin space (1/6-em)]](https://www.rsc.org/images/entities/char_2009.gif) : :![[thin space (1/6-em)]](https://www.rsc.org/images/entities/char_2009.gif) 12 12 |
18![[thin space (1/6-em)]](https://www.rsc.org/images/entities/char_2009.gif) : :![[thin space (1/6-em)]](https://www.rsc.org/images/entities/char_2009.gif) 13 13 |
60 | 57 |
| 6 | P(EEGE0.77-co-EGE0.23) | 24![[thin space (1/6-em)]](https://www.rsc.org/images/entities/char_2009.gif) : :![[thin space (1/6-em)]](https://www.rsc.org/images/entities/char_2009.gif) 6 6 |
24![[thin space (1/6-em)]](https://www.rsc.org/images/entities/char_2009.gif) : :![[thin space (1/6-em)]](https://www.rsc.org/images/entities/char_2009.gif) 7 7 |
80 | 77 |
| 7 | PEEGE | 22![[thin space (1/6-em)]](https://www.rsc.org/images/entities/char_2009.gif) : :![[thin space (1/6-em)]](https://www.rsc.org/images/entities/char_2009.gif) 0 0 |
25![[thin space (1/6-em)]](https://www.rsc.org/images/entities/char_2009.gif) : :![[thin space (1/6-em)]](https://www.rsc.org/images/entities/char_2009.gif) 0 0 |
100 | 100 |
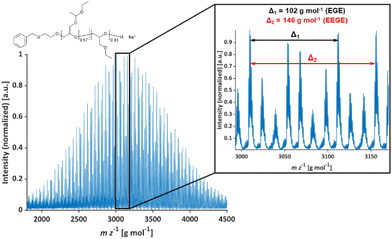
The molecular weights Mn of the copolymers were determined via1H NMR spectroscopy, SEC and MALDI-ToF MS, the dispersities Đ were determined by SEC. The targeted and determined molecular weights from 1H NMR spectroscopy are in good agreement, showing quantitative consumption of both monomers. The molecular weights determined by SEC are generally underestimated because of the deviating hydrodynamic radii of the copolymers. This is due to the presence of side chains and different polarity compared to the poly(ethylene glycol) (PEG) standards. All samples show narrow and monomodal molecular weight distributions in MALDI-ToF MS (Fig. 1) as well as in SEC (Fig. 2 and Fig. S5, ESI†), confirming the controlled copolymerization under the established polymerization conditions.
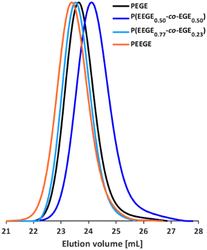 | ||
| Fig. 2 SEC curves (DMF, PEG calibration) of selected P(EEGE-co-EGE) copolymers and the homopolymers PEGE and PEEGE. | ||
In Table 2, molecular weight characterization is presented. The lower Mn observed in MALDI-ToF MS measurements in comparison to 1H NMR measurements may be caused by partial deprotection of the acetal groups during the measurements (see Fig. S6, ESI†).
| Copolymer | M n,th. [g mol−1] |
M
n![[thin space (1/6-em)]](https://www.rsc.org/images/entities/char_2009.gif) a [g mol−1] a [g mol−1] |
M
n![[thin space (1/6-em)]](https://www.rsc.org/images/entities/char_2009.gif) b [g mol−1] b [g mol−1] |
M
n![[thin space (1/6-em)]](https://www.rsc.org/images/entities/char_2009.gif) c [g mol−1] c [g mol−1] |
Đ | |
|---|---|---|---|---|---|---|
| a Determined by 1H NMR spectroscopy. b Determined by SEC. c Determined by MALDI-ToF MS. | ||||||
| 1 | PEGE | 3400 | 3800 | 1900 | 2900 | 1.05 |
| 2 | P(EEGE0.9-co-EGE0.91) | 3300 | 3800 | 2000 | 3000 | 1.04 |
| 3 | P(EEGE0.43-co-EGE0.57) | 3100 | 2900 | 1700 | 2700 | 1.05 |
| 4 | P(EEGE0.50-co-EGE0.50) | 3400 | 2900 | 1500 | 2600 | 1.08 |
| 5 | P(EEGE0.57-co-EGE0.43) | 4000 | 4000 | 2000 | 3300 | 1.04 |
| 6 | P(EEGE0.77-co-EGE0.23) | 4300 | 4400 | 2000 | 3400 | 1.04 |
| 7 | PEEGE | 3500 | 3800 | 1800 | 3100 | 1.07 |
Removal of protective groups to poly(linear glycerol-co-ethyl glycidyl ether) (P(linG-co-EGE))
The acetal protecting group of the EEGE units of the homo- and copolymers were removed via acidic deprotection using the ion exchange resin Dowex® (Scheme 2). Successful deprotection was confirmed by 1H NMR spectroscopy, as shown exemplarily for the copolymer P(linG0.57-co-EGE0.43) in Fig. 3. The 1H NMR spectrum confirms the absence of acetal protons (δ = 4.64 ppm) and protons of the methyl group next to the acetal group (δ = 1.17 ppm) after deprotection (black spectrum, Fig. 3), indicating the successful cleavage of the protecting groups. Additionally, the signal for the hydroxy group (δ = 4.50 ppm) after deprotection can be assigned to the deprotected linG units. The 1H NMR and 13C NMR spectra for all copolymers are shown in Fig. S7 and S8 (ESI),† respectively. | ||
| Scheme 2 Synthesis of the copolymers P(linG-co-EGE) via acidic deprotection with the ion exchange resin Dowex®. | ||
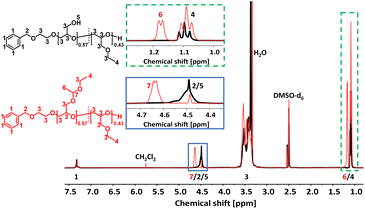 | ||
| Fig. 3 Stacked 1H NMR spectra (400 MHz, DMSO-d6) of P(linG0.57-co-EGE0.43) (black) and P(EEGE0.57-co-EGE0.43) (red). | ||
The molecular weights of the deprotected linPG copolymers were analyzed in analogy to the aforementioned copolymer samples and are in good agreement with the calculated molecular weights. The molecular weight distributions determined by SEC (Fig. 4 and Fig. S9–S10, ESI†) are narrow and monomodal for all samples, with the exception of P(linG0.57-co-EGE0.43). All MALDI-ToF mass spectra show monomodal molecular weight distributions (example in Fig. S11, ESI†). Table 3 compares the investigated molecular weights. Differences of the molecular weights of MALDI-ToF MS analysis compared to the calculated Mn are caused by the determination of the theoretical molecular weights, which is based on the error-prone integration of 1H NMR spectra.
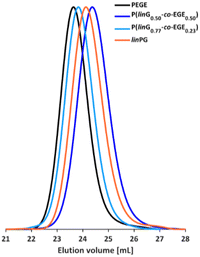 | ||
| Fig. 4 SEC curves (DMF, PEG calibration) of selected P(linG-co-EGE) copolymers and the homopolymers PEGE and linPG. | ||
| Copolymer |
M
n,th.![[thin space (1/6-em)]](https://www.rsc.org/images/entities/char_2009.gif) a [g mol−1] a [g mol−1] |
M
n![[thin space (1/6-em)]](https://www.rsc.org/images/entities/char_2009.gif) b [g mol−1] b [g mol−1] |
M
n![[thin space (1/6-em)]](https://www.rsc.org/images/entities/char_2009.gif) c [g mol−1] c [g mol−1] |
M
n![[thin space (1/6-em)]](https://www.rsc.org/images/entities/char_2009.gif) d [g mol−1] d [g mol−1] |
Đ | |
|---|---|---|---|---|---|---|
| a Calculated from the composition of P(EEGE-co-EGE) copolymers assuming complete deprotection of the acetal protecting groups. b Determined by 1H NMR spectroscopy. c Determined by SEC. d Determined by MALDI-ToF MS. | ||||||
| 1 | PEGE | 3400 | 3800 | 1900 | 2900 | 1.05 |
| 2 | P(linG9-co-EGE91) | 3500 | 3300 | 1900 | 2900 | 1.06 |
| 3 | P(linG43-co-EGE57) | 2200 | 2600 | 1600 | 1900 | 1.07 |
| 4 | P(linG50-co-EGE50) | 2100 | 2200 | 1400 | 1600 | 1.07 |
| 5 | P(linG57-co-EGE43) | 2800 | 2400 | 1900 | 2100 | 1.12 |
| 6 | P(linG77-co-EGE23) | 2600 | 2300 | 1700 | 1800 | 1.06 |
| 7 | linPG | 2000 | 2200 | 1500 | 1600 | 1.07 |
Determination of the reactivity ratios of the monomers EEGE (rEEGE) and EGE (rEGE) polymerized by AROP
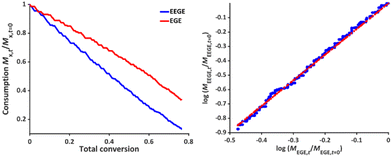
To determine the reactivity ratios, the copolymerization of EEGE and EGE was performed in DMSO-d6 inside a NMR tube, employing the synthesis conditions described above. For these studies, the targeted composition was 24 mol% EEGE and 76 mol% EGE, respectively. For determination of the reactivity ratios, the consumption of both monomers was followed via in situ1H NMR spectroscopy. Due to similar chemical shifts of the monomer proton signals in the 1H NMR spectrum, the non-overlapping part of one proton of the epoxide methylene group of each monomer is considered exclusively (Fig. S12, ESI†). Fig. 5 (left) shows the consumption of each monomer vs. total conversion, demonstrating faster incorporation of EEGE compared to EGE. This is further evaluated by the determination of the reactivity ratios r1 and r2. The reactivity ratios are defined by the varying rate constants k11, k12, k21 and k22 (eqn (1) and (2)). | (1) |
 | (2) |
In non-terminal models, the reactivity ratio r2 is inversely proportional to r1 (r2 = r1−1), relying on the assumption that the reactivity of the chain end is independent of the nature of the active species (EEGE or EGE chain end). As a result, the relative incorporation rate of the monomers is merely dependent on the interaction of the monomer with the counter ion at the chain end.35,36
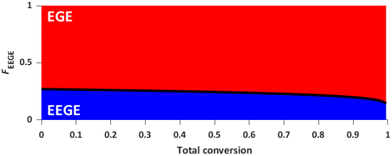
The reactivity ratios of the copolymerization were calculated by the non-terminal Jaacks approach.34 From the Jaacks plot (Fig. 5, right), reactivity ratios of rEEGE = 1.787 ± 0.007 and rEGE = 0.560 ± 0.002 are obtained, mirroring a weak gradient microstructure of the copolymer. The microstructure of the copolymer is visualized by plotting the monomer fraction FEEGEvs. total conversion (Fig. 6). The slightly preferred incorporation of EEGE over EGE repeating units at the beginning of the copolymerization may be explained by the side chain of EEGE, which contain one additional oxygen atom compared to EGE. In analogy to the recently reported comparison of allyl glycidyl ether and ethoxy vinyl glycidyl ether, one additional oxygen atom increases the chelation capability of the glycidyl ether for the counter cation, leading to a slightly higher reactivity.35,36
Lower critical solution temperatures (LCST)
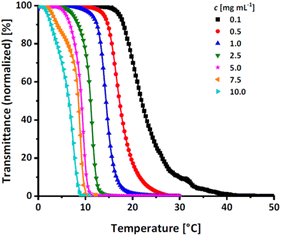 | ||
| Fig. 7 Transmittance vs. temperature plot of the copolymer P(EEGE0.43-co-EGE0.57) at different concentrations. Straight lines show sigmoidal fits to determine Tcp at 50% transmittance. | ||
| Polymer | c [mg mL−1] | ||||||
|---|---|---|---|---|---|---|---|
| 0.1 | 0.5 | 1.0 | 2.5 | 5.0 | 7.5 | 10.0 | |
| T cp [°C] | |||||||
| P(EEGE0.43-co-EGE0.57) | 21.9 | 17.2 | 14.4 | 11.1 | 9.2 | 8.5 | 6.5 |
| PEGE | 27.7 | 20.4 | 19.1 | 15.7 | 12.0 | 10.4 | 9.0 |
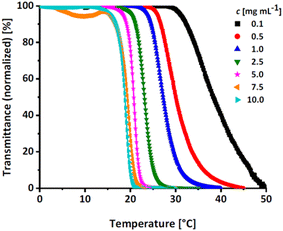 | ||
| Fig. 8 Transmittance vs. temperature plot of the copolymer P(linG0.09-co-EGE0.91) at different concentrations. Straight lines show sigmoidal fits to determine Tcp at 50% transmittance. | ||
Fig. S17 (ESI)† compares the heating and cooling curves for the copolymer P(linG0.09-co-EGE0.91) as an example, at a concentration of c = 2.5 mg mL−1. Since the hysteresis is negligibly small, only the heating curves are taken into account hereafter. Table 5 and Fig. 9 summarize the Tcp of all P(linG-co-EGE) copolymers and both homopolymers. There is a linear correlation of the content of linG units with the increase of Tcp. As expected, an increasing amount of linG units enhances the polarity of the copolymers. Consequently, water-polymer interactions become favored due to hydrogen bonding between water molecules and the hydroxy functionalities. The copolymer with 43% linG units shows no change in transmittance over the whole temperature range for c = 0.1 and an incomplete decrease of transmittance for c = 0.5–2.5 mg mL−1. If the content of linG units exceeds 57%, no Tcp was observed for all concentrations.
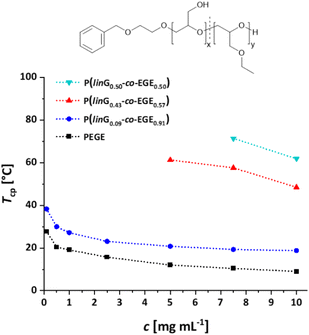 | ||
| Fig. 9 Summary of concentration dependent Tcp of P(linG-co-EGE). Dotted lines are depicted to guide the eye. | ||
| mol% linG | c [mg mL−1] | |||||||
|---|---|---|---|---|---|---|---|---|
| 0.1 | 0.5 | 1.0 | 2.5 | 5.0 | 7.5 | 10.0 | ||
| T cp [°C] | ||||||||
| — No change in transmittance. * Complete decrease of transmittance not reached at T = 100 °C, Tcp cannot be determined. | ||||||||
| 1 | 0 | 27.7 | 20.4 | 19.1 | 15.7 | 12.0 | 10.4 | 9.0 |
| 2 | 9 | 38.3 | 30.0 | 27.2 | 23.1 | 20.8 | 19.3 | 18.8 |
| 3 | 43 | — | * | * | * | 61.3 | 57.6 | 48.5 |
| 4 | 50 | — | * | * | * | * | 71.4 | 61.9 |
| 5 | 57 | — | — | — | — | — | — | — |
| 6 | 77 | — | — | — | — | — | — | — |
| 7 | 100 | — | — | — | — | — | — | — |
The described results regarding the thermoresponsive solution behavior of the presented copolymers with linG amounts up to 50% are in line with the recent results of Kakuchi et al.27 These authors synthesized P(linG-co-EGE) copolymers via a different route, capitalizing on phosphazene base-catalyzed AROP of EGE and benzyl glycidyl ether, followed by deprotection of the benzyl glycidyl ether via hydrogenation. However, above a linG amount of 50%, Kakuchi et al. still observed Tcp values, while our copolymer samples exhibit full solubility up to 100 °C. This may be caused by the higher molecular weights of the copolymers reported by Kakuchi et al. (Kakuchi: 11–16 kg mol−1, compared to the herein presented copolymers with 2–4 kg mol−1) and therefore higher local concentration of copolymer in solution. This leads to an earlier aggregation of the copolymers because of a higher possibility for intra- and intermolecular polymer–polymer interactions and thus to a decrease of Tcp.21 Further reasons for the differences in Tcp may lie in the microstructure of the copolymers. While the herein presented copolymers exhibit an almost ideally statistical comonomer distribution (Fig. 6), the microstructure of the copolymers of the Kakuchi group was not investigated, but likely deviates from the copolymers of this work due to the different monomer combination and copolymerization technique employed.
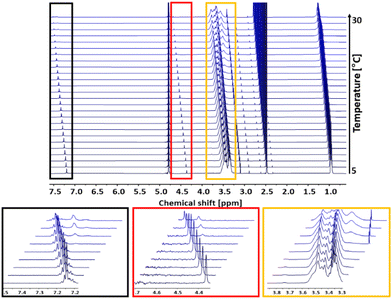 | ||
| Fig. 10 1H NMR analysis (500 MHz, D2O) of Tcp of the copolymer P(linG0.09-co-EGE0.91) in a temperature range of 5–30 °C. Insets: Every third spectrum is shown for overview purposes. | ||
In the following, Tcp,NMR defines the temperature at which polymer chains start to aggregate. To compare the results of the 1H NMR measurements with the turbidimetry experiment, Tcp,UV/VIS is herein defined as the temperature with 95% transmittance because this value marks the beginning of polymer chain aggregation. Compared to Tcp,NMR = 19 °C, Tcp,UV/Vis has a slightly lower value (Tcp,UV/Vis = 15.7 °C). This difference is possibly caused by applying different heating rates for each measurement. While the temperature was increased constantly with a heating rate of 1 °C min−1 in the turbidimetry measurement, the temperature in the 1H NMR analysis was kept constant for 30 min before each measurement. Hence, thermodynamic equilibrium between the free polymer chains and the polymer aggregates is established. Considering the precise and constant temperature setting as well as the less systematic error-prone set-up of the 1H NMR compared to UV/Vis analysis, the evaluation via NMR constitutes the preferable method leading to more reliable results for the determination of Tcp.
 | (3) |
Immune cell viability and immunophenotype of P(linG-co-EGE)
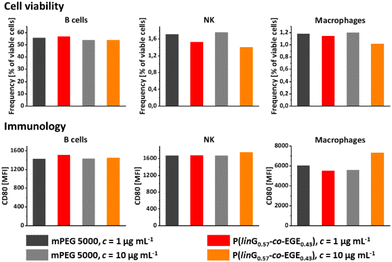
Both linPG and copolymers of short chain alkyl glycidyl ethers (SCAGEs), e.g. copolymers of EGE and glycidyl methyl ether (GME) P(EGE-co-GME), are known for their excellent biocompatibility and high cell viability.24,40 To explore potential biomedical applications of the herein synthesized copolymer series P(linG-co-EGE), the cell viability and effects of the synthesized copolymer sample P(linG0.57-co-EGE0.43) as a typical representative of the copolyether series on immune cells were explored. For this purpose, the copolymer and monomethyl poly(ethylene glycol) (mPEG) (Mn = 5000 g mol−1) as a reference were incubated with murine cells (c = 1 and 10 μg mL−1) over night. The cell viability was investigated via fluorescence-activated cell sorting (FACS) for the following cell types: B cells, natural killer cells (NK), macrophages (Fig. 12, top), dendritic cells (DC), polymorphonuclear cells (PMN) and T cells (Fig. S18, top, ESI†). The copolymer P(linG0.57-co-EGE0.43) shows comparable cell viability as the gold standard mPEG for all cell types for both concentrations, even at a higher concentration of c = 10 μg mL−1. Immunological behavior was investigated by expression of the surface proteins CD80 (Fig. 12, bottom and Fig. S18,† bottom), CD86 and MCHII (both Fig. S19, ESI†). The corresponding fluorescence labelled antibodies of these surface activation markers were measured by FACS. For all cell types, the immune cell activation of the copolymer is comparable to mPEG, independent of the investigated polymer concentration range. Hence, the results indicate the suitability of the presented copolymers for biomedical and pharmaceutical applications as a thermoresponsive alternative to mPEG.Conclusions
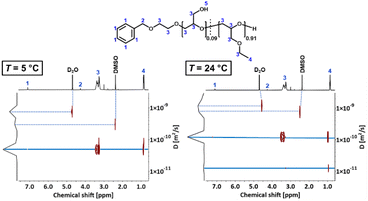
Statistical copolymers of ethyl glycidyl ether (EGE) and linear glycerol (linG) with systematically varied comonomer composition have been prepared. For this purpose, EGE and ethoxy ethyl glycidyl ether (EEGE) were copolymerized via anionic ring-opening polymerization (AROP) at room temperature and subsequent acidic deprotection of the acetal group of EEGE. Molecular weights in the range of 2200 to 3800 g mol−1 were targeted and confirmed via1H NMR spectroscopy and MALDI ToF MS. The use of catalysts or monomer-activation was avoided to generate copolymers suitable for medical applications. SEC traces of both homopolymers (linPG and PEGE) and copolymers (P(linGx-co-EGE1−x), x: mol% linG) showed very narrow, monomodal distributions (Đ = 1.04–1.07), confirming controlled homo- and copolymerization, respectively. The copolymerization kinetics of EGE and EEGE was investigated via in situ1H NMR kinetics measurements. Evaluation with the non-terminal Jaacks method resulted in reactivity ratios of rEEGE = 1.787 ± 0.007 and rEGE = 0.560 ± 0.002, confirming a slightly faster incorporation of EEGE over EGE in the polymer chains during AROP. These values show a slight gradient, evidencing an almost ideally random copolymer formation. Further, the thermoresponsive behavior of one exemplary P(EEGE-co-EGE) copolymer and all deprotected P(linG-co-EGE) copolymers and homopolymers in aqueous solution was investigated via turbidimetry. Depending on the polarity (acetal or hydroxymethylene group) and the incorporated amount of side chains, the hydrophilicity of the copolymers can be tailored in a linear fashion. The Tcp of the copolymer P(linG0.09-co-EGE0.91) was further investigated via temperature-dependent 1H NMR spectroscopy. Compared to the Tcp determined via turbidimetry, the Tcp of the 1H NMR measurements is slightly higher (ΔTcp = 3 °C). This discrepancy might be caused by different heating rates and a less error-prone set-up of the 1H NMR measurement. In addition, the hydrodynamic radius rH of the copolymer P(linG0.09-co-EGE0.91) was investigated via DOSY NMR spectroscopy for both T < Tcp and T > Tcp. For T < Tcp merely one species with rH = 2.1 nm is observed. Above Tcp, a second mode with a larger rH of 16.0 nm appears, which can be assigned to aggregated copolymer chains. Cell viability and immunology of the synthesized copolymers were investigated for P(linG0.77-co-EGE0.23) as a typical copolymer sample. Both cell viability and immunological properties are fully comparable to mPEG, the gold standard polyether broadly used in medicine and pharmaceutics.28 The herein presented copolymers are therefore suitable as a thermoresponsive alternative for mPEG in (bio)medical applications, permitting to tailor the LCST, e.g., for nanomedicine and thermoresponsive therapeutics.Author contributions
The manuscript was written through contributions of all authors. All authors have given approval to the final version of the manuscript.Ethical statement
C57BL/6 mice were kept in the Central Animal Facility of the Johannes Gutenberg-University Mainz under pathogen-free conditions on a standard diet according to the guidelines of the regional animal care committee (Rhineland-Palatinate, Germany). The “Principles of Laboratory Animal Care” (NIH publication no. 85-23, revised 1985) were followed. Ethical review and approval were waived for this study due to exclusive use of isolated mouse cells derived from mice sacrificed for organ retrieval according to § 4(3) TierSchG.Conflicts of interest
There are no conflicts to declare.Acknowledgements
V. M. thanks Monika Schmelzer for the SEC measurements and Elena Berger-Nicoletti for the MALDI-ToF MS measurements. H. F., R. M. and P. D. thank the ERC for important financial support in the context of the ERC Advanced Grant “RandoPEGMed”.References
- (a) K. B. Doorty, T. A. Golubeva, A. V. Gorelov, Y. A. Rochev, L. T. Allen, K. A. Dawson, W. M. Gallagher and A. K. Keenan, Cardiovasc. Pathol., 2003, 12, 105–110 CrossRef CAS PubMed; (b) H. Vihola, A. Laukkanen, H. Tenhu and J. Hirvonen, J. Pharm. Sci., 2008, 97, 4783–4793 CrossRef CAS.
- D. C. Tuncaboylu and C. Wischke, Pharmaceutics, 2022, 14, 2331–2371 CrossRef CAS PubMed.
- R. A. Stile and K. E. Healy, Biomacromolecules, 2001, 2, 185–194 CrossRef CAS PubMed.
- F. Doberenz, K. Zeng, C. Willems, K. Zhang and T. Groth, J. Mater. Chem. B, 2020, 8, 607–628 RSC.
- Q. Zhang, C. Weber, U. S. Schubert and R. Hoogenboom, Mater. Horiz., 2017, 4, 109–116 RSC.
- H. G. Schild, Prog. Polym. Sci., 1992, 17, 163–249 CrossRef CAS.
- S. Fujishige, K. Kubota and I. Ando, J. Phys. Chem., 1989, 93, 3311–3313 CrossRef CAS.
- S. Yogev, A. Shabtay-Orbach, A. Nyska and B. Mizrahi, Toxicol. Pathol., 2019, 47, 426–432 CrossRef CAS PubMed.
- C. Mangold, B. Obermeier, F. Wurm and H. Frey, Macromol. Rapid Commun., 2011, 32, 1930–1934 CrossRef CAS PubMed.
- J. Herzberger, K. Niederer, H. Pohlit, J. Seiwert, M. Worm, F. R. Wurm and H. Frey, Chem. Rev., 2016, 116, 2170–2243 CrossRef CAS PubMed.
- C. Billouard, S. Carlotti, P. Desbois and A. Deffieux, Macromolecules, 2004, 37, 4038–4043 CrossRef CAS.
- B. Eßwein, A. Molenberg and M. Möller, Macromol. Symp., 1996, 107, 331–340 CrossRef.
- B. Eßwein, N. M. Steidl and M. Möller, Macromol. Rapid Commun., 1996, 17, 143–148 CrossRef.
- (a) S. Liu, L. Liu, Y. Zhou, Y. Chen and J. Zhao, Polym. Chem., 2022, 13, 3650–3659 RSC; (b) Y. Chen, J. Shen, S. Liu, J. Zhao, Y. Wang and G. Zhang, Macromolecules, 2018, 51, 8286–8297 CrossRef CAS.
- C. C. Price, Y. Atarashi and R. Yamamoto, J. Polym. Sci., Part A: Polym. Chem., 1969, 7, 569–574 CrossRef CAS.
- M. Hans, H. Keul and M. Moeller, Polymer, 2009, 50, 1103–1108 CrossRef CAS.
- A. Labbé, S. Carlotti, C. Billouard, P. Desbois and A. Deffieux, Macromolecules, 2007, 40, 7842–7847 CrossRef.
- R. Matthes and H. Frey, Biomacromolecules, 2022, 23, 2219–2235 CrossRef CAS PubMed.
- S. Aoki, A. Koide, S.-I. Imabayashi and M. Watanabe, Chem. Lett., 2002, 31, 1128–1129 CrossRef.
- S. Reinicke, J. Schmelz, A. Lapp, M. Karg, T. Hellweg and H. Schmalz, Soft Matter, 2009, 2648–2657 CAS.
- S. Heinen, S. Rackow, A. Schäfer and M. Weinhart, Macromolecules, 2017, 50, 44–53 CrossRef CAS.
- T. Becherer, S. Heinen, Q. Wei, R. Haag and M. Weinhart, Acta Biomater., 2015, 25, 43–55 CrossRef CAS PubMed.
- (a) R. K. Kainthan, J. Janzen, E. Levin, D. V. Devine and D. E. Brooks, Biomacromolecules, 2006, 7, 703–709 CrossRef CAS PubMed; (b) C. Mangold, F. Wurm, B. Obermeier and H. Frey, Macromol. Rapid Commun., 2010, 31, 258–264 CrossRef CAS PubMed; (c) Y. Li, J. Xu and L. Hu, J. Mol. Liq., 2022, 360, 119538 CrossRef CAS.
- A. Thomas, S. S. Müller and H. Frey, Biomacromolecules, 2014, 15, 1935–1954 CrossRef CAS PubMed.
- D. Braatz, M. Cherri, M. Tully, M. Dimde, G. Ma, E. Mohammadifar, F. Reisbeck, V. Ahmadi, M. Schirner and R. Haag, Angew. Chem., Int. Ed., 2022, 61, e202203942 CrossRef CAS PubMed.
- (a) M. Erberich, H. Keul and M. Möller, Macromolecules, 2007, 40, 3070–3079 CrossRef CAS; (b) K. Knop, R. Hoogenboom, D. Fischer and U. S. Schubert, Angew. Chem., Int. Ed., 2010, 49, 6288–6308 CrossRef CAS PubMed.
- T. He, Y. Wang, A. Narumi, L. Xu, S.-I. Sato, X. Shen and T. Kakuchi, Polymers, 2021, 13, 3873–3888 CrossRef CAS PubMed.
- C. Fruijtier-Pölloth, Toxicology, 2005, 214, 1–38 CrossRef PubMed.
- (a) S. Monge, S. Antoniacomi, V. Lapinte, V. Darcos and J.-J. Robin, Polym. Chem., 2012, 3, 2502 RSC; (b) J.-F. Lutz, K. Weichenhan, Ö. Akdemir and A. Hoth, Macromolecules, 2007, 40, 2503–2508 CrossRef CAS.
- (a) M. Karesoja, E. Karjalainen, S. Hietala and H. Tenhu, J. Phys. Chem. B, 2014, 118, 10776–10784 CrossRef CAS PubMed; (b) A. Laukkanen, L. Valtola, F. M. Winnik and H. Tenhu, Polymer, 2005, 46, 7055–7065 CrossRef CAS.
- (a) T. Li, H. Tang and P. Wu, Soft Matter, 2015, 11, 3046–3055 RSC; (b) M. V. Deshmukh, A. A. Vaidya, M. G. Kulkarni, P. R. Rajamohanan and S. Ganapathy, Polymer, 2000, 41, 7951–7960 CrossRef CAS.
- A. O. Fitton, J. Hill, D. E. Jane and R. Millar, Synthesis, 1987, 1140–1142 CrossRef CAS.
- M. Steube, T. Johann, M. Plank, S. Tjaberings, A. H. Gröschel, M. Gallei, H. Frey and A. H. E. Müller, Macromolecules, 2019, 52, 9299–9310 CrossRef CAS.
- V. Jaacks, Makromol. Chem., 1972, 161, 161–172 CrossRef CAS.
- P. Dreier, R. Matthes, R. D. Barent, S. Schüttner, A. H. E. Müller and H. Frey, Macromol. Chem. Phys., 2022, 2200209 Search PubMed.
- B. F. Lee, M. Wolffs, K. T. Delaney, J. K. Sprafke, F. A. Leibfarth, C. J. Hawker and N. A. Lynd, Macromolecules, 2012, 45, 3722–3731 CrossRef CAS PubMed.
- T. Kurotu, Polym. J., 1986, 18, 859–864 CrossRef CAS.
- (a) G. Stokes, Trans. Cambridge Philos. Soc., 1856, 9, 5 Search PubMed; (b) A. Einstein, Ann. Phys., 1905, 17, 549–560 CrossRef CAS.
- C. H. Cho, J. Urquidi, S. Singh and G. W. Robinson, J. Phys. Chem. B, 1999, 103, 1991–1994 CrossRef CAS.
- (a) M. Weinhart, I. Grunwald, M. Wyszogrodzka, L. Gaetjen, A. Hartwig and R. Haag, Chem. – Asian J., 2010, 5, 1992–2000 CrossRef CAS PubMed; (b) M. Weinhart, T. Becherer and R. Haag, Chem. Commun., 2011, 47, 1553–1555 RSC.
Footnote |
| † Electronic supplementary information (ESI) available. See DOI: https://doi.org/10.1039/d3py00064h |
| This journal is © The Royal Society of Chemistry 2023 |


