 Open Access Article
Selective recognition of neurotransmitters in aqueous solution by hydroxyphenyl aza-scorpiand ligands†
Begoña
Verdejo
 *a,
Mario
Inclán
 a,
Salvador
Blasco
a,
Rafael
Ballesteros-Garrido
a,
Salvador
Blasco
a,
Rafael
Ballesteros-Garrido
 b,
Matteo
Savastano
 c,
Antonio
Bianchi
 *c and
Enrique
García-España
 *a
*a
aInstituto de Ciencia Molecular, C/Catedrático José Beltrán 2, 46980 Paterna, Valencia, Spain. E-mail: begona.verdejo@uv.es
bDepartamento de Química Orgánica, Universidad de Valencia, C/Dr Moliner 50, 46100 Burjassot, Valencia, Spain
cDipartimento di Chimica “Ugo Schiff” Via della Lastruccia, 3-13, 50019 Sesto Fiorentino, Italy
First published on 19th June 2023
Abstract
The synthesis, acid–base behaviour and anion recognition of neurotransmitters (dopamine, tyramine and serotonin) in aqueous solution of different aza-scorpiand ligands functionalized with hydroxyphenyl and phenyl moieties (L1–L3 and L4, respectively) have been studied by potentiometry, NMR, UV-Vis and fluorescence spectroscopy and isothermal titration calorimetry (ITC). The analysis of the potentiometric results shows the selective recognition of serotonin at physiological pH (Keff = 8.64 × 10⁴) by L1. This selectivity has an entropic origin probably coming from a fine pre-organization of the interacting partners. Thus, the complementarity of the receptor and the substrate allows the reciprocal formation of hydrogen bonds, π–π and cation–π interactions, stabilizing the receptors and slowing the rate of oxidative degradation, and satisfactory results are obtained at acidic and neutral pH values. NMR and molecular dynamics studies reveal the rotation blockage in the neurotransmitter side chain once complexed with L1.
Introduction
Serotonin, derived from the essential amino acid tryptophan,1 is a biogenic monoamine that acts as a neurotransmitter in the central nervous system (CNS), being related to a wide range of biological functions (hypertension, embryogenesis, psychotic behaviour and growth of tumour and non-tumour cells).2–7 Oxidative degradation of this neurotransmitter can contribute seriously to neuronal deterioration, so oxidative stress can act as a risk factor for the initiation and progression of neurodegenerative diseases (see Fig. 1).8 Additionally, metabolites and intermediate autoxidation products can contribute significantly to neuronal degradation. In this sense, low molecular weight receptors can be used to control the oxidative deterioration of neurotransmitters, eventually interrupting the chain of degradative reactions resulting in the formation of neurotoxic metabolites.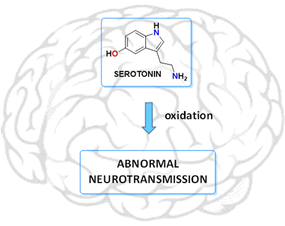 | ||
| Fig. 1 Oxidation processes of serotonin should be considered as a possible trigger of neurodegenerative diseases. | ||
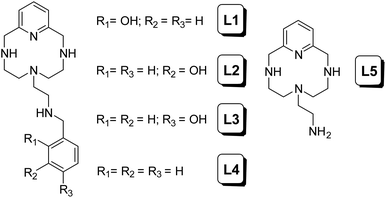
During the last few years, some of us have focused our research on the development of different polyazamacrocycles with antioxidant activity.9 On the basis of these types of receptors and their antioxidant properties, herein we report some new ligands of this series functionalized with hydroxyphenyl groups (L1–L4 in Chart 1). It is well known that due to the presence of these phenolic groups in their structures, many natural and synthetic compounds show improved antioxidant capacity compared to other compounds lacking such groups.10
Thus, in this paper, we have analysed the synthesis, acid–base behaviour and anion recognition of three different neurotransmitters (i.e. dopamine, tyramine and serotonin, see Chart 2) in aqueous solution of these ligands in order to analyse how the presence or absence of the hydroxyl group at different positions influences the interaction with the selected neurotransmitters, preventing their oxidation processes.
Results and discussion
Acid–base behaviour
Table 1 shows the stepwise protonation constants of L1–L4 determined in 0.15 mol dm−3 NaCl at 298.1 K along with those previously reported for the parent compound L5.11 The distribution diagrams of L1–L4 are shown in Fig. S1.† For the purpose of the discussion of the speciation, the term L refers to the fully deprotonated species including the phenol groups.| Reactiona | L1 | L2 | L3 | L4 | L5 |
|---|---|---|---|---|---|
| a Charges are omitted. b Values in parenthesis are standard deviations in the last significant figure. | |||||
| H + L ⇆ HL | 9.93(1)b | 10.12(2) | 10.153(9) | 10.006(4) | 10.338(9) |
| H + HL ⇆ H2L | 9.11(1) | 9.50(1) | 9.473(9) | 8.746(3) | 9.395(9) |
| H + H2L ⇆ H3L | 7.92(1) | 8.52(2) | 8.516(8) | 7.368(4) | 8.23(1) |
| H + H3L ⇆ H4L | 6.76(2) | 7.29(2) | 7.341(9) | — | — |
log![[thin space (1/6-em)]](https://www.rsc.org/images/entities/char_2009.gif) β β |
33.72 | 35.45 | 35.48 | 26.12 | 27.96 |
Receptors L1–L3 present in the pH range of study (2.5–11) four stepwise protonation constants. Therefore, the first three values obtained can be related to the protonation of phenolate oxygen and the secondary amino groups of the macrocyclic cavity. However, none of these pKs can be unambiguously assigned to the protonation of the hydroxyl group. The fourth one, with a lower value, corresponds to the protonation of the amino group of the pendant arm in accordance with the results for other aza-scorpiand ligands previously reported.11,12 As expected, L4 only shows three stepwise protonation constants, of which the second and third present lower values than the corresponding ones of L1–L3 and L5, probably due to the hydrophobic environment generated by the benzene moiety.13 Trends of ligand protonation constants are supported by thermodynamic data obtained for ligand protonation by means of isothermal titration calorimetry (ITC). Sample data for L1 and L4 are shown in Table 2, while the data for all ligands are shown in Table S5.† Indeed, the ITC study showed that the successive protonation of all ligands is accompanied by invariably favourable enthalpy changes, while the entropic contributions become less favourable with increasing ligand protonation and the consequent increasing solvation, according to a general behaviour observed for polyamines.14 Interestingly, the lower overall basicity of L4 than that of L1–L3 in the first three protonation steps is due to less favourable, or more unfavourable, entropy contributions (Tables 2 and S5†) which can be related to a larger gain in hydrophilic character (and consequent stronger solvation, which is an entropically unfavourable process) experienced upon protonation by the more hydrophobic L4 ligand.
| Reactiona | log![[thin space (1/6-em)]](https://www.rsc.org/images/entities/char_2009.gif) Kb Kb |
ΔG°![[thin space (1/6-em)]](https://www.rsc.org/images/entities/char_2009.gif) b (kJ mol−1) b (kJ mol−1) |
ΔH°![[thin space (1/6-em)]](https://www.rsc.org/images/entities/char_2009.gif) c (kJ mol–1) c (kJ mol–1) |
TΔS°![[thin space (1/6-em)]](https://www.rsc.org/images/entities/char_2009.gif) d (kJ mol–1) d (kJ mol–1) |
|---|---|---|---|---|
| a Charges are omitted. b Obtained by means of potentiometric measurements. c Obtained by means of ITC. d Obtained from ΔG° = ΔH° − ΔS°. e Values in parenthesis are standard deviations in the last significant figure. | ||||
| L1 | ||||
| H + L ⇆ HL | 9.93(1)e | −56.66(6) | −39.02(5) | 17.6(1) |
| HL + H ⇆ H2L | 9.11(1) | −51.98(6) | −40.6(1) | 11.4(2) |
| H2L + H ⇆ H3L | 7.92(1) | −45.19(6) | −43.1(1) | 2.1(2) |
| H3L + H ⇆ H4L | 6.76(1) | −38.57(6) | −38.5(1) | 0.1(2) |
| L4 | ||||
| H + L ⇆ HL | 10.006(4) | −57.09(2) | −40.4(2) | 16.7(2) |
| HL + H ⇆ H2L | 8.746(3) | −49.90(2) | −48.4(2) | 1.5(2) |
| H2L + H ⇆ H3L | 7.368(4) | −42.04(2) | −46.6(2) | −4.6(2) |
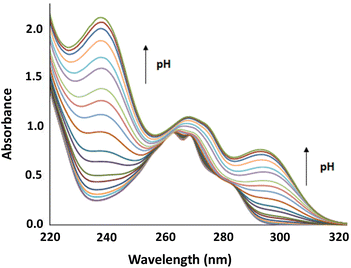
A detailed analysis of the UV-Vis spectra of L1–L3 shows the auxochromic effect associated with the deprotonation of the phenolic moiety in the pendant arm, increasing the λmax (red shift) from 270 nm (phenol) to 290 nm (phenolate). Furthermore, the bathochromic shift and the absorbance increase observed can be related to the conformational change induced in the structure of the receptor in a similar way to those observed for other aza scorpiand polyaminic ligands previously reported.11,12
In order to confirm the experimental data obtained through potentiometric and UV-Vis measurements, an exhaustive analysis of 1H NMR data has been done for L1 (Table 3). These types of experiments can provide indications of the protonation sequence followed by polyamine ligands since it is well-known that upon protonation the hydrogen nuclei bound to the α-carbon with respect to the nitrogen atoms undergoing the deprotonation processes are those that experience the largest upfield shifts.14
![[thin space (1/6-em)]](https://www.rsc.org/images/entities/char_2009.gif) β) obtained from NMR and UV-Vis data compared with the ones calculated from potentiometry
β) obtained from NMR and UV-Vis data compared with the ones calculated from potentiometry
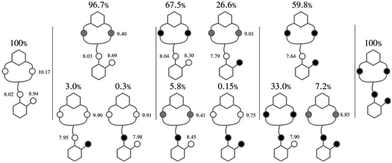
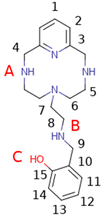
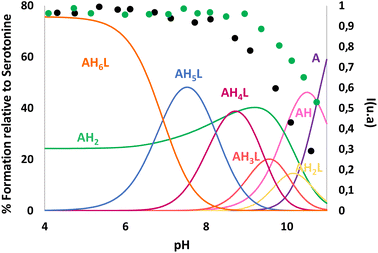
The obtained NMR data were fitted with GEMS (GEneral Microspeciation Solver, software which implements cluster expansion techniques and symmetry simplification),15 obtaining the microspeciation scheme shown in Fig. 4. L1 has three possible protonation sites available: A, B and C (for site labelling, see Fig. 5). The first proton goes to site A which is probably shared between the two equivalent sites providing additional stability to this first protonation. This is in agreement with the fact that the microconstant for site A goes from 10.17 to 9.90 when the other A site is occupied. The microspecies HAL accounts for 96.7% of the total macrospecies HL+. The species HAL should be properly labelled as HAL+/− since it is a zwitterionic species. The subsequent protonations are more difficult to pinpoint because the microconstant values involved are similar to each other giving as a result a complicated mixture of microspecies. This can also be seen in the variation of all the chemical shift values, both 1H and 13C, with pH which is at all times a soft-slope transition along the whole pH range as well as in the behaviour of the UV-Vis spectra (see Fig. 2 and 3). The second proton is divided between sites A and C, with the major species being HA2L2+/− (67.5%) and HAHBL2+/− (26.6%). The fact that sites B and C get protonated after both A sites suggests that an intramolecular hydrogen bond between B and C makes the protonation on either site less likely because the hydrogen bond must break. In the third protonation step, the proton goes either to B or C. Since there is probably a proton shared between these two sites, the microspecies HA2HBL2+ and HA2HCL2+ are indistinguishable. Both microspecies combined account for 93% of the total. This is also in agreement with the UV-Vis spectra (Fig. 3) where the largest change happens between the second and the third proton. In the fourth protonation step, all sites are occupied.
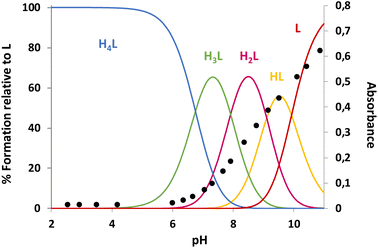 | ||
| Fig. 3 The distribution diagram for L1 overlapped with UV-Vis data for 295 nm. Determined in 0.15 mol dm−3 NaCl at 298.1 ± 0.1 K with [L1] = 10−4 mol dm−3. | ||
Recognition of neurotransmitters
The equilibrium constants for the interaction of the protonated forms of L1–L4 with different neurotransmitters (dopamine, serotonin and tyramine) were determined by means of pH-metric titrations in 0.15 mol dm−3 NaCl solutions at 298.1 K. Analysis of the titration curves using the Hyperquad program afforded the equilibrium constants for the general reaction (1):| LX + An− + mH+⇄HmLA(m−n+x)+ | (1) |
| Reactiona | Dopamine | Serotonin | Tyramine |
|---|---|---|---|
| a Charges are omitted. b Values in parenthesis are standard deviations in the last significant figure. | |||
| HA + HL ⇆ AH2L | 3.37(8)b | 4.14(2) | 3.13(3) |
| H2A + HL ⇆ AH3L | 3.76(2) | 4.23(1) | 3.67(2) |
| H2A + H2L ⇆ AH4L | 4.13(3) | 4.60(1) | 3.49(2) |
| H3A + H2L ⇆ AH5L | 3.98(3) | — | — |
| H2A + H3L ⇆ AH5L | — | 4.93(2) | 3.59(3) |
| H3A + H3L ⇆ AH6L | 4.01(3) | — | — |
| H2A + H4L ⇆ AH6L | — | 5.11(3) | 3.64(5) |
| H3A + H4L ⇆ AH7L | 3.95(7) | — | — |
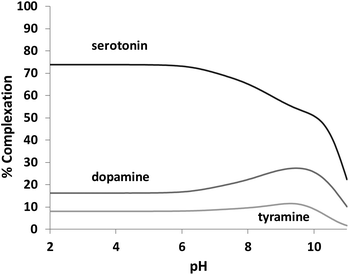
L1 forms adduct species [HxLA](x −2) in the pH range of study (2–11), with x varying from 2 to 7 for dopamine, and 2 to 6 for serotonin and tyramine. It is remarkable that a high percentage of formation is observed for L1–serotonin adducts, prevailing in solution until pH 10, with values of the stepwise formation constants in the range of ca. 4–5 logarithmic units. To better understand the different behavior of L1vs. neurotransmitters, the stability constant values reported in Table 4 can be used to calculate the percentage of complexed neurotransmitter per mole of ligand in a hypothetical equimolar mixture, showing the selective recognition of serotonin at physiological pH (see Fig. 6).
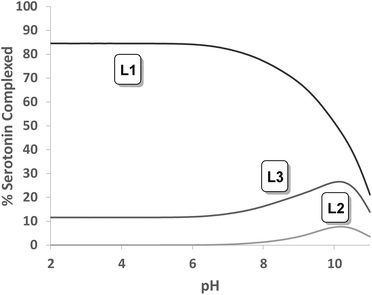
Tables S1, S2 and S3† show the stability constant values obtained for all ligands with the three neurotransmitters. A comparison of the equilibrium information shown in these tables reinforces the selectivity of L1vs. the rest of the ligands for serotonin. It is remarkable that in the case of L4, the presence of a benzene instead of the phenolic moiety produces a notable overall decrease in the interaction associated with the absence of the hydroxyl group. In this sense, Fig. 7 shows the percentage of complexed serotonin in an equimolar mixture with L1–L3, supposing no mixed adducts are formed. The best results are obtained at acidic and neutral pH values. Thus, the high affinity of L1 for serotonin could be related to the presence of an ortho-hydroxyl group in the phenolic moiety that allows the reciprocal formation of non-covalent interactions between the receptor and the substrate.
The relevant role played by the position of the hydroxyl group in the structure of the ligands L1–L3 is revealed when an analogous comparison is made with L2 and L3. In fact, L2 with a meta-hydroxyl group in the pendant arm presents a higher affinity for tyramine. However, no significant differences have been observed in the percentage of complexed neurotransmitters for L3.
In order to elucidate the conformation of the serotonin–ligand adduct, different experiments were performed. Due to the presence of the indole ring in its structure, serotonin is a molecule particularly well-suited for the spectroscopic detection of molecular reorganizations in solution. In contrast to tryptamine, an analogous compound without the hydroxyl group whose fluorescence increases with the deprotonation of its amine group, the fluorescence intensity of free serotonin shows strong fluorescence quenching above pH 9 related to the deprotonation of the hydroxyl group.16–18 However, in the case of complexed serotonin, this quenching occurs at lower pH values (see Fig. 8). This fact suggests that the negative charge generated after the deprotonation of this group could be stabilized through complexation with L1.
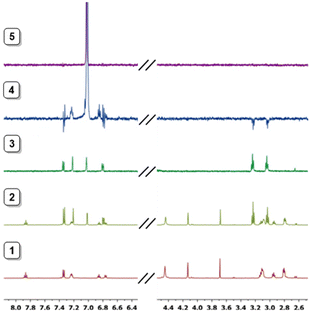
The greatest utility of the NOE lies in the fact that through its measurement it can be evaluated how close two or more nuclei are in a molecule. After the irradiation of a specific proton, and depending on the distance, only the signals that have suffered the NOE appear, that is, those that are physically close to the irradiated one. Thus, upon irradiation of the signal H4 (7.01 ppm) belonging to serotonin complexed with L1 at physiological pH, the methylene protons of the side chain of the neurotransmitter (3.23 and 3.03 ppm, signals H10 and H11, respectively) gave NOE indicating that these protons are closest to it. This effect can be associated with the steric hindrance to free rotation in the neurotransmitter side chain once complexed. In fact, for free serotonin, these NOE's are not observed due to the free rotation of the side chain (see Fig. 9 and 10)
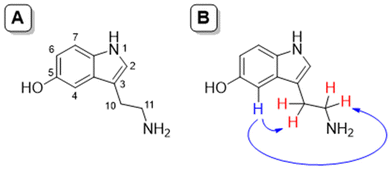 | ||
| Fig. 9 NOE studies. (A) Numbering of serotonin; (B) observed NOE signals in serotonin upon irradiation of H4 for the complex L1 and serotonin at physiological pH. | ||
In order to complement the NMR studies and have a better insight into the possible conformation of the supramolecular adduct formed, molecular dynamics calculations were performed between cationic serotonin (protonated at the terminal amino group) and L1 (zwitterion, with one of the macrocyclic amines protonated and the phenol deprotonated). The results show that the adduct is stable and both molecules stay close to each other during the 3 ns simulation, at 300 K, with an average distance of 4.9 Å between their centres of mass. It should be noted that no restrictions at all were used for the simulation. The trajectories were then analysed to extract the minimum energy conformer, as shown in Fig. 11. The supramolecular adduct is held together mainly by hydrogen bond interactions, between the charged ammonium group of serotonin and the pyridine nitrogen of L1 (cyan dashed lines), as well as two π-stacking interactions: a parallel-displaced π-stacking between the pyridine and indole rings (3.8 Å between centroids and 3.5 Å as the minimum distance) and a perpendicular T-shaped interaction between the indole and phenol rings (3.1 Å between serotonin H2 and the phenol centroid).
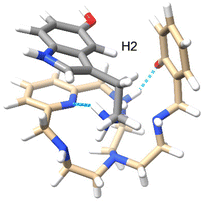 | ||
| Fig. 11 Minimum energy conformer calculated for the interaction between serotonin (grey) and L1 at 300 K. | ||
The trajectories were also analysed in an effort to rationalize the intramolecular NOE peak that has been detected for serotonin in the presence of L1. In Fig. 12 we present the variation of the distance, throughout the 3 ns simulation, between the two protons involved in the NOE, for both the free and bound neurotransmitters. In the case of the free serotonin molecule (Fig. 12A) it was observed that the aminoethyl chain rotates preferentially to an anti-conformation where the separation of both protons is maximum, at about 4 Å, which is the upper limit for the detection of a NOE in a small molecule. However, in the bound molecule (Fig. 12B) the rotation of the aminoethyl chain is hindered by the interaction and both protons stay preferentially in the eclipsed conformation, with a separation below 2.5 Å, which might explain why the NOE is only detected in the presence of the receptor.
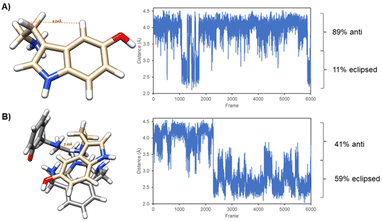 | ||
| Fig. 12 Minimum energy conformers and distance between the serotonin protons H4 and H10 throughout the 3 ns molecular dynamics simulation. | ||
The formation of amino acid complexes with L1–L4 was also studied by means of isothermal titration calorimetry in 0.15 mol dm−3 NaCl, at 298.1 K, to obtain the enthalpy changes and derived entropic terms. Sample data are reported in Table 5 for the formation of serotonin complexes with L1, while the data for the entire set of complexation reactions are shown in Table S5.† Unfortunately, this type of study was not possible with dopamine, due to oxidation processes associated with this neurotransmitter. As can be seen in these tables, complexation reactions are invariably endothermic and promoted by favourable entropy changes. The enthalpy changes result from a subtle combination of favourable and unfavourable contributions deriving from the formation of weak bonds between the interacting partners (favourable) and desolvation effects (unfavourable) associated with the interaction of species with opposite charge,19,20 the latter evidently prevailing over the former. Nevertheless, the favourable entropic contribution caused by the release of solvent molecules occurring upon charge neutralization is large enough to overcome the loss of entropy due to the substrate–receptor association and to overcompensate for the enthalpy loss, discussed above, due to complex desolvation. All in all, these thermodynamic data are strongly indicative of complexation reactions largely influenced by solvation/desolvation processes which, despite being characterized by large enthalpy and entropy contributions, are subject to marked enthalpy–entropy compensation that ultimately leads to complexes of moderate stability. In the case of complexes of serotonin with L1 (Table 5), the favourable entropy contributions appear to exceed the enthalpy loss more than in any other case (Table S5†) giving rise to the prominent affinity of L1 for serotonin discussed above. This extra entropy contribution is probably due to a better preorganization of L1 and serotonin to interact with each other in a complexation process that requires less loss of degrees of freedom.
| L1 + serotonin | ||||
|---|---|---|---|---|
| Reactiona | log![[thin space (1/6-em)]](https://www.rsc.org/images/entities/char_2009.gif) Kb Kb |
ΔG°![[thin space (1/6-em)]](https://www.rsc.org/images/entities/char_2009.gif) b (kJ mol−1) b (kJ mol−1) |
ΔH°![[thin space (1/6-em)]](https://www.rsc.org/images/entities/char_2009.gif) c (kJ mol−1) c (kJ mol−1) |
TΔS°![[thin space (1/6-em)]](https://www.rsc.org/images/entities/char_2009.gif) d (kJ mol−1) d (kJ mol−1) |
| a Charges are omitted. b Obtained by means of potentiometric measurements. c Obtained by means of ITC. d Obtained from ΔG° = ΔH° − TΔS°. e Values in parenthesis are standard deviations in the last significant figure. | ||||
| HA + HL ⇆ HA(HL) | 4.14(2)e | −23.6(1) | 20.9(4) | 44.5(5) |
| H2A + HL ⇆ H2A(HL) | 4.23(1) | −24.14(6) | 18.5(4) | 42.6(5) |
| H2A + H2L ⇆ H2A(H2L) | 4.60(2) | −26.2(1) | 16.0(4) | 42.2(5) |
| H2A + H3L ⇆ H2A(H3L) | 4.94(2) | −28.2(1) | 14.6(4) | 42.8(5) |
| H2A + H4L ⇆ H2A(H4L) | 5.14(3) | −29.3(2) | 7.9(4) | 37.2(6) |
Conclusions
In conclusion, the systems here presented provide means for discriminating between different neurotransmitters (dopamine, tyramine, and serotonin) through non-covalent interactions with functionalized aza-scorpiand-like ligands, containing phenolic moieties in the attached pendant arm. Interaction of these neurotransmitters with receptors L1–L4 has been analysed by potentiometry, NMR and calorimetric techniques and clearly differentiated behaviours have been observed. The high affinity of L1 for serotonin has an entropic nature and could be related to the presence of the ortho-hydroxyl group in the pendant arm that allows the reciprocal formation of non-covalent interactions between the receptor and the substrate. NMR and molecular dynamic studies reveal the rotation blockage in the neurotransmitter side chain once it is complexed with the aza-scorpiand ligand.Experimental section
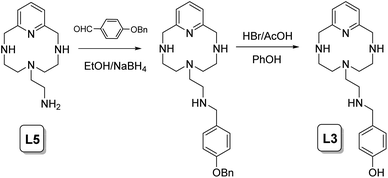
The syntheses of the ligands L1–L4 have been carried out following a general procedure described in the literature for the preparation of analogous receptors, which consists of the reaction of the polyamine 6-(2-aminoethyl)-3,6,9-triaza-1(2,6)-pyridinacyclodecaphane (L5) with the corresponding carboxaldehyde in dry ethanol followed by in situ reaction with sodium borohydride.11 Later, when a benzoylated carboxaldehyde was used, a deprotection methodology was employed to remove the benzyl group to give the L1–L3 products as hydrobromide salts (Scheme 1).Synthesis of L1–L3
6-(2-Aminoethyl)-3,6,9-triaza-1(2,6)-pyridinacyclodecaphane (2.41 mmol) and the corresponding benzyloxybenzaldehyde (2.41 mmol) were dissolved in 100 mL of dry ethanol and stirred at room temperature for 2 h. Then, sodium borohydride (24.1 mmol) was added, and the stirring was continued for further 2 h. Then, the solution was vacuum evaporated and extracted with CH2Cl2/H2O. The organic phase was dried and dissolved in dry ethanol. The hydrochloride salt of the product was precipitated by adding a concentrated hydrochloric acid solution. This intermediate product and 42.64 mmol of phenol were dissolved in 41.37 mL of 33% HBr/HAc. The mixture was heated at 90 °C with stirring for 48 h. After cooling, the solution was vacuum evaporated and the product obtained was treated with an excess of acetone. After leaving the solution to stand for 3 h, a light brown color precipitate was obtained. The excess solvent was removed and washed again with acetone and dried to give the pure product as a hydrobromide salt.Synthesis of L4
EMF measurements
Potentiometric titrations were carried out at 298.1 ± 0.1 K using 0.15 mol dm−3 NaCl as the supporting electrolyte. The experimental details (burette, potentiometer, cell, stirrer, microcomputer, etc.) have been fully described elsewhere.21 Acquisition of the emf data was performed with the computer program PASAT.22,23 The reference electrode used was a Ag/AgCl electrode in saturated KCl solution. The glass electrode was calibrated as a hydrogen-ion concentration probe by titration of previously standardized amounts of HCl with CO2-free NaOH solutions and the equivalent point determined by Gran's method,24 which gives the standard potential, E′°, and the ionic product of water (pKw = 13.73(1)).The computer program HYPERQUAD was used to calculate the protonation and stability constants.25 The pH range investigated was 2.5–11.0 and the concentration of the neurotransmitters and the ligands ranged from 1 × 10⁻³ to 5 × 10⁻³ mol dm−3 with an A![[thin space (1/6-em)]](https://www.rsc.org/images/entities/char_2009.gif) :
:![[thin space (1/6-em)]](https://www.rsc.org/images/entities/char_2009.gif) L molar ratio of 1
L molar ratio of 1![[thin space (1/6-em)]](https://www.rsc.org/images/entities/char_2009.gif) :
:![[thin space (1/6-em)]](https://www.rsc.org/images/entities/char_2009.gif) 1. The different titration curves for each system (at least two) were treated either as a single set or as separate curves without significant variations in the values of the stability constants. Finally, the sets of data were merged together and treated simultaneously to give the final stability constants.
1. The different titration curves for each system (at least two) were treated either as a single set or as separate curves without significant variations in the values of the stability constants. Finally, the sets of data were merged together and treated simultaneously to give the final stability constants.
NMR measurements
Different 1H and 13C NMR spectra were recorded using Bruker Avance 300, Bruker AV-400 and Bruker Neo500 spectrometers. The chemical shifts are given in parts per million referenced to the solvent signal and were referenced with 3-(trimethylsilyl) propionic-2,2,3,3-d4 acid sodium salt. Adjustments to the desired pH were made using drops of DCl or NaOD solutions. The pD was calculated from the measured pH values using the correlation, pH = pD − 0.4.261H and 13C chemical shifts for L1 were fitted using a least-squares algorithm (GEMS)15 which implements cluster expansion techniques27 and symmetry simplification.28 In a similar manner, the aforementioned algorithm has also been tuned for the fitting of spectroscopic data.
Spectrophotometric and spectrofluorimetric titrations
Absorption spectra were recorded using a Shimadzu UV-2501 PC spectrophotometer. Fluorescence spectra were obtained with a PTI MO-5020 spectrofluorimeter. The emission spectra were measured from 300 to 500 nm at an excitation wavelength of 260 nm, corresponding to the maximum of the excitation intensity. HCl and NaOH were used to adjust the pH values that were measured with a Metrohm 713 pH meter in both cases.Molecular dynamics studies
Molecular dynamics simulations were carried out using Amber 2019 and GAFF potentials at 300 K.29 The process comprised a heating stage, until a final temperature of 300 K is reached, after which the simulation was done. A 3 ns molecular dynamics simulation was performed. Five minimum energy conformers were extracted from the trajectories and minimized. No restraint at all was used in these studies. Files with trajectories in the AMBER format and GAFF potentials at 300 K are available on request.Isothermal titration calorimetry (ITC)
Reaction enthalpies (ligand, neurotransmitter protonation enthalpies and complexation enthalpies) were determined in a 0.15 mol dm−3 NaCl solution using a TAM III (TA Instrument) microcalorimeter equipped with a precision Lund syringe pump coupled with a 0.500 cm3 gas-tight Hamilton syringe according to a procedure already described.30 At least two titrations were performed for each system. Corrections for the heats of dilution were applied. The computer program HypCal (updated version of HypΔH)31 was used to calculate reaction enthalpies from calorimetric data. This program allows either simultaneous calculation of reaction enthalpies and related equilibrium constants or calculation of reaction enthalpies only using independently determined equilibrium constants. We adopted the second procedure: equilibrium constants were fixed at the values determined by potentiometric titrations while reaction enthalpies were refined. Entropic contributions were calculated from determined equilibrium constants and enthalpy changes according to the equation –RT![[thin space (1/6-em)]](https://www.rsc.org/images/entities/char_2009.gif) ln
ln![[thin space (1/6-em)]](https://www.rsc.org/images/entities/char_2009.gif) K = ΔH° − TΔS°.
K = ΔH° − TΔS°.
Conflicts of interest
There are no conflicts to declare.Acknowledgements
Financial support from the Spanish Ministerio de Economía y Competitividad (Projects CTQ2017-90852-REDC, RED2018-102331-T, PID 2019-110751RD-I00) and the Conselleria de Innovación, Universidades, Ciencia y Sociedad Digital of the Generalitat Valenciana (PROMETEO Grant CIPROM/2021/030) is acknowledged. This contribution is also based upon work from COST Action CA18202, NECTAR – Network for Equilibria and Chemical Thermodynamics Advanced Research, supported by COST (European Cooperation in Science and Technology). M. I. thanks the Generalitat Valenciana and the European Social Fund for the postdoc funding APOSTD/2020/065References
- J. Veenstra-VanderWeele, G. M. Anderson and E. H. Cook, Eur. J. Pharmacol., 2000, 410, 165–181 CrossRef CAS PubMed.
- M. M. Rapport, A. A. Green and I. H. Page, J. Biol. Chem., 1948, 176, 1243–1251 CrossRef CAS PubMed.
- T. Fukumoto, P. I. Kema and M. Levin, Curr. Biol., 2005, 15, 794–803 CrossRef CAS PubMed.
- G. A. Buznikov, H. W. Lambert and M. Lauder, Cell Tissue Res., 2001, 305, 177–186 CrossRef CAS PubMed.
- J. Marino and J. Caballero, Ann. Pharmacother., 2010, 44, 863–870 CrossRef CAS PubMed.
- D. Julius, T. J. Livelli, T. M. Jessel and R. Axel, Science, 1989, 244, 1057–1062 CrossRef CAS PubMed.
- E. J. Siddiqui, C. S. Thompson, D. P. Mikhailidis and F. H. Mumtaz, Oncol. Rep., 2005, 14, 1593–1597 CAS.
- M. Z. Wrona and G. Dryhurst, Chem. Res. Toxicol., 1998, 11, 639–650 Search PubMed.
- E. García-España, M. P. Clares, S. Blasco, C. Soriano, J. González and B. Verdejo, WO2011/033163A2, 2011.
- (a) H. Palafox-Carlos, J. F. Ayala-Zavala and G. A. González-Aguilar, J. Food Sci., 2011, 76, R6–R15 CrossRef CAS PubMed; (b) S. S. Pekkarinen, H. Stöckmann, K. Schwarz, I. M. Heinonen and A. I. Hopia, J. Agric. Food Chem., 1999, 47, 3036–3043 CrossRef CAS PubMed.
- B. Verdejo, A. Ferrer, S. Blasco, C. E. Castillo, J. González, J. Latorre, M. A. Mañez, M. G. Basallote, C. Soriano and E. García-España, Inorg. Chem., 2007, 46, 5707–5719 CrossRef CAS PubMed.
- M. Inclán, M. T. Albelda, J. C. Frías, S. Blasco, B. Verdejo, C. Serena, C. Salat-Canela, M. L. Díaz, A. García-España and E. García-España, J. Am. Chem. Soc., 2012, 134, 9644–9656 CrossRef PubMed.
- (a) F. Pina, M. A. Bernardo and E. García-España, Eur. J. Inorg. Chem., 2000, 2143–2157 CrossRef CAS; (b) M. A. Bernardo, J.-A. Guerrero, E. García-España, S. V. Luis, J. M. Llinares, F. Pina, J. A. Ramírez and C. Soriano, J. Chem. Soc., Perkin Trans. 2 (1972-1999), 1996, 2335–2342 RSC.
- M. Micheloni, P. Paoletti and A. Vacca, J. Chem. Soc., Perkin Trans. 2 (1972-1999), 1978, 945–947 RSC.
- S. Blasco, M. Inclan, B. Verdejo and E. Garcia-España, Chemom. Intell. Lab. Syst., 2022, 231, 104672 CrossRef CAS.
- M. R. Eftink, J. Jia, D. Hu and C. A. Ghiron, J. Phys. Chem., 1995, 99, 5713–5723 CrossRef CAS.
- (a) A. Chattopadhyay, R. Rukmini and S. Mukherjee, Biophys. J., 1996, 71, 1952–1960 CrossRef CAS PubMed; (b) J. P. W. Nosoongnoen, G.-A. Guérin, S. Loric, M. Conti, J.-M. Launay and P. Manivet, Chem. Phys. Lett., 2006, 420, 538–544 CrossRef.
- G. A. Hernández-Mendoza, D. Aguirre-Olivas, M. González-Gutiérrez, H. J. Leal, N. Qureshi, C. G. Treviño-Palacios, J. Peón and F. F. De-Miguel, Biomed. Opt. Express, 2020, 11, 1432–1448 CrossRef PubMed.
- (a) Anion Coordination Chemistry, ed. K. Bowman-James, A. Bianchi and E. García-España, Wiley-VCH, Verlag GmbH& Co., Weinheim, Germany, 2012 Search PubMed J. W. Steed and J. L. Atwood, Supramolecular Chemistry, Wiley-VCH, 2nd edn, 2009 Search PubMed; J. L. Sessler, P. A. Gale and W. S. Cho, Anion Receptor Chemistry, Royal Society of Chemistry, Cambridge, 2006 Search PubMed (b) Supramolecular Chemistry of Anions, ed. A. Bianchi, K. Bowman-James and E. García-España, Wiley-VCH Verlag, GmbH, New York, 1997 Search PubMed.
- A. Bencini, A. Bianchi, M. I. Burguete, E. Garcia-España, S. V. Luis and J. A. Ramirez, J. Am. Chem. Soc., 1992, 114, 1919–1920 CrossRef CAS.
- E. García-España, M.-J. Ballester, F. Lloret, J. M. Moratal, J. Faus and A. Bianchi, J. Chem. Soc., Dalton Trans. (1972-1999), 1988, 101–104 RSC.
- M. Fontanelli and M. Micheloni, Proceedings of the I Spanish-Italian Congress on Thermodynamics of Metal Complexes, Peñíscola, Castellón, 1990. Program for the automatic control of the microburette and the acquisition of the electromotive force readings Search PubMed.
- M. Savastano, M. Fiaschi, G. Ferraro, P. Gratteri, P. Mariani, A. Bianchi and C. Bazzicalupi, Molecules, 2020, 25, 1355 CrossRef CAS PubMed.
- (a) G. Gran, Analyst, 1952, 77, 661–671 RSC; (b) F. J. Rossotti and H. Rossotti, J. Chem. Educ., 1965, 42, 375–378 CrossRef CAS.
- P. Gans, A. Sabatini and A. Vacca, Talanta, 1996, 43, 1739–1753 CrossRef CAS PubMed.
- (a) P. K. Glasoe and F. A. Long, J. Phys. Chem., 1960, 64, 188–190 CrossRef CAS; (b) A. K. Covington, M. Paabo, R. A. Robinson and R. G. Bates, Anal. Chem., 1968, 40, 700–706 CrossRef CAS.
- (a) M. Borkovec and G. J. M. Koper, Anal. Chem., 2000, 72, 3272–3279 CrossRef CAS PubMed; (b) M. Borkovec, M. Brynda, G. J. M. Koper and B. Spiess, Chimia, 2002, 56, 695–701 CrossRef CAS.
- Z. Szakács and B. Noszál, J. Math. Chem., 1999, 26, 139–155 CrossRef.
- D. A. Case, I. Y. Ben-Shalom, S. R. Brozell, D. S. Cerutti, T. E. Cheatham III, V. W. D. Cruzeiro, T. A. Darden, R. E. Duke, D. Ghoreishi, G. Giambasu, T. Giese, M. K. Gilson, H. Gohlke, A. W. Goetz, D. Greene, R. Harris, N. Homeyer, Y. Huang, S. Izadi, A. Kovalenko, R. Krasny, T. Kurtzman, T. S. Lee, S. LeGrand, P. Li, C. Lin, J. Liu, T. Luchko, R. Luo, V. Man, D. J. Mermelstein, K. M. Merz, Y. Miao, G. Monard, C. Nguyen, H. Nguyen, A. Onufriev, F. Pan, R. Qi, D. R. Roe, A. Roitberg, C. Sagui, S. Schott-Verdugo, J. Shen, C. L. Simmerling, J. Smith, J. Swails, R. C. Walker, J. Wang, H. Wei, L. Wilson, R. M. Wolf, X. Wu, L. Xiao, Y. Xiong, D. M. York and P. A. Kollman, AMBER 2019, University of California, San Francisco Search PubMed.
- Á. Martínez-Camarena, M. Savastano, J. M. Llinares, B. Verdejo, A. Bianchi, E. García-España and C. Bazzicalupi, Inorg. Chem. Front., 2020, 7, 4239–4255 RSC.
- P. Gans, A. Sabatini and A. Vacca, J. Solution Chem., 2008, 37, 467–476 CrossRef CAS.
Footnote |
| † Electronic supplementary information (ESI) available. See DOI: https://doi.org/10.1039/d3ob00562c |
| This journal is © The Royal Society of Chemistry 2023 |

