
 Open Access Article
 This Open Access Article is licensed under a
 Creative Commons Attribution 3.0 Unported Licence
Phasor-FLIM-guided unraveling of ATRA supramolecular organization in liposomal nanoformulations†
Mario
Bernardi
 a,
Michael
Vernizzi
b,
Laura
Baraldi
c,
Sandor
Balog
d,
Irene
Bassanetti
b,
Elisa
Sgarbi
b,
Luca
Fornasari
b,
Chiara
Arrigoni
b and
Francesco
Cardarelli
*a
a,
Michael
Vernizzi
b,
Laura
Baraldi
c,
Sandor
Balog
d,
Irene
Bassanetti
b,
Elisa
Sgarbi
b,
Luca
Fornasari
b,
Chiara
Arrigoni
b and
Francesco
Cardarelli
*a
aLaboratorio NEST, Scuola Normale Superiore, Pisa, Italy. E-mail: francesco.cardarelli@sns.it
bChiesi Farmaceutici S.p.A., Parma, Italy
cDipartimento di Scienze Chimiche, della Vita e della Sostenibilità Ambientale, Università di Parma, 43124 Parma, Italy
dAdolphe Merkle Institute, University of Fribourg, Chemin des Verdiers 4, 1700 Fribourg, Switzerland
First published on 22nd November 2023
Abstract
Here we use fluorescence lifetime imaging microscopy (FLIM) to study the supramolecular organization of nanoencapsulated liposomal all-trans retinoic acid (ATRA), exploiting ATRA's intrinsic fluorescence as a source of signal and phasor transformation as a fit-free analytical approach to lifetime data. Our non-invasive method is suitable for checking for the presence of a fraction of ATRA molecules interacting with liposomal membranes. The results are validated by independent small-angle X-ray scattering (SAXS) and nano-differential scanning calorimetry (NanoDSC) measurements, probing ATRA's putative position on the membrane and effect on membrane organization. Besides the insights on the specific case-study proposed, the present results confirm the effectiveness of Phasor-FLIM analysis in elucidating the nanoscale supramolecular organization of fluorescent drugs in pharmaceutical formulations. This underscores the importance of leveraging advanced imaging techniques to deepen our understanding and optimize drugs’ performance in delivery applications.
Retinoids are part of the family of polyisoprenols and are structurally related to vitamin A,1 or retinol. They are involved in the regulation of cell proliferation and differentiation, immune function, bone tissue growth, and tumor-suppressor gene expression.2,3 As such, they are attracting growing interest as potential therapeutic agents for the treatment of different dermatological conditions such as skin cancers, inflammatory skin disorders, photoaging, psoriasis, and acne.4–6 Unfortunately, however, the use of retinoids has been challenged by their extreme lability, especially if exposed to oxygen, acidic environments, and light.1 To tackle this issue, retinoids have been encapsulated using a number of different strategies, e.g. by complexation with proteins, films, liposomes, micelles, and inorganic and polymeric nanoparticles.7,8 Protection of retinoids against the external environment led to promising results, in terms of efficacy, in the treatment of various diseases, including cancer.9–11 Despite the progress made in in vitro and in vivo applications, scarce information has been collected thus far on the synthetic identity of encapsulated retinoids in terms of the physical state of the encapsulated drug. Based on a recently patented12 and validated13 procedure, here we employ fluorescence lifetime imaging microscopy (FLIM) to study the supramolecular organization of nanoencapsulated liposomal ATRA with phosphatidylcholine (PC), cholesterol and DSPE-PEG2000. By exploiting ATRA's intrinsic fluorescence as source of signal, we performed phasor transformation as a fit-free analytical approach to lifetime data. For each pixel in the image, the measured lifetime decay is converted into a point in the “phasor plot”: the distribution of phasor points originating from FLIM measurements appears on the universal circle for mono-exponential decays, or inside the circle for multi-exponential decays. Phasor positions are typically estimated using cumulative phasors from multiple replicas, following established procedures.14–16
The law of phasor addition, originally presented by Gregorio Weber,17 helps identify the origin of multiexponential points in the phasor plot. In brief: if two molecular species are coexisting in the same pixel, for instance, all the possible weighting combinations of the two molecular species give phasors distributed along a straight line joining the characteristic phasors of the two pure species. In the case of three molecular species, the phasor-FLIM signal lies in a triangle where the vertices correspond to the characteristic phasors of the pure species, and so on. Thus, given an experimental phasor that is the combination of two (or more) species, and the phasors of the isolated pure components, a graphical solution can be derived as described previously by others.16,18,19
We resorted to customized codes20 to measure the phasors (see Table 1) of the two putative pure species expected to be present in the manufactured formulation: ATRA in its precipitated form and ATRA dissolved in a solution (obtained by using DMSO21,22) shown in Fig. 1A and B. Both pure species yield short characteristic lifetime values, appearing close to the bottom-right corner of the universal semi-circle.
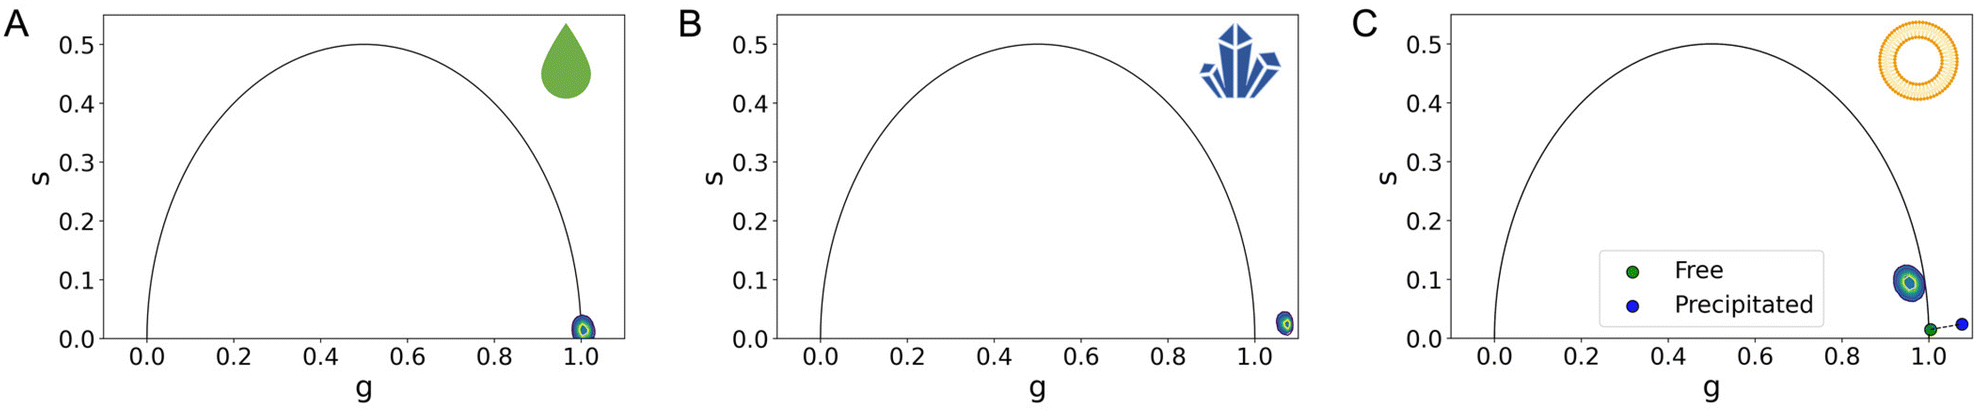 | ||
| Fig. 1 FLIM analysis of pure species and liposomal formulation. The phasor plot's x and y axes are referred to as ‘g’ and ‘s’, representing the real and imaginary components of the FLIM signal after Fourier transformation. (A) Examination of the phasor plot for the characteristic lifetime cumulative phasor of free ATRA reveals a monoexponential signal for a phasor lying on the universal circle. (B) However, when looking at the characteristic lifetime cumulative phasor of the precipitated ATRA, despite its theoretical monoexponential nature, it deviates from the universal circle due to the presence of excimers in the precipitated state. (C) As for the characteristic lifetime cumulative phasors of liposomal nano formulations, specifically Lipo ATRA 1, a multi-exponential behavior is presented, residing within the universal circle as a result of a combination of various physical states. Interestingly, it appears that the signal is not a mere combination of precipitated (blue phasor) and free-in-solution (green phasor) ATRA, as it doesn't fall on the segment connecting these phasors. (Note: N = 3; errors in ‘g’ and ‘s’ coordinates are detailed in Table 1, as they are too small to be visually appreciated.) | ||
| Sample | g | g std | s | s std | N |
|---|---|---|---|---|---|
| ATRA free | 1.004 | 0.005 | 0.014 | 0.005 | 3 |
| ATRA precipitated | 1.073 | 0.002 | 0.020 | 0.003 | 3 |
| Lipo ATRA 1 | 0.933 | 0.012 | 0.072 | 0.011 | 3 |
| Lipo ATRA 2 | 0.648 | 0.017 | 0.232 | 0.012 | 3 |
| ATRA + PC + Chol liposome | 0.873 | 0.020 | 0.149 | 0.016 | 3 |
| ATRA + PC + Chol isolated membrane | 0.510 | 0.024 | 0.383 | 0.010 | 3 |
Worthy of note, in Fig. 1B and Table 1, the phasor of the precipitated ATRA lies outside of the universal circle, likely due to the presence of excimers in the powder.18,23 In Fig. 1C, considering the cumulative phasor of liposomal ATRA, we are prompted to speculate that a longer characteristic lifetime could be the result of a supramolecular organization that prevents the excited state of ATRA from relaxing as fast as it would do in solution or in the precipitated state. This in turn is reminiscent of what has been observed in similar conditions for other nanoencapsulated drugs. For both liposomal doxorubicin and irinotecan, a long-lifetime contribution was observed and assigned to the drugs putatively interacting with the liposome membrane.13,19,24 Here, for the first time, the FLIM-guided identification of a putative drug species interacting with the liposome membrane is validated by independent proof.
To this end, SAXS was employed as means to probe semi-quantitatively the presence of the drug in proximity to the lipid bilayer of liposomal ATRA. Following the experimental acquisition, custom-made codes20,25 were employed to reduce and analyze the spectra. The data were subjected to background subtraction (PBS buffer) and edited to remove the noisy q-range, selecting only the q-range of 0.06–2.5 (1 nm−1). Fig. 2A displays the scattering patterns of liposome placebo and liposome ATRA after background subtraction across the full q-range. Notably, a rather noisy segment is discernible beyond 2.5 (1 nm−1). Moreover, it's worth noting that although the intensity of the liposome placebo scattering pattern is slightly higher than that of liposome ATRA (possibly due to small differences in lipid concentration), the shapes of the scattering patterns differ from each other. This divergence allows for a more in-depth analysis of the bilayer structure. Indeed, the reduced data were analyzed according to Brzustowicz et al.26 to estimate the electron density profile of the bilayer of the liposome. The bilayer is considered asymmetric, and its head–tail–tail–head center is set as the center of the profile. This procedure was applied to both samples, i.e., the unloaded and the drug-loaded liposomes. The estimation was achieved by minimizing residual least squares through the parametric nonlinear regression of the sum of three Gaussian functions presented by Brzustowicz et al.,26 using the logarithms of the data pairs. As reported in Fig. 2B, comparison between the two samples reveals noticeable differences (the raw fit is provided in Fig. S1†). The electron density profile of the bilayer is reported in terms of real distance (nm) and electron density difference relative to the mean value (δ, with dimensions of 1 per unit). The thickness of the membrane bilayer, estimated to be around 5 nm, is represented by the profile's width. The varying amplitudes of the Gaussians reflect the contrast between lipids in the bilayer and the medium (PBS buffer). The electron density of the phospholipid heads, rich in electrons compared to the water-based medium, gives rise to positive amplitudes of the outer Gaussians. Conversely, the Gaussian displays a negative amplitude when the electron density of the medium is subtracted from the electron density of the tails, composed of aliphatic chains. In the liposome loaded with ATRA, there is an increase in the electron-density contrast in both the phospholipid heads and tails regions.
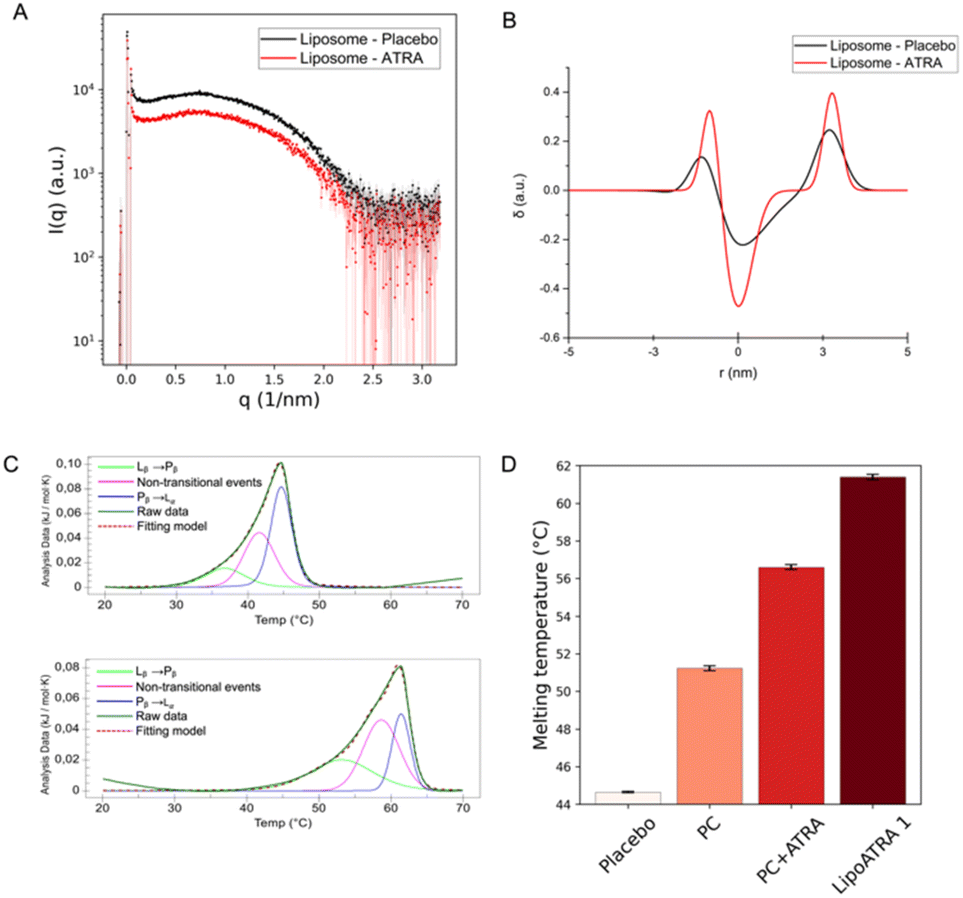 | ||
| Fig. 2 SAXS and nanoDSC validation of ATRA interaction with the lipidic membrane. (A) SAXS patterns of liposome placebo (black) and ATRA-loaded liposomes (red) were obtained after background subtraction across the full q-range. Beyond 2.5 (1 nm−1), a noisy range of points can be observed which is expected when q increases. (B) Electron density profile of the bilayer of placebo liposomes (black line) and ATRA-loaded liposomes (red line): the three Gaussian curves reported in the graphs represent the head–tail–tail–head arrangement of the bilayer in the liposome. (C) Deconvoluted thermogram of placebo and ATRA-loaded liposomes. (D) Melting temperature (Tm) and standard deviation extrapolated from the thermograms of placebo, phosphatidylcholine, phosphatidylcholine + ATRA and liposomal formulation LipoATRA 1. | ||
This strongly suggests that, when encapsulated, a significant fraction of ATRA is embedded into the phospholipid bilayer. Based on the SAXS data, inference on the putative orientation of ATRA within the membrane can be attempted. As ATRA possesses a hydrophilic carboxylic-acid residue on one side of the molecular structure and a more hydrophobic moiety on the opposite side, it is reasonable to assume that ATRA orients itself with the carboxylic residue towards the hydrophilic heads of the phospholipids, and the hydrophobic heads in contact with the lipid tails. In keeping with this hypothesis, the electron-rich carboxylic head might be responsible for the enhancement of contrast in the outer Gaussians. Conversely, the less electron-rich aliphatic moiety might be contributing to the negative contrast in the inner Gaussian. Ultimately, the electron density profile of the bilayer significantly increases if ATRA is present inside the liposome. When ATRA is effectively embedded into the lipid bilayer, an influence on the membrane organization is expected. To verify this possibility, differential scanning calorimetry experiments (NanoDSC) were carried out. The heating of liposomes in DSC results in the appearance of endothermic events in the thermogram, which can be associated with non-covalent processes such as changes in the packaging of alkyl chains. The liposomes undergo temperature-driven phase transitions, showcasing their ability to form a phospholipid bilayer that can be considered as lyotropic liquid crystals with mesomorphic phase transitions between different liquid crystalline phases.27 Generally, the low-temperature Lβ phase is referred to as the ‘gel phase’, while the high-temperature Lα phase is referred to as the ‘liquid-crystal phase’ (and is often described as ‘gel to liquid-crystalline’ transition). In addition, an intermediate Pβ phase, also known as the “rippled” phase, is characterized by the undulation of Lβ-phase bilayers accompanied by a certain loss of the liquid crystalline order.28–30 The transition from Pβ to Lα is referred to as the pre-transition; the transition to the liquid phase is considered to be the dominant one.31,32 Different phospholipids have different transition temperatures (Tm). Four samples were analyzed: PC, PC with ATRA, the placebo formulation, and Lipo ATRA 1. All these formulations were prepared in PBS buffer. The first step was to perform a baseline scan by injecting buffer into both the sample and reference cells. Then, each sample was evaluated and compared to the others upon baseline subtraction. The thermograms of the four samples were deconvoluted using the NanoAnalyze software. Three Voigt models were utilized, leading to an accurate curve fit (RMSE < 0.002) in Fig. 2C. The existence of three curves under each peak indicates that three distinct processes occur while heating the liposomal formulation. The first and third events can be attributed to the pre-transition and main transition of the liposome, respectively. The second event may be due to the presence of a crack phase,33,34 or to the effects of lamellarity or varying size in the liposomal population.35 It is worth noting that the three events have different FWHM (full width at half maxima) which correspond to the ΔTm1/2 of each peak. This means that the three processes have different degrees of cooperativity, with the main transition being the most cooperative. We compared different formulations in pairs, including PC versus placebo, PC versus PC + ATRA, and placebo versus Lipo ATRA 1, to gain insights into the changing behavior of the PC transition in the presence of different components added to the formulation. Typically, incorporating excipients or active principles into pure liposomes results in a decrease in intensity, a broadening of the peak, a drop in Tm, and a reduction of ΔH (enthalpy change), which suggest an increase in membrane disorder. The broadening of the DSC peaks is related to disrupting the membrane structure, increasing packing disorder, and significantly reducing the cooperativity of the phase transition.36 Comparing PC and placebo, a significant decrease in Tm was observed in Fig. 2D, as expected. However, a slightly higher ΔH may be due to the larger dimensions of the placebo, higher CN (cooperativity number), and lower ΔTm1/2 (see Table S1†). Then we compared the formulation with and without active principles. Adding ATRA resulted in more consistent behavior for all the parameters except Tm. When comparing PC vs. PC + ATRA (see Fig. S2†) and then placebo vs. Lip oATRA 1, we observed lower ΔH, higher ΔTm1/2 and lower CN as reported in Table S1.† Additionally, we also observed an increase in Tm. Our hypothesis is that due to the lipophilic structure and nature of ATRA, there is a strong hydrophobic interaction between the active principle and the lipophilic components (alkyl chains) of the phospholipid bilayer. Although this strong interaction results in less cooperativity, it increases the stability of the formulation and leads to a higher Tm. Additionally, in Fig. 2D, we noticed that the increase in Tm is much higher when ATRA is added to the placebo, indicating that the interaction between ATRA and PC is favored by the presence of other components such as cholesterol and DSPE-PEG in the formulation. Prompted by the independent validation obtained by SAXS and NanoDSC, we resorted to FLIM once again and extended the screening to a different liposomal formulation of ATRA, namely the Lipo ATRA 2 formulation of Table S2,† where DSPE-PEG2000 was replaced with DOTAP. The region of the phasor plot delimited by the two dashed lines and the red-colored portion of the semicircle in Fig. 3A illustrate the broad spectrum of lifetimes eligible for the putative pure species of ATRA interacting with lipids, based on data from Lipo ATRA 1 and pure free and precipitated ATRA.
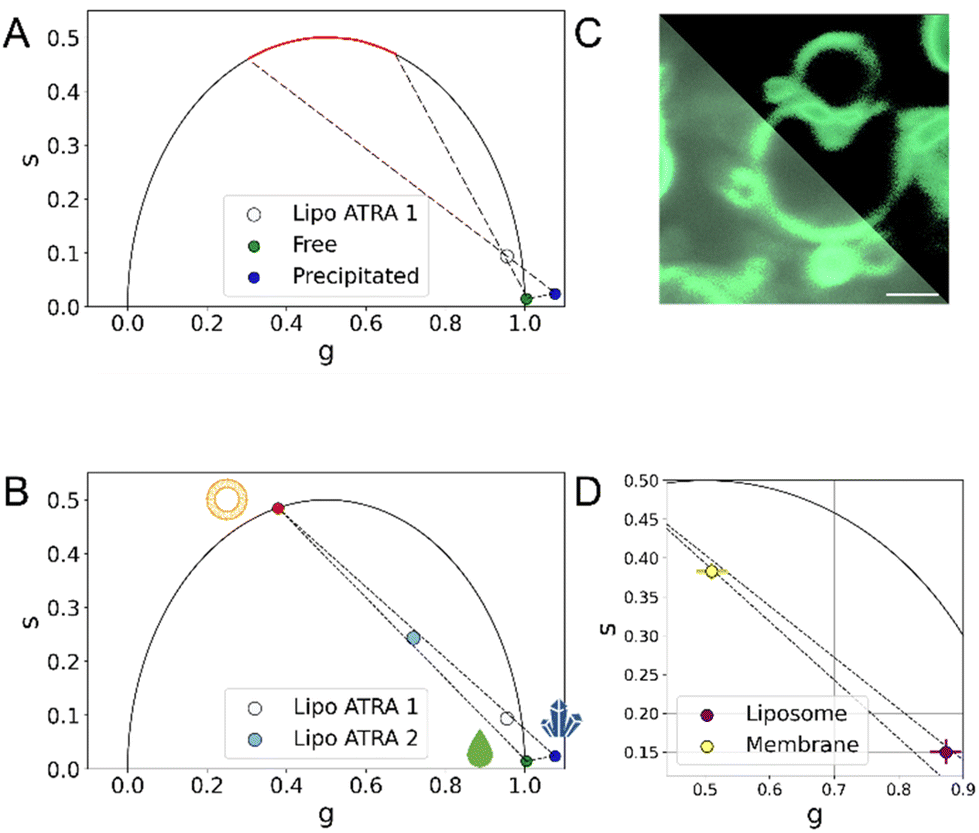 | ||
| Fig. 3 FLIM identification of the ATRA-lipid interaction (A) in the phasor plot, the red semicircle highlights the expected location of the putative third species describing the FLIM signal, supposedly membrane-bound ATRA. This assumption holds true as encapsulated ATRA results in a combination of more than two distinct physical states. (B) Additional FLIM screening of LipoATRA 2 (cyan dot) allows better definition of the region of interest and extrapolation of the putative position of a pure species of ATRA interacting with lipids (red dot). It becomes evident that combinations of these physical states are sufficient to comprehensively describe the composition of nanoformulations and distinguish their manufacture. (C) Confocal imaging LipoATRA1 liposomes after extrusion, spinning and washing to remove excess ATRA, with and without an intensity threshold (upper-right and lower-left, respectively; scale bar 5 μm): in these conditions the contribution from membrane-bound ATRA is maximized (D) The phasor FLIM signal of ATRA in isolated membranes made from PC and cholesterol is a combination of membrane-bound and free-in-solution physical states validating the assumptions made on the third physical state. (Note: N = 3; errors in ‘g’ and ‘s’ coordinates are detailed in Table 1, as they are too small to be visually appreciated.) | ||
Of note, by incorporating LipoATRA 2 into the analysis, the region of interest gets further restricted: data interpolation, in fact, identifies a reliable position in the phasor plot of a putative membrane-bound species (red dot in Fig. 3B). Exploiting the newly formed three-species framework, the fractional-intensity contribution of the membrane-bound species in each formulation could be estimated, and resulted in increased passing from LipoATRA 1 (∼10%) to LipoATRA 2, so the fractional intensity contribution of ATRA bound to membranes was maximized (∼51.68%). We examined the liposomal membrane in more detail using confocal microscopy of an extruded LipoATRA 1 liposome upon spinning and extensive washing of the sample to remove excess ATRA (Fig. 3C). As shown in Fig. 3C (lower-left panel), being an amphipathic molecule, ATRA is in a natural dynamic equilibrium between the free-in-solution state (both outside and inside liposomes) and the membrane-associated state, this latter being better appreciated by applying an intensity threshold to the image (Fig. 3C, upper-right panel). Interestingly, the phasor-FLIM signature of such sample is substantially shifted towards the putative membrane-bound pure species, aligns well with the interpolation of LipoATRA 1 and 2 data (dashed lines in Fig. 3D; see also Fig. S3†), and is physically substantiated by the combination of SAXS and nanoDSC findings. This validation confirms the identity of ATRA's third physical state within liposomes. In Fig. S4,† our FLIM testing of non-lipsomal nanoformulations revealed our ability to identify the scenario where ATRA exists solely in the precipitated state. Moreover, we discovered additional non-liposomal interactions that cannot be fully explained by the reference phasor plot depicting free, precipitated, and membrane-bound ATRA.
In conclusion, Phasor-FLIM provided valuable insights into the presence of a supramolecular organization of encapsulated ATRA interacting with lipids through a label-free analysis, exploiting ATRA's intrinsic fluorescence. While thermodynamic principles might suggest the interaction of an amphipathic molecule with a membrane, it's not evident that the available quantitative or semi-quantitative methods can effectively investigate this interaction. In the specific case of retinoids, previous attempts were based only on molecular dynamics simulations37 or invasive centrifugation-based experimental assays.38 Moreover, there's no guarantee that the manufacturer's formulation protocol facilitates drug interaction within the nanoparticles’ interior. A clear example of this, as recently revealed by FLIM analysis,13,39 is liposomal doxorubicin: because of the active-loading protocol used by the manufacturer, the drug is mostly in a precipitated semi-crystalline form and interacts with the membrane much less than it would do based on its amphipathic properties. It should be noted that previous FLIM-based case reports on encapsulated drugs (doxorubicin13 and irinotecan24) lacked a convincing experimental validation of FLIM sensitivity to drug–membrane interaction, which is instead provided here by independent SAXS- and nanoDSC-based analyses. Finally, compared to previous studies, here FLIM demonstrates exquisite sensitivity to probing differences in the membrane-interaction capabilities of a compound which depend on membrane composition and on experimental conditions in general. Such sensitivity, not obvious for other methods, shall now open a path to extensive and non-invasive quantitative screening of drug formulations to resolve properties such as synthetic identity, biological identity and stability.
Author contributions
Investigation: M. B., M. V., L. B., S. B., L. F., C. A.; formal analysis: M. B., M. V., L. B., S. B., L. F., C. A.; methodology: M. B., F. C.; software: M. B.; conceptualization: M. B., I. B., E. S., F. C.; writing – original draft: M. B., M. V., L. B., F. C.; writing – review & editing: M. B., I. B., E. S., F. C.; supervision: I. B., E. S., F. C.Conflicts of interest
There are no conflicts to declare.Acknowledgements
The authors acknowledge the support of the European Union by the Next Generation EU project ECS00000017 ‘Ecosistema dell'Innovazione’ Tuscany Health Ecosystem (THE, PNRR, Spoke 4: Nanotechnologies for diagnosis and therapy). This work has been supported by the Open Access Publishing Fund of the Scuola Normale Superiore.References
- E. Trapasso, D. Cosco, C. Celia, M. Fresta and D. Paolino, Expert Opin. Drug Delivery, 2009, 6, 465–483 CrossRef CAS PubMed.
- R. K. Sodhi and N. Singh, Pharmacol., Biochem. Behav., 2014, 120, 117–123 CrossRef CAS PubMed.
- G. Duester, Cell, 2008, 134, 921–931 CrossRef CAS PubMed.
- A. Thielitz, A. Krautheim and H. Gollnick, Dermatol. Ther., 2006, 19, 272–279 CrossRef PubMed.
- P. C. M. van de Kerkhof, Dermatol. Ther., 2006, 19, 252–263 CrossRef PubMed.
- M. Lens and L. Medenica, Expert Opin. Pharmacother., 2008, 9, 1363–1374 CrossRef CAS PubMed.
- R. Ferreira, J. Napoli, T. Enver, L. Bernardino and L. Ferreira, Nat. Commun., 2020, 11, 4265 CrossRef CAS PubMed.
- Ž. Temova Rakuša, P. Škufca, A. Kristl and R. Roškar, J. Cosmet. Dermatol., 2021, 20, 2350–2358 CrossRef PubMed.
- Y. Jin, S. S. Teh, H. L. N. Lau, J. Xiao and S. H. Mah, Am. J. Cancer Res., 2022, 12, 938–960 CAS.
- Y. Zhang, J. Zhao, J. Sun, L. Huang and Q. Li, Exp. Ther. Med., 2018, 16, 4639–4649 CAS.
- M. C. Cristiano, D. Cosco, C. Celia, A. Tudose, R. Mare, D. Paolino and M. Fresta, Colloids Surf., B, 2017, 150, 408–416 CrossRef CAS PubMed.
- F. Cardarelli, F. Beltram, P. M. Tentori, G. Caracciolo and D. Pozzi, WO Patent. WO2022097108A1, 2022 Search PubMed.
- P. Tentori, G. Signore, A. Camposeo, A. Carretta, G. Ferri, P. Pingue, S. Luin, D. Pozzi, E. Gratton, F. Beltram, G. Caracciolo and F. Cardarelli, Nanoscale, 2022, 14, 8901–8905 RSC.
- A. Vallmitjana, B. Torrado, A. Dvornikov, S. Ranjit and E. Gratton, J. Phys. Chem. B, 2020, 124, 10126–10137 CrossRef CAS PubMed.
- M. A. Digman, V. R. Caiolfa, M. Zamai and E. Gratton, Biophys. J., 2008, 94, L14–L16 CrossRef CAS PubMed.
- S. Ranjit, L. Malacrida, D. M. Jameson and E. Gratton, Nat. Protoc., 2018, 13, 1979–2004 CrossRef CAS PubMed.
- G. Weber, J. Phys. Chem., 1981, 85, 949–953 CrossRef CAS.
- L. Malacrida, S. Ranjit, D. Jameson and E. Gratton, Annu. Rev. Biophys., 2021, 50, 575–593 CrossRef CAS PubMed.
- M. Bernardi and F. Cardarelli, Biophys. J., 2023, 122, 278a CrossRef.
- M. Bernardi and F. Cardarelli, bioRxiv, 2023, DOI:10.1101/2023.08.30.555392.
- H. Morjani, A. Beljebbar, G. D. Sockalingum, T. A. Mattioli, D. Bonnier, H. Gronemeyer and M. Manfait, Biospectroscopy, 1998, 4, 297–302 CrossRef CAS.
- M. G. Vivas, J. P. Siqueira, D. L. Silva, L. de Boni and C. R. Mendonca, RSC Adv., 2015, 5, 74531–74538 RSC.
- L. Martelo, A. Fedorov and M. N. Berberan-Santos, J. Phys. Chem. B, 2015, 119, 15023–15029 CrossRef CAS PubMed.
- M. Bernardi, G. Signore, A. Moscardini, L. A. Pugliese, L. Pesce, F. Beltram and F. Cardarelli, ACS Appl. Bio Mater., 2023, 6, 4277–4289 CrossRef CAS PubMed.
- L. Baraldi, S. R. Alfarano, F. Sousa, R. Mezzenga, B. Rothen-Rutishaser, A. Fink and S. Balog, ChemRxiv, 2023, DOI:10.26434/chemrxiv-2023-nsbtp.
- M. R. Brzustowicz and A. T. Brunger, J. Appl. Crystallogr., 2005, 38, 126–131 CrossRef CAS.
- N. Kasian, O. Vashchenko, L. Budianska, R. Brodskii and L. Lisetski, J. Therm. Anal. Calorim., 2019, 136, 795–801 CrossRef CAS.
- C. Cametti, F. D. Luca, M. A. Macrì, B. Maraviglia and P. Sorio, Liq. Cryst., 1988, 3, 839–845 CrossRef CAS.
- J. Katsaras, S. Tristram-Nagle, Y. Liu, R. L. Headrick, E. Fontes, P. C. Mason and J. F. Nagle, Phys. Rev. E: Stat. Phys., Plasmas, Fluids, Relat. Interdiscip. Top., 2000, 61, 5668–5677 CrossRef CAS PubMed.
- D. C. Wack and W. W. Webb, Phys. Rev. A: At., Mol., Opt. Phys., 1989, 40, 2712–2730 CrossRef CAS PubMed.
- L. Viitala, S. Pajari, L. Gentile, J. Määttä, M. Gubitosi, J. Deska, M. Sammalkorpi, U. Olsson and L. Murtomäki, Langmuir, 2019, 35, 3999 CrossRef CAS PubMed.
- S. Leekumjorn and A. K. Sum, Biochim. Biophys. Acta, Biomembr., 2007, 1768, 354–365 CrossRef CAS PubMed.
- H.-L. Wu, Y. Tong, Q. Peng, N. Li and S. Ye, Phys. Chem. Chem. Phys., 2016, 18, 1411–1421 RSC.
- Z. V. Leonenko, E. Finot, H. Ma, T. E. S. Dahms and D. T. Cramb, Biophys. J., 2004, 86, 3783–3793 CrossRef CAS PubMed.
- J. Drazenovic, H. Wang, K. Roth, J. Zhang, S. Ahmed, Y. Chen, G. Bothun and S. L. Wunder, Biochim. Biophys. Acta, Biomembr., 2015, 1848, 532–543 CrossRef CAS PubMed.
- G. Neunert, J. Tomaszewska-Gras, A. Baj, M. Gauza-Włodarczyk, S. Witkowski and K. Polewski, Molecules, 2021, 26, 2851 CrossRef CAS PubMed.
- S. Radzin, A. Wiśniewska-Becker, M. Markiewicz, S. Bętkowski, J. Furso, J. Waresiak, J. Grolik, T. Sarna and A. M. Pawlak, Membranes, 2023, 13, 575 CrossRef CAS PubMed.
- S.-C. Lee, K.-E. Lee, J.-J. Kim and S.-H. Lim, J. Liposome Res., 2005, 15, 157–166 CrossRef CAS PubMed.
- A. Carretta and F. Cardarelli, J. Phys.: Conf. Ser., 2023, 2579, 012009 CrossRef.
Footnote |
| † Electronic supplementary information (ESI) available. See DOI: https://doi.org/10.1039/d3nr03420h |
| This journal is © The Royal Society of Chemistry 2023 |