Graphene oxide fiber microelectrodes with controlled sheet alignment for sensitive neurotransmitter detection†
Romana
Jarosova
,
Blaise J.
Ostertag
and
Ashley E.
Ross
 *
*
University of Cincinnati, Department of Chemistry, 312 College Dr, 404 Crosley Tower, Cincinnati, OH 45221-0172, USA. E-mail: Ashley.ross@uc.edu; Tel: +1 513-556-9314
First published on 1st September 2023
Abstract
Here, we synthesized and characterized graphene oxide (GO) fiber microelectrodes with controllable nanosheet orientation to study the extent to which sheet alignment and orientation impacts electrochemical detection of neurochemicals. The alignment of the GO nanosheets was characterized by scanning electron microscopy, Raman spectroscopy, and cyclic voltammetry. The electrochemical performance of GO microelectrodes and its suitability for subsecond detection of neurotransmitters was further evaluated by fast-scan cyclic voltammetry (FSCV). We have shown that the GO sheet alignment has a considerable effect on the electron transfer kinetics, frequency independent behavior, and detection suitability for specific neurotransmitters. Therefore, this fine-tuning aspect of the electrode surface for specific electrochemical detection should be taken into consideration for any future utilization of GO-based biological sensors.
1. Introduction
Understanding the extent to which the carbon chemical structure influences electrochemical detection is critical for designing tailor-made electrodes for ultrasensitive analyte detection. Neurotransmitters are a biological class of analytes often studied with electrochemical techniques due to their abundance in various biological samples and unique signaling properties. An electroanalytical technique often used to monitor neurotransmitters in biological samples, in real-time, is fast-scan cyclic voltammetry (FSCV).1–3 Traditionally, carbon-fiber microelectrodes (CFME) have been the prominent electrode material for neurotransmitter detection with FSCV;4 however, recent expansion to other analytes (e.g. purines and indolamines) has revealed a critical need for novel electrode materials that enable precise tailoring of the electrode surface to enhance sensitive and rapid detection. Many reports have modified carbon-fiber surfaces to improve detection;5–9 however, precise tailoring of carbon-fiber surfaces is difficult due to the amorphous heterogeneity of the surface. Recently, our lab has fabricated and characterized graphene oxide microelectrodes (GFMEs) for detection with FSCV.10 In comparison with traditional CFMEs, our GFMEs exhibited significant increase in electron transfer kinetics, redox cycling, fouling resistance, higher sensitivity, and frequency independent behavior. GO is a unique, two-dimensional carbon material derived from graphene by heavy oxidation. It has gained growing research interest due to its high electrical conductivity, excellent electrochemical stability, and homogeneity with a large specific surface area.11–14 Although GO has been heavily used for a variety of electrochemical applications and even expanded to FSCV detection,10,11,15–18 the extent to which the chemical structure of the graphene sheet impacts fundamental electrochemical properties is not well understood yet, perhaps due to insufficient control over the individual graphene sheet orientation and alignment. This knowledge is critical for advancing our understanding of specific analyte-electrode surface interactions. Here, we have developed and characterized edge-plane aligned GO microfibers to fundamentally advance our understanding of how graphene sheet orientation impacts neurochemical detection with FSCV.From a molecular level point-of-view, the graphene sheet consists of two regions with different structure: (i) the basal plane, consisting of conjugated sp2 hybridized carbon atoms, and characterized by an atomic flatness and low defect density; and (ii) the edge plane, that forms sp3 sites with a high level of defects and a variety of functional groups and dangling bonds.19,20 It is generally believed that the electrochemical properties of the basal and edge plane are significantly different,21 however, there has been an ongoing debate concerning the electrochemical activity at the basal and edge plane. The conventional consensus is that the electron transfer kinetics is significantly faster on the edge plane in comparison with the basal plane sites,22–24 while the opposite barrier of this debate provides evidence for fast electron transfer at pristine basal plane.25 Moreover, how these factors influence neurochemical detection, particularly at rapid scan rates, is still lacking due to the necessity of using microelectrodes with FSCV. To date, most studies analyzing the influence of basal vs. edge plane surfaces on electrochemical detection have used macroelectrodes like highly ordered pyrolytic graphite (HOPG) which are not amenable to FSCV detection due to the large capacitive currents obtained at macroelectrodes at scan rates consisting of hundreds of volts per second. Additionally, this prior fundamental understanding is not translatable to actual improved biological detection with FSCV because microelectrodes are also necessary for limiting tissue damage. Therefore, to address this existing knowledge gap in understanding how edge vs. basal planes influence subsecond neurochemical detection, the ability to develop microelectrodes with controlled surfaces is crucial.
The ability to control graphene sheet alignment is critical to the mechanical, electrical, and thermal properties of graphene-based electrodes. Previously, Yang et al.21 reported a correlation between molecular structure and interfacial properties of edge or basal plane modified GO. The effect of sp2 graphene sheets alignment on thermal properties and Young's modulus has been discussed elsewhere.26,27 Lastly, Xin et al.28 have reported controlled GO sheets alignment and orientation using a microfluidics device, and enabled the optimization of the microstructure and properties. Despite this work, developing aligned GO microfibers for electrochemical detection has not been investigated.
Here, we synthesized and characterized graphene microfibers with controllable sheet orientation to study the extent to which sheet alignment and orientation impacts electrochemical detection of neurochemicals with FSCV. This work addresses the persistent knowledge gap in the fundamental understanding of the electrochemical performance of neurochemicals at aligned GO. This work will provide a platform to tune the graphene fiber structure for optimal neurochemical detection which will significantly improve biological electrochemical detection.
2. Methods
2.1. Chemicals/reagents
All chemicals for preparation of Tris buffer (15 mM Tris, 1.25 mM NaH2PO4, 2.0 mM Na2SO4, 3.25 mM KCl, 140 mM NaCl, 1.2 mM CaCl2 dehydrate, and 1.2 mM MgCl2, adjusted to pH 7.4) were purchased from Fisher Scientific (Hampton, NH) and used as received. Dopamine, norepinephrine, adenosine, serotonin, and guanosine (Sigma-Aldrich, St Louis, MO, used as received) stock solution were prepared in 0.1 M hydrochloric acid and diluted daily with Tris buffer. All solutions were stored in a fridge at 4 °C when not in use. Ultrapure water (∼18.2 MΩ cm) was used for preparation of all aqueous solutions. Single-layer graphene oxide dispersion in water (10 mg ml−1) was purchased from ACS Material (Pasadena, CA). L-Ascorbic acid (99%) was purchased from Sigma Aldrich (St Louis, MO) and used as received.2.2. GO microfiber fabrication
A modified hydrothermal method was used to synthesize both aligned and misaligned GO microfibers.10 Briefly, a solution of 10 mg ml−1 GO dispersion in water was mixed with 1% (w/w) L-ascorbic acid and stirred for 10 min to allow proper homogenization. For microfibers with aligned GO sheets orientation, the GO–AA mixture was injected into a glass capillary tube (1 mm × 0.25 mm; A-M systems, Inc., Sequium, WA, USA) at a controlled rate of 0.01 ml min−1, using a 34 G microFil syringe (34 G × 67 mm, World Precision Instruments, Sarasota, FL, USA). For microfibers with misaligned GO sheets, the mixture was injected into a silica fused capillary tubing (ID 100 μm, OD 375 μm; Molex, Lisle, IL, USA) using a 28 G micro fill syringe (28 G × 10 mm, World Precision Instruments, Sarasota, FL, USA). Injection feed rate was 0.4 ml min−1. The misalignment was ensured by placing a piece of plastic tubing (∼1 cm long) between the microFil syringe and the silica fused capillary. Upon injection, both fiber molds were sealed using air-dry epoxy (J-B Weld 50112 ClearWeld Quick-Setting Epoxy Syringe – Clear) and placed in an oven at 80 °C for 2 hours. After 2 hours, the epoxy seal was removed, and the molds were placed in the oven for additional 24 hours to ensure complete dryness of the fibers inside of the molds. The fiber molds were then placed in isopropyl alcohol for 20 min, and the fibers were then gently extracted.2.3. Microelectrode fabrication
GO disk microelectrodes were fabricated as described previously.10 Briefly, graphene fibers were hand-inserted into a glass capillary (1.2 mm × 0.68 mm; A-M systems, Inc., Sequim, WA, USA), and pulled into 2 pieces with a vertical Narishige Electrode Puller (PE-22, Tokyo, Japan). GO fibers were cut to a near proximity to the glass seal, and sealed with a mixture of epoxy resin 828 and 1,3-phenylenediamine (14% w/w) heated at 85 °C. The excess epoxy was removed by quick (3 s) immersion in acetone, and the electrodes were than cured at 100 °C for 12 hours. Prior to measurements, electrodes were polished for 30 minutes at 45° using a fine diamond abrasive plate to create disk microelectrodes.2.4. Material characterization
The GO fiber morphology was examined using scanning electron microscopy (SEM) at the Advanced Materials Characterization Center at the University of Cincinnati using a Apreo scanning electron microscope (SEM, ThermoFisher Scientific, Waltham, MA, USA). An acceleration voltage of 5 kV was used, and the working distance was adjusted individually for each image for optimal quality. Raman spectroscopy was performed using a Renishaw inVia Reflex spectrometer (Guocestershire, UK), controlled by WiREInterface. Raman spectra were collected using a 633 nm Ar-ion laser, with a laser power of 10 mW, and an integration time of 10 s. Three spectral acquisition were collected at specific point, and the final Raman spectrum was generated from their average.2.5. Electrochemical detection methods
Cyclic voltammetry was performed using a CH Instruments electrochemical workstation (Model 620, Bee Cave, TX). A single-compartment electrochemical cell was used in a three-electrode configuration with GO microfiber working electrode, Pt wire counter electrode, and Ag/AgCl (3 mol L−1 KCl) reference electrode.Fast-scan cyclic voltammograms were collected using a Chem Clamp potentiostat (Dagan, Minneapolis, MN). HDCV software (Mark Wightman, University of North Carolina, Chapel Hill, NC) with data acquisition PCIe-6363 interface board (National Instruments, Austin, TX) was used to collect and analyze data. The traditional dopamine waveform (from −0.4 to 1.3 V and back to −0.4 V at 400 V s−1) was applied every 100 ms (10 Hz application frequency) was used for catecholamines. The waveform was extended to 1.45 V for purines and indolamines. The working electrode was equilibrated for 10 min prior measurements. All electrodes were tested in flow injection analysis setup up, consisting of a six-port actuator (Valco instruments, Houston, TX) and syringe pump (Model Fusion 100, Chemyx, Stafford, TX) set to a flow rate of 1 mL min−1. All experiments were performed at room temperature.
2.6. Statistics and graphics
Statistical analysis and graphical depictions were carried out using GraphPad Prism V. 9.0 (GraphPad Software Inc., La Jolla, CA, USA) and OriginPro Software V 2021 (OriginLab Crop., Northampton, MA, USA). Statistical p-values were significant at 95% confidence level (p < 0.05). Values are reported as the mean ± standard error of the mean (SEM), and n represents the number of electrodes. The Raman spectroscopy data were analyzed in Wire 4.4. (Renishaw, Wotton-under-Edge, United Kingdom) and Origin Pro 2020b.3. Results and discussion
3.1. Surface characterization of aligned and misaligned GO fibers
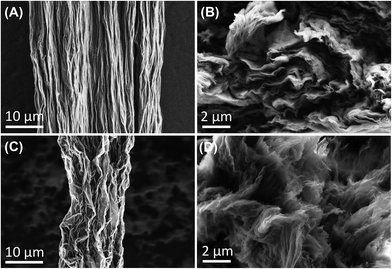
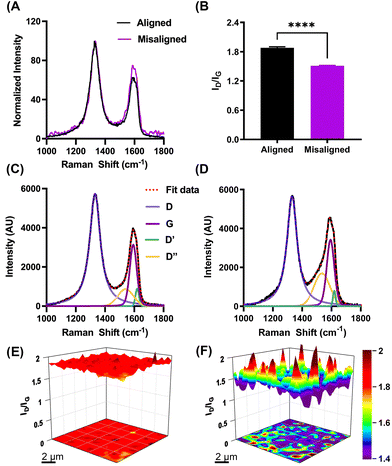
To understand the extent to which different fabrication processes affect the alignment of GO sheets, and consequent physical and electrochemical properties of the resultant GO fibers, characterization of the GO fibers was performed by SEM, Raman spectroscopy, tensile strength instrument, and traditional cyclic voltammetry. The lateral and cross-section morphology of aligned and misaligned GO microfibers was examined by SEM. Fig. 1A and B depicts high magnification SEM images of GO fibers. We hypothesize that during the fabrication process, the GO sheets were prompted by a shear force to align the graphene sheets along the flow direction. The slow feeding rate (0.01 ml min−1), and long nozzle (67 mm) enabled a longer orientation period, resulting in fibers with horizontally aligned GO nanosheets. Additionally, the orientation of the sheet was notably enhanced by the elongational flow occurring within a microtube featuring a contracted cross-section along the direction of flow, as previously described by Xin et al.28 The resulting fiber shows homogeneous structure along the fiber, and well-aligned graphene sheets observed on the cross-sectional view. In contrast, an increased crimped surface structure was observed for the fibers fabricated with the intention to create misaligned nanosheet fibers, as well as apparent distortion of the GO sheets on the cross-section profile (Fig. 1C and D, respectively). We attribute the heavily wrinkled fiber surface and distortion of the GO sheets to the utilization of a shorter nozzle length, as well as the increased feed rate (0.4 ml min−1), that collectively resulted in less time for the nanosheets to orient. Moreover, the addition of the plastic tubing inserted between the nozzle and the fiber mold ensured turbulent flow resulting in rapid misalignment of the GO nanosheets. These results are supported by prior work demonstrating that feed rate and geometry impacts the alignment of the GO sheet.13,28 Collectively, the SEM images demonstrate a difference in GO fibers nanostructure. Finally, it is important to note the difference in fiber size between the two fabrication processes. Although the two processes yield fibers with noticeably distinct dimensions (21.4 ± 2.7 and 12.9 ± 1.0 μm for aligned and misaligned GO fibers, respectively, n = 5), each process ensures consistent fiber size throughout its specific production method.The alignment of the GO sheets was further evaluated and confirmed by Raman spectroscopy. We hypothesized that the cross-section of the aligned fibers exposes the edge plane of the graphitic sheets, while the cross-section of the misaligned sheets exposes a mixture of both basal and edge plane. The spectra were collected at the tip of a freshly polished fiber (in order to analyze the exposed surface of the working disk electrode), and the obtained spectra were normalized to the intensity of the disorder (D) peak to highlight differences in the ratio of the intensity of D (ID) to the intensity of the graphitic peak, IG (ID/IG). A representative spectrum of both types of fibers are shown in Fig. 2. Four peaks are clearly identifiable for both fiber alignments, comprising the characteristic Raman spectra for graphene material. The G band (∼1580 cm−1) originates from sp2-hybridized carbon atoms. The strong and sharp D band centered at ∼1350 cm−1, along with a 2D band at ∼2700 cm−1, represents any defects or discontinuity that breaks the ideal periodicity of the graphitic lattice.29,30 The intensity ratio of the D and G bands is commonly used to evaluate the degree of defects in carbon-based materials. Furthermore, it is essential to account for two additional peaks, namely the D′ and D′′ bands, during the curve-fitting process.31,32 The D′ (∼1635 cm−1) band is attributed to the disorder-induced phonon mode due to crystal defects.33 The D′′ band (∼1550 cm−1) remains a topic of controversy, however, recent research indicates a significant correlation between the band and the oxygen content.34 Based on this understanding, peak fitting was employed, incorporating all four bands as depicted in Fig. 2C and D for both types of fibers. The Raman spectra analysis shows a significant microstructure difference between the fibers and confirmed our alignment hypothesis. The D/G intensity is 1.88 ± 0.01 (n = 5), and 1.51 ± 0.19 (n = 5) for aligned and misaligned GO fibers, respectively. These results demonstrate significant differences in the level of structural defects between both fibers. The higher ID/IG ratio further confirms the presence of edge planes at the cross section of the aligned GO fibers.
Our alignment hypothesis was supported by results obtained from Raman surface maps. Raman spectra were collected over an extended area of the electrode tip (10 × 10 μm, step size 0.2 μm), and the ID/IG values were evaluated from each spectrum measured at the specific point across the surface. The resulting Raman surface maps show uniform ID/IG values across the aligned electrode surface (Fig. 2E), confirming our hypothesis that GO sheets on the electrode cross-section are indeed aligned, and mostly edge plane sites are exposed. In contrast, the Raman map of the misaligned GO fiber (Fig. 2F) shows significant heterogeneity, confirming the presence of both basal and edge plane sites.
The alignment of the graphene sheets impacts the mechanical properties of the microfibers. The mechanical properties of carbon-based fibers have been investigated for decades to maximize the stretching (tensile) forces that can be exerted prior to breakage for various applications. Here, we performed tensile strength assessments on both edge-aligned and misaligned GO fibers to understand how GO sheet alignment impacts the tensile properties of GO-based fibers (Fig. S-1†). In the case of edge-aligned fibers, GO sheets are aligned parallel to the fiber's length, mitigating π–π electrostatic interactions against the fiber's length resulting in low tensile strength values of 19.3 ± 1.1 ksi. In misaligned GO fibers, the basal plane of the sheets is exposed in various orientations providing π–π electrostatic interactions in all directions generating a 2-fold increase in tensile strength, 37.8 ± 1.9 ksi, compared to edge-aligned GO fibers (unpaired t-test, p = 0.0011, n = 3 fibers). Although these values are much lower than traditional carbon fiber,35 this loss in mechanical properties are overcome by using glass capillary GO disk microelectrodes, with only a cross-sectional area exposed.
3.2. Electrochemical properties
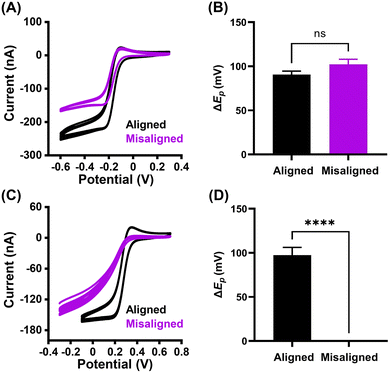
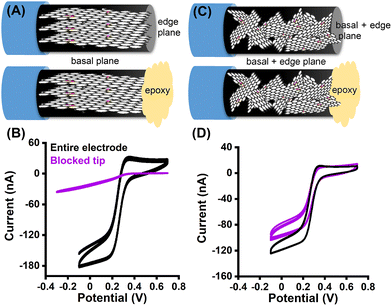
The electrochemical properties of both aligned and misaligned GO microelectrodes were evaluated using cyclic voltammetry (CV). The redox probes (Fe(CN)63−/4−, Ru(NH3)63+/2+) were chosen due to the differences in their electron transfer (ET) mechanism. The mechanism of ET for Fe(CN)63−/4− is inner-sphere in nature, and therefore sensitive to the surface microstructure and chemistry, as well as the electronic properties, and surface cleanliness.23,36–38 In contrast, the ET processes for Ru(NH3)63+/2+ are most sensitive to the electronic properties of the electrode material (i.e., density of electronic states), and insensitive to the electrode microstructure.37,39–43 Cyclic voltammograms for 5 mM Ru(NH3)63+/2+ in 1 M KCl (Fig. 3A) depicts well-defined oxidation and reduction peaks, and are similar in shape for both aligned and misaligned GO microelectrodes. The lower current observed for misaligned GO microelectrode reflects the smaller electrode area in comparison with the aligned GO electrode. Importantly, the peak splitting (ΔEp), reflecting the density of electronic states of both electrodes, remains statistically the same (unpaired t test, p > 0.05, n = 6 electrodes). The analysis of the surface sensitive redox couple (Fig. 3B, n = 6 electrodes) revealed a significant difference between the two tested electrode surfaces. The i–E curves for Fe(CN)63−/4− recorded at the electrode surface with aligned GO nanosheets provided well-defined, sigmoidal curves with the average ΔEp value of 92 ± 9 mV, indicating nearly reversible electron transfer kinetics. In contrast, no distinguishable redox peaks were observed for misaligned GO microelectrode (Fig. 3C, potential window extended for misaligned electrode in order to capture the redox reaction), suggesting significantly slower kinetics of electron transfer. This variation of the ΔEp, and therefore ET on the two electrode surfaces implies major differences in electrode microstructure (Fig. 3D, n = 6).Finally, our alignment hypothesis was investigated by electrochemical characterization of cylindrical electrodes. If we assume that our hypothesis and fabrication process are correct, the cross section of aligned electrodes would consist of edge planes, whereas predominantly basal planes would be exposed along the fiber. First, a cylindrical GO microelectrode (electrode length 150–250 μm) with aligned GO sheets was fabricated, and was characterized by CV. Then, the tip of the electrode (the cross section) was carefully sealed using epoxy, resulting in a blockage of the edge plane surface at the tip, while the basal plane structure remained exposed (see Fig. 4A for schematic). The resulting cyclic voltammograms of Fe(CN)63−/4− (Fig. 4B) confirmed our initial hypothesis; the whole cylindrical electrode depicts well-defined i–E curve, while the voltammograms recorded on the electrode with blocked edge planes showed no distinguishable redox peaks. An identical experiment was performed on misaligned GO electrodes. The microstructure of the misaligned electrode consists of both basal and edge planes, both on the electrode tip and along the fiber (Fig. 4C). Therefore, the resulting voltammograms for Fe(CN)63−/4− (Fig. 4D) have the identical shape, suggesting no changes in electron transfer kinetics. The absolute current value is smaller for the electrode with the sealed tip due to a smaller electrode surface area. Although we speculate that the exposed longitudinal sides of the fiber are not purely basal plane as depicted in the cartoon (Fig. 4A), this data indicates that more basal plane surfaces are exposed on the sides compared to the tip of the aligned GO fiber.
Collectively, the obvious morphological differences observed using SEM, microstructural differences recorded by Raman spectroscopy, and significant electrochemical behavior, presents a collective proof of controlled fabrication of GO microelectrodes with aligned and misaligned geometry.
3.3. Evaluation of the microelectrode performance for FSCV measurements
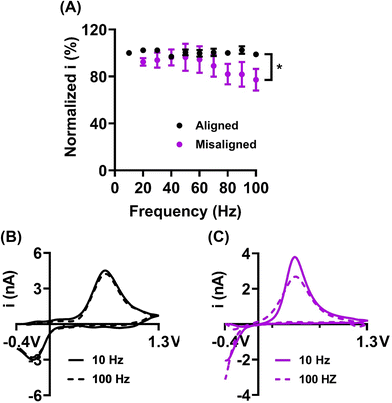
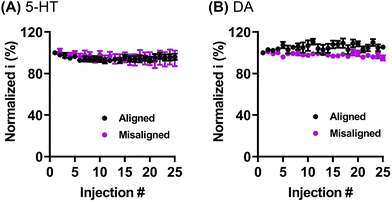
The GO sheet alignment impacts the reproducibility and extent of frequency independent behavior. The Venton group has previously reported on the “frequency independent” phenomena observed at carbon nanotubes and nanospikes.44,45 Briefly, the typical FSCV waveform for dopamine (from −0.4 to 1.3 V and back to −0.4 V at scan rate 400 V s−1) is applied at 10 Hz, and takes 8.5 ms, with a holding time of 91.5 ms between scans. When higher frequencies are applied, the holding time in between scans decreases, resulting in significantly less time for preconcentration of analyte (dopamine) on the electrode surface. Consequently, the dopamine signal decreases, and the temporal resolution of the measurements is therefore limited to 10 Hz (100 ms temporal resolution). It has been suggested that this behavior is linked to crevices on the electrode surface, that can create a thin-layer cell effect to momentarily trap dopamine. Consequently, the diffusion rate of the oxidation product (dopamine-o-quinone) is limited, the rate of the electron transfer increases, redox cycling is promoted, and the reaction therefore becomes frequency independent. The frequency independent behavior observed on graphene oxide microelectrodes was first reported by our group.10 Here, we demonstrate that the frequency independent behavior may be also affected by the GO nanosheets orientation (Fig. 5). In order to investigate the effect of GO sheets alignment on the scan repetition frequency, the oxidative current for 1 μM dopamine was measured as a function of applied frequency in range of 10 to 100 Hz. The GO microelectrodes with aligned nanosheets orientation, where mostly edge-plane structure is exposed, demonstrated frequency independent behavior (Fig. 5B) as no loss in signal current upon increasing the frequency from 10 to 100 Hz was observed (unpaired t test, p > 0.05, n = 6 electrodes). In contrast, GO with misaligned sheets orientations (combination of edge and basal plane) demonstrated significant decrease (unpaired t test, p = 0.0330, n = 6 electrodes) in the oxidation current (22.7 ± 9.2% at 100 Hz). Furthermore, the decrease in current at 100 Hz was significantly different between aligned and misaligned GO fiber electrode (unpaired t test, p = 0.0218, n = 6 electrodes). Our results indicate that the presence of pores or crevices is not the only determinative factor of the frequency independent electrode behavior. We hypothesize that structural geometry of the electrode surfaces (i.e., exposure of the edge and/or basal plane microstructure) may also play a role in this phenomenon. Future work could focus on a vertical alignment of the nanosheets along the fiber, that would result in exposure of primarily basal plane, and would allow further investigation of the effect of microstructure on the frequency independent phenomena.Carbon-based electrodes are commonly known for their susceptibility to detrimental fouling. Specifically, it was previously shown that serotonin (5-HT) tends to polymerize on electrode surfaces and cause a significant signal decrease over short periods of time.46–48 The antifouling behavior of GO fiber microelectrodes was previously investigated by our lab. Li et al.10 demonstrated that GO fibers, unlike traditionally used CFMEs, possess a remarkable fouling-resistant behavior. Here, we demonstrate the effect of graphene sheets alignment on the antifouling behavior. To test the electrodes performance, 1 μM 5-HT was repeatedly injected at the electrode (total of 25 injections), and the oxidation current was normalized to the first injection and analyzed (Fig. 6A). In addition, 1 μM dopamine was used as a control experiment (Fig. 6B) because low concentration dopamine is not capable of resulting in significant fouling.49 On average, 5-HT signal decreased to 95.8 ± 3.4% and 89.0 ± 3.6% for aligned and misaligned GO fibers, respectively, by the 25th injection. No statistical difference was observed between the two types of sheets alignments (unpaired t test, p > 0.05, n = 10 electrodes). Similarly, the normalized percent current for dopamine at the 25th injection was 105.5 ± 5.4% and 95.1 ± 7.2% for aligned and misaligned fibers, respectively, and no statistical differences were observed (unpaired t test, p > 0.05, n = 8 electrodes). Finally, the increased dopamine signal at aligned GO fibers (Fig. 6B) indicated a potential accumulation of dopamine on the electrode surface, however, this effect is negligible. Overall, our results are in agreement with prior studies from our lab,10 and indicates that the microstructure of GO fibers (i.e. exposure of primarily edge plane or combination of basal and edge plane sites) has no effect on the exceptional antifouling properties of GO electrodes for low concentration 5-HT. Our data suggest that fouling resistant behavior is not strongly dependent on the orientation of these graphitic planes when testing low concentrations of neurochemicals. We speculate that fouling resistance may be more dependent on the surface chemistry, e.g. the presence of oxygen containing functional groups and may also be concentration dependent. However, for better understanding of this phenomenon, additional thorough investigation is required.10,46
3.4. Electrochemical characterization of other neurotransmitters with FSCV
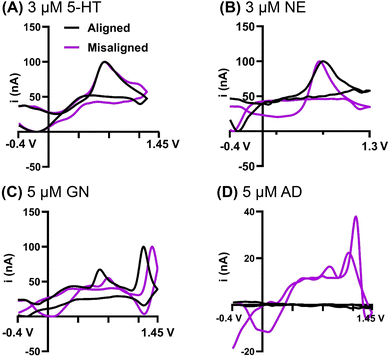
FSCV analysis in the brain has expanded beyond dopamine over the last decade.50,51 Here, we tested the extent to which GO sheet alignment impacted the detection of other common neurochemicals analyzed with FSCV, including serotonin (5-HT), norepinephrine (NE), adenosine (AD), and guanosine (GN). These four neurochemicals represent three different analyte structural classes including catecholamines (NE), purines (AD, GN), and indolamines (5-HT). NE is structurally similar to DA so we anticipated similar results; however, purines and indolamines are chemically very different from catecholamines so we speculated that the alignment of the sheets may impact these analytes differently. It is crucial to highlight the electrode area difference between the aligned and misaligned fibers; because of this, all voltammograms were normalized and the absolute value of the current was not compared. Example cyclic voltammograms at aligned and misaligned GO electrodes demonstrate that the sheets alignment does not affect the electron transfer kinetics of serotonin (Fig. 7A). Importantly, we found that both GO sheets alignment provide a stable detection of serotonin and therefore overcome the electrode fouling and low sensitivity commonly seen at carbon fiber electrodes.52,53 Similarly to serotonin, no effect of GO sheet alignments on electron transfer was observed for norepinephrine (Fig. 7B). Cyclic voltammograms for guanosine (Fig. 7C) show both primary and secondary oxidation peaks for both GO sheets alignments. The guanosine peak placement observed at the misaligned GO microelectrode is identical to traditional carbon fibers,54 while there was a noticeable peak shift recorded on the aligned electrode, indicating altered interaction of the analyte at predominantly edge plane sites when compared to the mixture of both basal and edge planes. Finally, a significant finding was obtained for adenosine (Fig. 7D). Adenosine cyclic voltammograms on carbon fiber electrodes are characterized by a dominant primary peak, with much smaller secondary oxidation peak, and hardly visible tertiary peak.55,56 Here, we have observed a well-defined CV with enhanced secondary and tertiary peaks for adenosine on the misaligned GO electrode. In contrast, no faradaic signal was obtained at the electrode with aligned GO sheets, where the edge plane sites are predominantly exposed. To confirm that the lack of faradaic current is not caused by a limited electrode sensitivity, additional experiments with up to 50 μM adenosine were performed, with an identical result (data not shown). We therefore concluded that adenosine has a high sensitivity to surface microstructure, with preference for the basal plane sites. Adenosine is well-known in the FSCV community to be challenging to detect, with low throughput across traditional carbon-fiber microelectrodes. Until now, it wasn't quite understood why adenosine detection was not as robust as other analytes like the catecholamines. Likewise, our lab has reported stark differences in how purines with varying functionality interact at electrode surfaces providing evidence that the placement and type of functional group can significantly impact how it adsorbs to electrode surfaces.57 Here, we observe large differences between GN and AD interaction at these surfaces further supporting the premise that small changes in chemical structure drastically influences surface interactions. Overall, these results present a significant advance in our understanding of adenosine electrochemistry and provides critical information for designing tailored carbon surfaces in the future for adenosine detection.4. Conclusions
Herein, we have fabricated and electrochemically characterized GO microelectrodes with controlled sheet alignment and orientation order. We have demonstrated the effect of the alignments on the electrodes physical and electrochemical properties. We have confirmed that the sheets alignments have a significant effect on the fiber's physical properties, as well as macroscopic graphene structures. We also confirmed that the differences in graphene sheets alignment and orientation are in agreement with their fundamental electrochemical behavior, namely the electron transfer kinetics. The ability to understand and control the sheets alignment, i.e. the microscopic structure of the electrode surface, is particularly necessary for future studies focused on specific analytes on interest. We demonstrated that the GO fiber with both aligned and misaligned sheet arrangement is an exceptional electrode material with antifouling properties and can be therefore used for a detection of dopamine and serotonin. The GO sheets alignment, and therefore the consequent microstructure of the GO microelectrode was further shown to play a significant role in the frequency-independent phenomenon. GO fibers with aligned GO microstructure was found to provide a frequency independent behavior, which makes the electrode an excellent material for real time biological sensing, especially when high temporal resolution is required. In addition to dopamine, we have further investigated the performance of both types of alignment for FSCV detection of other important neurochemical analytes, namely serotonin, norepinephrine, guanosine, and adenosine. We have found that both types of GO sheets alignment overcome the common electrode fouling behavior typically seen for serotonin. Taken collectively, we demonstrated our ability to fabricate GO microelectrodes with a controlled GO sheets alignment and shown that the alignment plays a significant role in subsecond neurochemical detection.Abbreviations
| FSCV | Fast-scan cyclic voltammetry |
| GO | Graphene oxide |
| CFME | Carbon-fiber microelectrode |
| GFME | Graphene-fiber microelectrode |
| DA | Dopamine |
| NE | Norepinephrine |
| 5-HT | Serotonin |
| AD | Adenosine |
| GN | Guanosine |
Conflicts of interest
The authors declare that they have no known competing financial interests or personal relationships that could have appeared to influence the work reported in this paper.Acknowledgements
This material is based upon work supported by the National Science Foundation under grant # 2143520. Any opinions, findings, and conclusions or recommendations expressed in this material are those of the authors and do not necessarily reflect the views of the NSF. The authors would also like to thank the Alfred P. Sloan Fellowship #FG-2022-18400. Graphical abstract was made using Biorender.References
- D. L. Robinson, B. J. Venton, M. L. A. V. Heien and R. M. Wightman, Detecting Subsecond Dopamine Release with Fast-Scan Cyclic Voltammetry in Vivo, Clin. Chem., 2003, 49(10), 1763–1773, DOI:10.1373/49.10.1763.
- P. Hashemi, E. C. Dankoski, J. Petrovic, R. B. Keithley and R. M. Wightman, Voltammetric Detection of 5-Hydroxytryptamine Release in the Rat Brain, Bioorg. Chem., 1978, 861(1), 9462–9471, DOI:10.1021/ac9018846.
- T. M. Field, M. Shin, C. S. Stucky, J. Loomis and M. A. Johnson, Electrochemical Measurement of Dopamine Release and Uptake in Zebrafish Following Treatment with Carboplatin, ChemPhysChem, 2018, 19(10), 1192–1196, DOI:10.1002/cphc.201701357.
- B. J. Venton and Q. Cao, Fundamentals of Fast-Scan Cyclic Voltammetry for Dopamine Detection, Analyst, 2020, 145(4), 1158–1168, 10.1039/C9AN01586H.
- Y. Li and A. E. Ross, Plasma-Treated Carbon-Fiber Microelectrodes for Improved Purine Detection with Fast-Scan Cyclic Voltammetry, Analyst, 2020, 145, 805–815, 10.1039/C9AN01636H.
- Y. Li, A. L. Keller, M. T. Cryan and A. E. Ross, Metal Nanoparticle Modified Carbon-Fiber Microelectrodes Enhance Adenosine Triphosphate Surface Interactions with Fast-Scan Cyclic Voltammetry, ACS Meas. Sci. Au, 2022, 2(2), 96–105, DOI:10.1021/acsmeasuresciau.1c00026.
- Y. Li, M. E. Weese, M. T. Cryan and A. E. Ross, Amine-Functionalized Carbon-Fiber Microelectrodes for Enhanced ATP Detection with Fast-Scan Cyclic Voltammetry, Anal. Methods, 2021, 13(20), 2320–2330, 10.1039/D1AY00089F.
- C. B. Jacobs, T. L. Vickrey and B. J. Venton, Functional Groups Modulate the Sensitivity and Electron Transfer Kinetics of Neurochemicals at Carbon Nanotube Modified Microelectrodes, Analyst, 2011, 1364–5528, 10.1039/c0an00854k (Electronic).
- A. E. Ross and B. J. Venton, Nafion-CNT Coated Carbon-Fiber Microelectrodes for Enhanced Detection of Adenosine, Analyst, 2012, 137(13), 3045–3051 RSC.
- Y. Li, R. Jarosova, M. E. Weese-Myers and A. E. Ross, Graphene-Fiber Microelectrodes for Ultrasensitive Neurochemical Detection, Anal. Chem., 2022, 94(11), 4803–4812, DOI:10.1021/acs.analchem.1c05637.
- M. Pumera, Electrochemistry of Graphene, Graphene Oxide and Other Graphenoids: Review, Electrochem. Commun., 2013, 36, 14–18, DOI:10.1016/j.elecom.2013.08.028.
- L. Stobinski, B. Lesiak, A. Malolepszy, M. Mazurkiewicz, B. Mierzwa, J. Zemek, P. Jiricek and I. Bieloshapka, Graphene Oxide and Reduced Graphene Oxide Studied by the XRD, TEM and Electron Spectroscopy Methods, J. Electron Spectrosc. Relat. Phenom., 2014, 195, 145–154, DOI:10.1016/j.elspec.2014.07.003.
- N. Ucar, G. Gokceli, I. O. Yuksek, A. Onen and N. K. Yavuz, Graphene Oxide and Graphene Fiber Produced by Different Nozzle Size, Feed Rate and Reduction Time with Vitamin C, J. Ind. Text., 2018, 48(1), 292–303, DOI:10.1177/1528083716685903.
- Y. Chang and B. J. Venton, Optimization of Graphene Oxide-Modified Carbon-Fiber Microelectrode for Dopamine Detection, Anal. Methods, 2020, 12(22), 2893–2902, 10.1039/d0ay00310g.
- T. Kuila, S. Bose, P. Khanra, A. K. Mishra, N. H. Kim and J. H. Lee, Recent Advances in Graphene-Based Biosensors, Biosens. Bioelectron., 2011, 26(12), 4637–4648, DOI:10.1016/J.BIOS.2011.05.039.
- Z. Dong, C. Jiang, H. Cheng, Y. Zhao, G. Shi, L. Jiang and L. Qu, Facile Fabrication of Light, Flexible and Multifunctional Graphene Fibers, Adv. Mater., 2012, 24(14), 1856–1861, DOI:10.1002/ADMA.201200170.
- F. Meng, W. Lu, Q. Li, J. H. Byun, Y. Oh and T. W. Chou, Graphene-Based Fibers: A Review, Adv. Mater., 2015, 27(35), 5113–5131, DOI:10.1002/adma.201501126.
- Z. Li, Z. Xu, Y. Liu, R. Wang and C. Gao, Multifunctional Non-Woven Fabrics of Interfused Graphene Fibres, Nat. Commun., 2016, 7, 13684, DOI:10.1038/ncomms13684.
- K. A. Mkhoyan, A. W. Contryman, J. Silcox, D. A. Stewart, G. Eda, C. Mattevi, S. Miller and M. Chhowalla, Atomic and Electronic Structure of Graphene-Oxide, Nano Lett., 2009, 9(3), 1058–1063, DOI:10.1021/nl8034256.
- S. Wang, Y. Dong, C. He, Y. Gao, N. Jia, Z. Chen and W. Song, The Role of Sp2/Sp3 Hybrid Carbon Regulation in the Nonlinear Optical Properties of Graphene Oxide Materials, RSC Adv., 2017, 7(84), 53643–53652, 10.1039/c7ra10505c.
- H. Yang, J. S. Li and X. Zeng, Correlation between Molecular Structure and Interfacial Properties of Edge or Basal Plane Modified Graphene Oxide, ACS Appl. Nano Mater., 2018, 1(6), 2763–2773, DOI:10.1021/acsanm.8b00405.
- R. J. Bowling, R. T. Packard and R. L. McCreery, Activation of Highly Ordered Pyrolytic Graphite for Heterogeneous Electron Transfer: Relationship between Electrochemical Performance and Carbon Microstructure, J. Am. Chem. Soc., 1989, 111(4), 1217–1223, DOI:10.1021/ja00186a008.
- R. J. Rice and R. L. McCreery, Quantitative Relationship between Electron Transfer Rate and Surface Microstructure of Laser-Modified Graphite Electrodes, Anal. Chem., 1989, 61(15), 1637–1641, DOI:10.1021/ac00190a010.
- C. E. Banks, R. R. Moore, T. J. Davies and R. G. Compton, Investigation of Modified Basal Plane Pyrolytic Graphite Electrodes: Definitive Evidence for the Electrocatalytic Properties of the Ends of Carbon Nanotubes, Chem. Commun., 2004,(16), 1804–1805, 10.1039/B406174H.
- S. C. S. Lai, A. N. Patel, K. McKelvey and P. R. Unwin, Definitive Evidence for Fast Electron Transfer at Pristine Basal Plane Graphite from High-Resolution Electrochemical Imaging, Angew. Chem., Int. Ed., 2012, 51(22), 5405–5408, DOI:10.1002/anie.201200564.
- X. Qin, Y. Lu, H. Xiao, Y. Wen and T. Yu, A Comparison of the Effect of Graphitization on Microstructures and Properties of Polyacrylonitrile and Mesophase Pitch-Based Carbon Fibers, Carbon, 2012, 50(12), 4459–4469, DOI:10.1016/J.CARBON.2012.05.024.
- F. G. Emmerich, Young's Modulus, Thermal Conductivity, Electrical Resistivity and Coefficient of Thermal Expansion of Mesophase Pitch-Based Carbon Fibers, Carbon, 2014, 79(1), 274–293, DOI:10.1016/J.CARBON.2014.07.068.
- G. Xin, W. Zhu, Y. Deng, J. Cheng, L. T. Zhang, A. J. Chung, S. De and J. Lian, Microfluidics-Enabled Orientation and Microstructure Control of Macroscopic Graphene Fibres, Nat. Nanotechnol., 2019, 14(2), 168–175, DOI:10.1038/s41565-018-0330-9.
- A. Ferrari and J. Robertson, Interpretation of Raman Spectra of Disordered and Amorphous Carbon, Phys. Rev. B: Condens. Matter Mater. Phys., 2000, 61(20), 14095–14107, DOI:10.1103/PhysRevB.61.14095.
- A. C. Ferrari and D. M. Basko, Raman Spectroscopy as a Versatile Tool for Studying the Properties of Graphene, Nat. Nanotechnol., 2013, 8, 235–246, DOI:10.1038/nnano.2013.46.
- A. A. K. King, B. R. Davies, N. Noorbehesht, P. Newman, T. L. Church, A. T. Harris, J. M. Razal and A. I. Minett, A New Raman Metric for the Characterisation of Graphene Oxide and Its Derivatives, Sci. Rep., 2016, 6, 19491, DOI:10.1038/srep19491.
- S. Claramunt, A. Varea, D. López-Díaz, M. M. Velázquez, A. Cornet and A. Cirera, The Importance of Interbands on the Interpretation of the Raman Spectrum of Graphene Oxide, J. Phys. Chem. C, 2015, 119(18), 10123–10129, DOI:10.1021/acs.jpcc.5b01590.
- W. T. Jung, H.-S. Jang, J. W. Jeon and B. H. Kim, Effect of Oxygen Functional Groups in Reduced Graphene Oxide-Coated Silk Electronic Textiles for Enhancement of NO2 Gas-Sensing Performance, ACS Omega, 2021, 6(41), 27080–27088, DOI:10.1021/acsomega.1c03658.
- S. Claramunt, A. Varea, D. López-Díaz, M. M. Velázquez, A. Cornet and A. Cirera, The Importance of Interbands on the Interpretation of the Raman Spectrum of Graphene Oxide, J. Phys. Chem. C, 2015, 119(18), 10123–10129, DOI:10.1021/acs.jpcc.5b01590.
- E. Morris, M. Weisenberger and G. Rice, Properties of PAN Fibers Solution Spun into a Chilled Coagulation Bath at High Solvent Compositions, Fibers, 2015, 3(4), 560–574, DOI:10.3390/fib3040560.
- R. J. Rice, N. M. Pontikos and R. L. McCreery, Quantitative Correlations of Heterogeneous Electron-Transfer Kinetics with Surface Properties of Glassy Carbon Electrodes, J. Am. Chem. Soc., 1990, 112(12), 4617–4622, DOI:10.1021/ja00168a001.
- K. R. Kneten and R. L. McCreery, Effects of Redox System Structure on Electron-Transfer Kinetics at Ordered Graphite and Glassy Carbon Electrodes, Anal. Chem., 1992, 64(21), 2518–2524, DOI:10.1021/ac00045a011.
- P. Chen and R. L. McCreery, Control of Electron Transfer Kinetics at Glassy Carbon Electrodes by Specific Surface Modification, Anal. Chem., 1996, 68(22), 3958–3965, DOI:10.1021/ac960492r.
- M. Poon and R. L. Mccreery, In Situ Laser Activation of Glassy Carbon Electrodes, Anal. Chem., 1986, 58, 2745–2750 CrossRef CAS.
- R. L. McCreery, Carbon Electrodes: Structural Effects on Electron Transfer Kinetics, in Electroanalytical Chemistry, ed. A. J. Bard, Marcel Dekker Inc, New York, 1991, pp. 221–374 Search PubMed.
- P. Chen, M. A. Fryling and R. L. McCreery, Electron Transfer Kinetics at Modified Carbon Electrode Surfaces: The Role of Specific Surface Site, Anal. Chem., 1995, 67(18), 3115–3122, DOI:10.1021/ac00114a004.
- N. Wächter, C. Munson, R. Jarošová, I. Berkun, T. Hogan, R. C. Rocha-Filho and G. M. Swain, Structure, Electronic Properties, and Electrochemical Behavior of a Boron-Doped Diamond/Quartz Optically Transparent Electrode, ACS Appl. Mater. Interfaces, 2016, 8(42), 28325–28337, DOI:10.1021/acsami.6b02467.
- R. Jarošová, P. M. De Sousa Bezerra, C. Munson and G. M. Swain, Assessment of Heterogeneous Electron-Transfer Rate Constants for Soluble Redox Analytes at Tetrahedral Amorphous Carbon, Boron-Doped Diamond, and Glassy Carbon Electrodes, Phys. Status Solidi A, 2016, 213(8), 2087–2098, DOI:10.1002/pssa.201600339.
- C. Yang, K. Hu, D. Wang, Y. Zubi, S. T. Lee, P. Puthongkham, M. V. Mirkin and B. J. Venton, Cavity Carbon-Nanopipette Electrodes for Dopamine Detection, Anal. Chem., 2019, 91(7), 4618–4624, DOI:10.1021/ACS.ANALCHEM.8B05885.
- C. B. Jacobs, I. N. Ivanov, M. D. Nguyen, A. G. Zestos and B. J. Venton, High Temporal Resolution Measurements of Dopamine with Carbon Nanotube Yarn Microelectrodes, Anal. Chem., 2014, 86(12), 5721–5727, DOI:10.1021/ac404050t.
- M. E. Weese, R. A. Krevh, Y. Li, N. T. Alvarez and A. E. Ross, Defect Sites Modulate Fouling Resistance on Carbon-Nanotube Fiber Electrodes, ACS Sens., 2019, 4(4), 1001–1007, DOI:10.1021/ACSSENSORS.9B00161.
- B. E. Kumara Swamy and B. J. Venton, Carbon Nanotube-Modified Microelectrodes for Simultaneous Detection of Dopamine and Serotonin in Vivo, Analyst, 2007, 132, 876–884, 10.1039/b705552h.
- P. Hashemi, E. C. Dankoski, J. Petrovic, R. B. Keithley and R. M. Wightman, Voltammetric Detection of 5-Hydroxytryptamine Release in the Rat Brain, Anal. Chem., 2009, 81(22), 9462–9471, DOI:10.1021/ac9018846.
- Y. Li, C. M. Fleischer and A. E. Ross, High Young's Modulus Carbon Fibers Are Fouling Resistant with Fast-Scan Cyclic Voltammetry, Chem. Commun., 2020, 56(58), 8023–8026, 10.1039/D0CC02517H.
- P. Hashemi, E. C. Dankoski, J. Petrovic, R. B. Keithley and R. M. Wightman, Voltammetric Detection of 5-Hydroxytryptamine Release in the Rat Brain, Anal. Chem., 2009, 81(22), 9462–9471, DOI:10.1021/ac9018846.
- A. Abdalla, C. W. Atcherley, P. Pathirathna, S. Samaranayake, B. Qiang, E. Peña, S. L. Morgan, M. L. Heien, P. Hashemi and M. L. Heien, In Vivo Ambient Serotonin Measurements at Carbon-Fiber Microelectrodes HHS Public Access, Anal. Chem., 2017, 89(18), 9703–9711, DOI:10.1021/acs.anal-chem.7b01257.
- B. P. Jackson, S. M. Dietz and R. M. Wightman, Fast-Scan Cyclic Voltammetry of 5-Hydroxytryptamine, Anal. Chem., 1995, 67(6), 1115–1120, DOI:10.1021/ac00102a015.
- K. E. Dunham and B. J. Venton, Improving Serotonin Fast-Scan Cyclic Voltammetry Detection: New Waveforms to Reduce Electrode Fouling, Analyst, 2020, 145(22), 7437–7446, 10.1039/D0AN01406K.
- M. T. Cryan and A. E. Ross, Subsecond Detection of Guanosine Using Fast-Scan Cyclic Voltammetry, Analyst, 2018, 144(1), 249–257, 10.1039/C8AN01547C.
- M. T. Cryan and A. E. Ross, Scalene Waveform for Codetection of Guanosine and Adenosine Using Fast-Scan Cyclic Voltammetry, Anal. Chem., 2019, 91(9), 5987–5993, DOI:10.1021/acs.analchem.9b00450.
- B. E. K. Swamy and B. J. Venton, Subsecond Detection of Physiological Adenosine Concentrations Using Fast-Scan Cyclic Voltammetry, Anal. Chem., 2007, 79(2), 744–750, DOI:10.1021/ac061820i.
- G. N. Lim and A. E. Ross, Purine Functional Group Type and Placement Modulate the Interaction with Carbon-Fiber Microelectrodes, ACS Sens., 2019, 4(2), 479–487, DOI:10.1021/acssensors.8b01504.
Footnote |
| † Electronic supplementary information (ESI) available. See DOI: https://doi.org/10.1039/d3nr02879h |
| This journal is © The Royal Society of Chemistry 2023 |


