
 Open Access Article
 This Open Access Article is licensed under a Creative Commons Attribution-Non Commercial 3.0 Unported Licence
Spontaneous sieving of water from ethanol using angstrom-sized nanopores†
Archith
Rayabharam
 ad,
Haoran
Qu
b,
YuHuang
Wang
*bc and
N. R.
Aluru
*d
ad,
Haoran
Qu
b,
YuHuang
Wang
*bc and
N. R.
Aluru
*d
aDepartment of Mechanical Science and Engineering, University of Illinois at Urbana-Champaign, Urbana, IL 61801, USA
bDepartment of Chemistry and Biochemistry, University of Maryland, College Park, MD 20742, USA. E-mail: yhw@umd.edu
cMaryland NanoCenter, University of Maryland, College Park, MD 20742, USA
dWalker Department of Mechanical Engineering, Oden Institute for Computational Engineering and Sciences, The University of Texas at Austin, Austin, Texas 78712, USA. E-mail: aluru@utexas.edu
First published on 10th July 2023
Abstract
Ethanol is widely used as a precursor in products ranging from drugs to cosmetics. However, distillation of ethanol from aqueous solution is energy intensive and expensive. Here, we show that angstrom-sized nanopores with precisely controlled pore sizes can spontaneously remove water from ethanol–water mixtures through molecular sieving at room temperature and pressure. For small-diameter nanotubes, water-filling is observed, but ethanol is completely excluded, as evidenced by time-dependent density functional theory (TD-DFT) calculations and spectroscopy measurements. Potential of mean force calculations were performed to determine how the free energy barriers for water and ethanol-filling of the nanotubes change with increasing pore size. Water/ethanol selectivity ratio reaching as high as 6700 is observed with a (6,4) nanotube, which has a pore size of 0.204 nm. This selectivity vanishes as the pore size increases beyond 0.306 nm. These findings provide insights that may help realize energy efficient molecular sieving of ethanol and water.
Ethanol is a key precursor to many drugs, polymers, and cosmetics. However, industrial manufacturing of ethanol is energy intensive and expensive due to the use of distillation techniques to separate ethanol–water mixtures, which consume energy on the order of 2 MJ kg−1.1–5 An alternative to distillation is molecular sieving through size-exclusion,6,7 which relies on the differences in sizes of water and ethanol molecules.
Molecular sieving has been previously demonstrated for a variety of molecules such as sieving of gases like carbon dioxide and nitrogen using graphene nanopores,8 ethane and ethene using metal–organic frameworks.9 In the earlier case, the authors control the diameter of the pore and use a small negative charge at the pore of the graphene nanopore and observe that the negative charge increases the selectivity towards carbon dioxide due to enhanced electrostatic interactions and by repelling the nitrogen molecules from the pore. Molecular sieving of ions and gases has also been demonstrated in a variety of other materials like graphene oxide membranes10,11 and MXenes12 respectively. Theoretical studies on the separation of water and ethanol using zeolites and carbon nanotubes show that the selectivity of molecules can be influenced by applying additional external forces like pressure and electric field.13,14 Carbon nanotubes have been extensively studied due to their remarkable electronic, optical, and mechanical properties and have a wide variety of potential applications, ranging from field-effect transistors to desalination of sea water.15,16 Nature too has evolved nanochannels like aquaporin, which are capable of selectively transporting water across membranes while rejecting other molecules. Selective transport of ions has also been demonstrated for nanopore systems like carbon nanotube porins, where it was observed that sub-nm confinement plays an important role in the fast transport of water and tunable ion selectivity. In addition, the molecular and pore sizes have been shown to contribute significantly to observing selectivity towards a particular molecule. For instance, certain molecules can undergo conformational transformations in order to fit into a smaller nanopore, thereby enabling them to be selectively sieved using carbon nanotubes.17 Here, we show that water can be sieved from ethanol–water mixtures by precisely controlling the diameter of angstrom-sized nanopores. Single-walled carbon nanotubes (SWCNTs) are used as representative angstrom-sized nanopores. The energy required to drive water into the nanotubes is solely derived from the thermal energy of molecules at 300 K. We found that water readily fills small-diameter nanotubes, but ethanol can be completely excluded, thereby achieving ultrahigh selectivity in the separation. Spectroscopy measurements and time-dependent density functional theory (TD-DFT) simulations consistently confirm that ethanol is excluded from the narrow pores chosen. We identify the diameter of the nanotube required for sieving water from ethanol–water mixtures through potential of mean force (PMF) calculations and evaluate the free energy barriers for water and ethanol-filling in nanotubes.
Results
AIMD simulations predict that water can enter (6,4)-SWCNT pore while ethanol cannot
To determine the feasibility of sieving water from ethanol, we perform ab initio molecular dynamics (AIMD) calculations. These simulations account for quantum effects, which become significant at these length scales. We place an ethanol molecule at the mouth of hydroxyl group-terminated nanotubes. We observe that both ethanol and water readily fill (6,5)-SWCNT and larger nanotubes, but for the smaller diameter (6,4)-SWCNT, only water fills while ethanol is excluded. The molecular filling of (6,4)-SWCNT placed in an ethanol–water bath is shown in Fig. 1A, which elucidates the sieving of water. Although the size of (6,5) is larger than (6,4), directly predicting the filling of ethanol and water into these SWCNTs and selectivity is not trivial. This is because, purely in terms of kinetic diameter and pore size of SWCNTs, filling of ethanol into (8,3) and (6,5)-SWCNTs cannot be explained through a direct comparison of traditional definitions of size. Pore diameters of SWCNTs are usually calculated by subtracting the van der Waals diameter of carbon from the center-to-center distance between the diametrically opposite carbons in an SWCNT. Kinetic diameter of ethanol is between 0.43–0.45 nm,18,19 whereas using the definition of the pore size of CNTs mentioned above, pore sizes are evaluated as 0.43 nm and 0.41 nm for (8,3) and (6,5)-SWCNTs. Based on these definitions of pore size, ethanol should not be able to fill these nanotubes. | ||
| Fig. 1 AIMD simulations predict that water can enter (6,4)-SWCNT pore while ethanol cannot. A, Molecular filling of (6,4)-SWCNT placed in an ethanol–water bath. Only water fills into the SWCNT, with ethanol from the bath being excluded. Oxygen is shown in red, carbon of ethanol in teal, hydrogen in white and SWCNT in blue B, comparison of the probability distribution of the minimum projected diameter of ethanol and water in bulk from MD simulations and the accessible pore diameters (Φ) of (6,4) and (6,5)-SWCNTs. The probability of ethanol to have a diameter lower than (Φ) is very close to zero, which means that it does not enter (6,4)-SWCNT. The schematic of the accessible pore size is shown in the inset, which is defined as the nanotube diameter subtracting the minimal atom-center-to-center distance between the (6,4)-SWCNT wall and hydrogen atoms of ethanol. The range of molecular sizes that can enter (6,4)-SWCNT is shown in the orange shaded region and those that can enter (6,5)-, but not (6,4)-SWCNT is shown in purple. | ||
To explain the sieving effects and to get improved estimates of pore sizes, we therefore define accessible pore sizes of SWCNTs, which are evaluated through ab initio MD to incorporate curvature effects. In addition, the estimate of kinetic diameter of molecules is an averaged value for molecules in gaseous state and is improved by using a distribution of minimum projected diameter of these molecules (Fig. 1B) in confinement and bulk, accounting for the conformational changes a molecule can undergo while filling into nanotubes. Including these conformational changes is important for explaining selectivity as they account for cases where molecules of sizes larger than pores undergo stretching to fill into nanotubes. The accessible size (Φ) of (6,4)-SWCNT is defined as the difference between the center-to-center diameter of the nanotube and the radial distance (Δ) between the nanotube wall and the hydrogen atoms of the ethanol inside. The most probable value of Δ is 0.244 nm (ESI Fig. 4†). From this, the accessible pore size of (6,4)-SWCNT is calculated to be 0.204 nm, but the probability that ethanol having a minimum projected diameter in bulk at 300 K of less than 0.204 nm is zero, as concluded from Fig. 1B. The orange shaded region in Fig. 1B portrays this information. At the same time, the minimum projected diameter of water in bulk has an average value of 0.122 nm, which is smaller than Φ of (6,4)-SWCNT, and therefore can fill the nanotube. Fig. 1B also shows the accessible pore diameter of (6,5)-SWCNT, and the purple shaded region marks the range of molecular sizes which can enter (6,5)-, but not (6,4)-SWCNT.
Spectral evidence of water sieving
We further simulated the absorption spectra of ethanol- and water-filled SWCNTs to differentiate their optical response to the filled molecules via time-dependent density functional theory (TD-DFT). We observe distinct, measurable spectral shifts in the E11 peaks when the SWCNTs are empty, water-filled, and ethanol-filled (ESI Fig. 3†). Fig. 2C shows the comparison between the simulated E11 spectra of 5 systems – empty and water-filled (6,4)- and (6,5)-SWCNTs and ethanol-filled (6,5)-SWCNT. The largest shift in the E11 peaks is observed between water-filled and empty (6,4)-SWCNT, where a 10.5 meV shift is observed, closely followed by ethanol-filled and empty (6,5)-SWCNT, with a shift of 10 meV. Even the smallest shift of 4 meV, which is observed for water-filled and empty (6,5)-SWCNT is observable in photoluminescence experiments.17 When water inside (6,5)-SWCNT is replaced with ethanol we observe a shift of 6 meV (Fig. 2C), signaling the ethanol filling.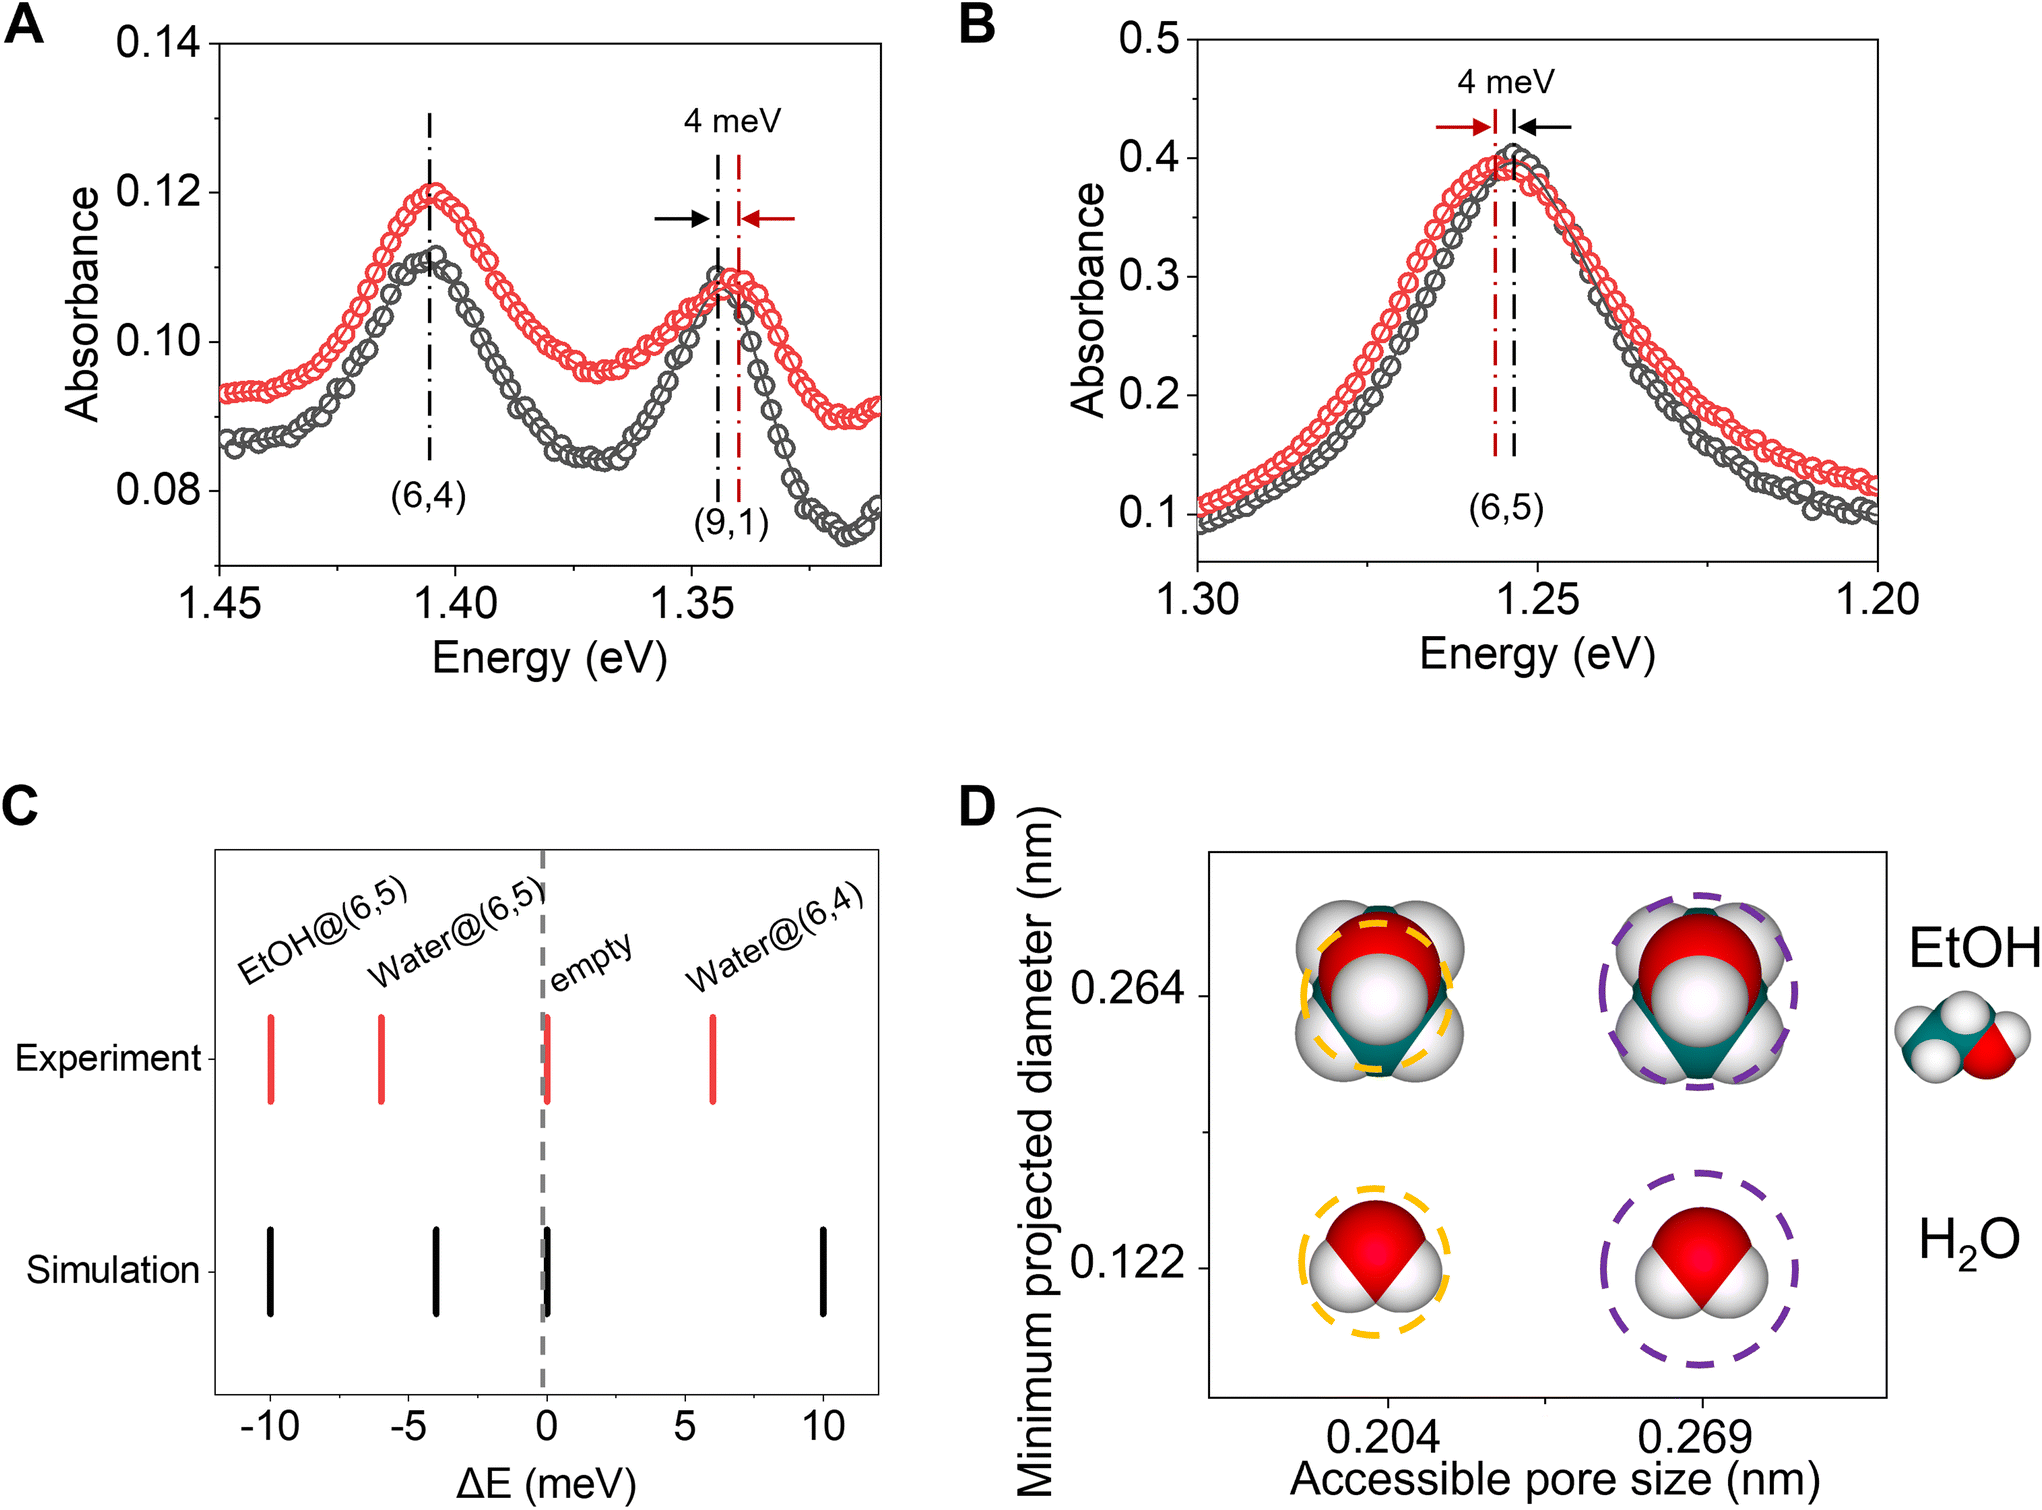 | ||
| Fig. 2 Spectral evidence of water sieving. A and B, Molecular filling induces a spectral shift in electronic absorption of the carbon nanotube. The incubated SWCNTs were purified by aqueous two-phase extraction (ATPE) to obtain a mixture of (6,5), (6,4) and (9,1)-SWCNTs. A mod dependent E11 shift is observed. The E11 of (6,5)-SWCNTs are 989 nm (1.256 eV) and 987 nm (1.253 eV) for EtOH filled and water-filled (6,5)-SWCNTs, respectively, while E11 of (9,1)-SWCNTs are 924 nm (1.342 eV) and 928 nm (1.336 eV) for EtOH filled and water-filled (9,1)-SWCNTs, respectively. However, the E11 of water or EtOH filled (6,4)-SWCNTs show the same E11 at 882 nm (1.406 eV) which corresponds to water filling, suggesting EtOH is too large to fill these nanotubes. Red and black circles are data points from the raw data. C, Comparison of spectral shifts obtained from TD-DFT simulations and experiments shows good agreement. Spectral shifts obtained from experiments are shown in red, and those obtained from simulations are shown in black and are shown as the difference between E11 of filled and empty SWCNTs (ΔE). D, cross-sections of ethanol and water-filled (6,5)-, and (6,4)-SWCNTs. The molecular sizes of the molecules are shown as minimum projected diameters, and the pore sizes of SWCNTs are marked by accessible pore diameters (Φ). Oxygen is shown in red, hydrogen in white, and carbon in teal. | ||
These theoretical predictions are directly confirmed experimentally by measuring the absorption spectra of SWCNTs in response to water and ethanol filling (Fig. 2). We incubated (9,1)-, (6,5)- and (6,4)-SWCNTs in ethanol or water (see Methods), followed with dispersion in 2 wt% DOC/H2O solution. The E11 peaks of ethanol incubated (9,1)- and (6,5)-SWCNTs are distinct from the E11 peak of water-filled (6,5)-SWCNTs, while ethanol incubation does not cause any change to the E11 peak of water-filled (6,4)-SWCNTs, indicating that only the small water molecules can enter this small diameter nanotube. These experiments show that ethanol can enter (6,5)- and (9,1)-SWCNTs while they are excluded by the slightly smaller pore of (6,4)-SWCNT. Note that (6,5)- and (9,1)-SWCNTs have the same diameter of 0.757 nm while their mod (n–m, 3) is different. The redshifted E11 of (6,5)-SWCNTs (mod 1) and the blue-shifted E11 of (9,1)-SWCNTs (mod 2) upon incubation of ethanol indicates that the ethanol molecules enter the nanotubes pores instead of staying on the outside surface.17
Free energy barriers for water and ethanol filling
We calculated the free energy barriers for water and ethanol to fill the nanotubes from the potential of mean force barriers (PMFBs) for water and ethanol entering 4 SWCNTs with increasing diameter. PMFBs of 3 SWCNTs are plotted in Fig. 3A–C. We observe that as the diameter of the nanotube increases, it becomes easier for the molecule to fill the SWCNT. This is particularly true for ethanol as we see a drastic decrease of the PMFB from 0.303 eV for (6,4)-SWCNT to 0.009 eV for (9,2)-SWCNT. This is in stark contrast to the PMFB of water-filling, where, for the range of accessible pore diameters we have chosen (0.204–0.330 nm), the decrease is smaller, from 0.053 eV to 0.008 eV as shown in Table 1. In addition, the PMFB for ethanol and water filling in SWCNTs becomes indistinguishable if the diameter of the SWCNT is large enough. From our calculations, the SWCNT for which the PMFBs for water and ethanol-filling become comparable is (8,3)-SWCNT. | ||
| Fig. 3 Free energy barriers for water and ethanol filling of SWCNTs decrease with the increase in diameter. A, B, C, PMFBs for ethanol and water filling for (6,4)-, (6,5)- and (8,3)-SWCNTs. For filled SWCNTs, PMFBs decrease with an increase in the size of the SWCNT. PMFBs for ethanol-filling are plotted in blue and for water-filling in red. Thermal energy at 300 K is shown as black dashed lines for scale (kBT = 0.026 meV). D, molecular model used for potential of mean force (PMF) calculations. The SWCNTs are terminated with hydroxyl ions (OH−). Carbon is shown in teal, oxygen in red and hydrogen in white. The black curve shows a typical PMF profile for a molecule filling an SWCNT. | ||
| System | Accessible pore size (Φ) (nm) | PMFBethanol (eV) | PMFBwater (eV) |
|---|---|---|---|
| (6,4)-SWCNT | 0.204 | 0.303 | 0.053 |
| (6,5)-SWCNT | 0.269 | 0.224 | 0.034 |
| (8,3)-SWCNT | 0.306 | 0.017 | 0.012 |
| (9,2)-SWCNT | 0.330 | 0.009 | 0.008 |
The selectivity of ethanol and water through SWCNTs is studied in terms of size exclusion using accessible pore diameters for SWCNTs (Table 1) and minimum projected diameter for ethanol and water (Fig. 1B), as we observe that it is the primary mechanism through which selectivity occurs. Effects of weak chemical interactions and other thermodynamic effects are implicitly considered while performing the simulations, although, to better understand them, we decouple the calculated free energies into its constituents and discuss their influence on the selectivity of water over ethanol for SWCNTs. To gauge the stability of ethanol and water inside the SWCNTs, we calculate the free energy changes of ethanol and water in bulk and in confinement. The reference system for the calculations is taken as the solution (bulk) of water and ethanol, and the empty (6,4)-, and (6,5)-SWCNTs. Free energy change is calculated using the equation:
| ΔF = ΔU − TΔS | (1) |
| System | ΔU (eV) | ΔS (eV K−1) | ΔF (eV) |
|---|---|---|---|
| Water-(6,4)-SWCNT | 2.952 × 10⁻¹ | 8.840 × 10⁻⁴ | 2.992 × 10⁻² |
| Water-(6,5)-SWCNT | −6.250 × 10⁻² | −2.960 × 10⁻⁴ | 2.631 × 10⁻² |
| Ethanol-(6,4)-SWCNT | 5.981 × 10⁻¹ | 1.710 × 10⁻³ | 8.517 × 10⁻² |
| Ethanol-(6,5)-SWCNT | −2.323 × 10⁻¹ | −1.023 × 10⁻³ | 7.464 × 10⁻² |
Ultrahigh selectivity in sieving water from ethanol
To analyze the selectivity of the SWCNTs towards ethanol and water-filling, we model the filling in terms of the PMFBs for the liquids and convert them to rate constants analogous to the Arrhenius rate equation (or the more general transition state theory (TST)). We assume that the rate of water or ethanol entering CNTs is only governed by the PMFB for the molecule to enter the CNT and the ratio of the rate constants for water and ethanol is given by the following equation | (2) |
F barrierwater/ethanol here corresponds to free energy barriers calculated from the potential of mean force simulations shown in Fig. 3. In addition, the pre-exponent factor in this model is only a function of temperature, and therefore gets canceled in the numerator and the denominator.21 From this quantity, we can identify the selectivity of SWCNTs towards water in ethanol–water mixtures. In Fig. 4, the ratio of the rate constant of water and ethanol decreases drastically as we increase the diameter of the SWCNT. In addition, for (6,4)-SWCNT, the selectivity towards water is approximately 6700, for (6,5)-SWCNT, it decreases to around 1000, and finally for (8,3)- and (9,2)-SWCNTs, it approaches 1, which means that the selectivity of SWCNTs towards water becomes non-existent starting from (8,3)-SWCNT.
 | ||
| Fig. 4 Ratio of rate constants associated with ethanol and water filling. Calculated from the PMFBs mentioned in Table 1 and Fig. 3A–C. Selectivity of SWCNTs towards water decreases drastically as the diameter is increased and converges to 1 for (9,2)-SWCNT. The red dashed line indicates no selectivity. | ||
Remarkably, this high selectivity is attained at room temperature without any additional energy input and occurs solely due to the thermal motion of molecules. In addition, the filling process is also spontaneous. These characteristics of filling SWCNTs can be utilized to design a sieving protocol to separate ethanol and water. (6,4)-SWCNTs incubated in ethanol–water mixtures would fill with water, leaving only ethanol behind. This can be repeated multiple times in order to obtain ethanol of the required purity.
Our results demonstrate that the molecular sieving selectivity for ethanol and water can arise at a specific nanotube pore diameter. While it is currently unpractical to utilize these chirality pure SWCNTs for molecular sieving due to their high costs, previous research has shown the development of separation membranes based on SWCNTs. With further advancements in nanotube sorting, it is possible that these materials will become available on a larger scale.17,22–24 Furthermore, our precision model system offers quantitative predictions regarding the size and interaction of molecules within the pores. This information can guide the design of the molecular sieving membranes for water–ethanol separation and potentially be extended to other molecules and nanopores. For instance, the energy barriers we obtained from TST calculations for the SWCNTs may contribute to understanding the relationships between permeability, selectivity, and energy barriers observed in recent measurements of various membranes and molecules.25–28
Conclusion
In summary, we demonstrate that by precisely controlling the pore size of SWCNTs, sieving of water from ethanol–water mixtures can be achieved. This selective filling is observed to be spontaneous and occurs at room temperature and pressure, without any additional input of energy. These results are corroborated by the estimation of absorption spectra through TDDFT calculations and spectroscopy measurements. We also show from PMF and selectivity ratio calculations that the ultrahigh selectivity towards water over ethanol can be achieved for (6,4)-SWCNT, and this selectivity is lost as the pore size is increased. The low energy costs, along with the scale of the angstrom-sized nanopores used (accessible pore size (Φ) of 0.204–0.33 nm) and the reusability of SWCNTs in sieving water from mixtures, demonstrate that the method described in the paper can be used to separate hard-to-separate liquids using angstrom-sized nanopores efficiently.Methods
Molecular dynamics (MD)
MD simulations were performed to calculate the distribution of the minimum projected diameter (Fig. 1B) of ethanol in bulk and to estimate the potential of mean force barriers (PMFBs) of ethanol and water filling in SWCNTs (Fig. 3). These simulations used the large-scale atomic/molecular massively parallel simulator (LAMMPS)29 MD toolkit. To simulate ethanol and water, we use the all-atom optimized potentials for liquid simulation (OPLS-AA) potential30 and TIP3P potential31 respectively. The atoms in the SWCNT are simulated using the adaptive intermolecular reactive empirical bond order potential (AIREBO).32 Interactions between carbon in the SWCNT and atoms in ethanol and water are modeled using the Lennard-Jones potential.33 The SWCNTs are placed in the liquid baths and are terminated with –OH groups. Further, the temperature is maintained at 300 K to model the experimental conditions. The dimensions of each of ethanol and water baths is 2.5 × 2.5 × 2.5 nm3, the length of the SWCNT in each case is 4 nm and canonical (NVT) ensemble is used. The configurations to calculate the distribution of the projected diameter in Fig. 1 were collected from the simulations of ethanol placed in a bath of volume 2.5 × 2.5 × 2.5 nm3 at 300 K and 0.1 MPa (1 atm). The simulations are equilibrated for 5 ns using the isothermal–isobaric (NPT) ensemble, before post-processing is done using NVT to bin the molecules based on their projected diameter. A time step of 0.25 fs was used, with data being sampled every 100 timesteps and the system was run until enough statistics were obtained to ensure a smooth distribution (∼500 ps). The damping parameters used in LAMMPS for the thermostat and barostat are 2.5 fs and 25 fs, respectively, under the NPT ensemble during equilibration. For the production run using NVT, the damping parameter used for the thermostat is similarly 2.5 fs. Potential of mean force (PMF) calculations in Fig. 3 are performed on the trajectories obtained from these MD simulations by estimating the average force as a function of the z-coordinate (axial to the SWCNT axis) and finally integrating the average force with z.Density functional theory (DFT)
DFT was used to optimize the geometries used in AIMD simulations (described in the next section) and to verify that ethanol is indeed able to fill (6,5)-SWCNT. These simulations are performed using the Vienna ab initio simulation package (VASP).34 The Perdew–Burke–Ernzerhof (PBE) functional35 is used for exchange correlation energy. A 1 × 1 × 8 grid has been used in these simulations along with an energy cut-off of 450 eV.Time-dependent density functional theory (TD-DFT)
TD-DFT was used to calculate the absorption spectra of (6,4)-, (6,5)-SWCNTs filled with water and both water and ethanol respectively. The geometries were optimized using DFT. The functional and all parameters used were the same as those used in DFT and these absorption spectra simulations were performed in VASP.Ab initio molecular dynamic simulations (AIMD)
AIMD simulations were performed to show that ethanol moves into (6,5)-SWCNT and to calculate the accessible pore size of (6,4)-SWCNT (Fig. 1A). These simulations were performed for the ethanol and (6,4)- and (6,5)-SWCNT systems starting from two configurations: (1) ethanol is placed at the pore mouth; (2) ethanol placed inside the SWCNT, away from the hydroxyl groups at the pore mouth. The first configuration is used to check whether ethanol fills (6,5)-SWCNT and the second configuration is used to calculate the accessible pore size of (6,4)-SWCNT. The modeled (6,4)- and (6,5)-SWCNTs consists of 304 and 364 carbon atoms respectively, with an additional 44 atoms of hydroxyl groups (–OH) at the end of the nanotube. In total, the (6,4)- and (6,5)-SWCNT systems have 368 and 428 atoms respectively with the volume of the simulation box being 22.5 × 22.5 × 80 Å3. The data files for the coordinates of the systems used are supplied in the ESI.† AIMD simulations were performed in VASP, and all the parameters used were same as those used for geometry optimization in DFT (mentioned in the previous section). In addition, the canonical ensemble was used, with the temperature maintained at 300 K. For the system described in the first configuration, the simulations were performed until it was sufficient to determine whether the molecule was being excluded or not, which is ≈2 ps.Process to uncap and fill the carbon nanotubes
To enable the filling of SWCNTs, we first opened the nanotube ends through controlled oxidation and then filled the uncapped nanotubes according to previously established experimental procedures.17 Briefly, in this work ∼10–20 mg of CoMoCat SG65 SWCNTs (Sigma Aldrich, lot MKBS9734V) was used. A powder of the uncapped SWCNTs (∼5 mg) was placed in a 10 mL round bottom flask and immersed in 5 mL ethanol. The mixture was then incubated for 48 h at 55 °C. Post incubation, the mixtures were filtered (Millipore VVLP membrane, 0.1 μm pore size) to separate the bulk liquid from the solid nanotubes. The resulting cake, (2 to 10) mg, was manually crumbled loose and placed in a vacuum chamber for 24 h at room temperature to evaporate residual ethanol that may stick to the outer walls of the nanotubes.Carbon nanotube dispersion process
For ensemble spectroscopy measurements, we dispersed ≈(1 to 2) mg nanotubes, with and without ethanol incubation, in 2 mL of 10 g L−1 sodium deoxycholate (DOC) in Nanopure™ H2O by ultrasonication with a power of 4 W and at 10 °C for 30 min, followed by centrifugation at 1717 rad s−1 (25![[thin space (1/6-em)]](https://www.rsc.org/images/entities/char_2009.gif) 000g, 16400 rpm) for 1 h (Eppendorf centrifuge 5417 R).
000g, 16400 rpm) for 1 h (Eppendorf centrifuge 5417 R).
Characterization
To probe the optical properties at the ensemble level, the SWCNTs were further diluted in 2 mL of 10 g L−1 DOC in H2O. The PL was collected using a NanoLog spectrofluorometer (Horiba Jobin Yvon). The samples were excited with a 450 W xenon source dispersed by a double-grating monochromator. The slit width set bandpass of the excitation and emission beams were both set to 10 nm. PL spectra were collected using a liquid-N2 cooled linear InGaAs array detector. The emission spectra were collected with excitation light at the E22 wavelength of each specific chirality. The integration time was 2 s to 10 s. The absorption spectroscopy was performed using a PerkinElmer Lambda 1050 spectrophotometer with a broadband InGaAs detector.Data availability
The data that support the findings of this study are available from the corresponding author on reasonable request.Author contributions
Y. H. W. and N. R. A. conceived and directed the research. A. R. performed TDDFT, MD and AIMD simulations. H. Q. performed the experiments. All authors contributed to data analysis. A. R. and N. R. A. wrote the manuscript with input from all co-authors.Conflicts of interest
The authors have no conflicts to disclose.Acknowledgements
This work is supported as a part of the Center for Enhanced Nanofluidic Transport (CENT), an Energy Frontier Research Center funded by the U.S. Department of Energy, Office of Science, Basic Energy Sciences under award no. DE-SC0019112. We also acknowledge the Texas Advanced Computing Center (TACC) at The University of Texas at Austin for providing the computing resources on Stampede2, Frontera, and Lonestar6 under allocation no. TG-CDA100010, DMR20002, and DMR22008, respectively.References
- G. Li and P. Bai, New operation strategy for separation of ethanol–water by extractive distillation, Ind. Eng. Chem. Res., 2012, 51, 2723–2729 CrossRef CAS.
- M. Gavahian, A. Farahnaky and S. Sastry, Ohmic-assisted hydrodistillation: A novel method for ethanol distillation, Food Bioprod. Process., 2016, 98, 44–49 CrossRef CAS.
- P. García-Herreros, J. M. Gómez, I. D. Gil and G. Rodríguez, Optimization of the design and operation of an extractive distillation system for the production of fuel grade ethanol using glycerol as entrainer, Ind. Eng. Chem. Res., 2011, 50, 3977–3985 CrossRef.
- T. M. Boudreau and G. A. Hill, Improved ethanol–water separation using fatty acids, Process Biochem., 2006, 41, 980–983 CrossRef CAS.
- L. M. Vane, F. R. Alvarez, Y. Huang and R. W. Baker, Experimental validation of hybrid distillation–vapor permeation process for energy efficient ethanol–water separation, J. Chem. Technol. Biotechnol., 2010, 85, 502–511 CAS.
- J. Abraham, et al. Tunable sieving of ions using graphene oxide membranes, Nat. Nanotechnol., 2017, 12, 546–550 CrossRef CAS PubMed.
- R. H. Tunuguntla, et al. Enhanced water permeability and tunable ion selectivity in subnanometer carbon nanotube porins, Science, 2017, 357, 792–796 CrossRef CAS PubMed.
- C. Sun, S. Zhu, M. Liu, S. Shen and B. Bai, Selective molecular sieving through a large graphene nanopore with surface charges, J. Phys. Chem. Lett., 2019, 10, 7188–7194 CrossRef CAS PubMed.
- R.-B. Lin, et al. Molecular sieving of ethylene from ethane using a rigid metal–organic framework, Nat. Mater., 2018, 17, 1128–1133 CrossRef CAS PubMed.
- R. Joshi, et al. Precise and ultrafast molecular sieving through graphene oxide membranes, Science, 2014, 343, 752–754 CrossRef CAS PubMed.
- Q. Yang, et al. Ultrathin graphene-based membrane with precise molecular sieving and ultrafast solvent permeation, Nat. Mater., 2017, 16, 1198–1202 CrossRef CAS PubMed.
- L. Ding, et al. MXene molecular sieving membranes for highly efficient gas separation, Nat. Commun., 2018, 9, 1–7 CrossRef PubMed.
- D. Takaiwa, E. Yamamoto and K. Yasuoka, Separation of water–ethanol solutions with carbon nanotubes and electric fields, Phys. Chem. Chem. Phys., 2016, 18, 33310–33319 RSC.
- S. Gravelle, H. Yoshida, L. Joly, C. Ybert and L. Bocquet, Carbon membranes for efficient water-ethanol separation, J. Chem. Phys., 2016, 145, 124708 CrossRef PubMed.
- M. F. De Volder, S. H. Tawfick, R. H. Baughman and A. J. Hart, Carbon nanotubes: present and future commercial applications, Science, 2013, 339, 535–539 CrossRef CAS PubMed.
- L. Xue, et al. Solid-state nanopore sensors, Nat. Rev. Mater., 2020, 5, 931–951 CrossRef CAS.
- H. Qu, et al. Selective filling of n-hexane in a tight nanopore, Nat. Commun., 2021, 12, 1–8 CrossRef PubMed.
- D. K. Chaudhary, et al. Sensing Performance of a ZnO-based Ammonia Sensor, J. Phys. Sci., 2022, 33, 97–108 CrossRef CAS.
- T. La Rocca, et al. Purification of pharmaceutical solvents by pervaporation through hybrid silica membranes, Membranes, 2019, 9, 76 CrossRef CAS PubMed.
- S.-T. Lin, P. K. Maiti and W. A. Goddard III, Two-phase thermodynamic model for efficient and accurate absolute entropy of water from molecular dynamics simulations, J. Phys. Chem. B, 2010, 114, 8191–8198 CrossRef CAS PubMed.
- I. Chorkendorff and J. W. Niemantsverdriet, Concepts of modern catalysis and kinetics, John Wiley & Sons, 2017 Search PubMed.
- N. R. Aluru, et al. Fluids and Electrolytes under Confinement in Single-Digit Nanopores, Chem. Rev., 2023, 2737–2831 CrossRef CAS PubMed.
- A. Labropoulos, et al. Carbon nanotube selective membranes with subnanometer, vertically aligned pores, and enhanced gas transport properties, Chem. Mater., 2015, 27, 8198–8210 CrossRef CAS.
- M. Lokesh, S. K. Youn and H. G. Park, Osmotic transport across surface functionalized carbon nanotube membrane, Nano Lett., 2018, 18, 6679–6685 CrossRef CAS PubMed.
- W. Puthai, M. Kanezashi, H. Nagasawa and T. Tsuru, Nanofiltration performance of SiO2-ZrO2 membranes in aqueous solutions at high temperatures, Sep. Purif. Technol., 2016, 168, 238–247 CrossRef CAS.
- R. R. Sharma, R. Agrawal and S. Chellam, Temperature effects on sieving characteristics of thin-film composite nanofiltration membranes: pore size distributions and transport parameters, J. Membr. Sci., 2003, 223, 69–87 CrossRef CAS.
- R. Epsztein, R. M. DuChanois, C. L. Ritt, A. Noy and M. Elimelech, Towards single-species selectivity of membranes with subnanometre pores, Nat. Nanotechnol., 2020, 15, 426–436 CrossRef CAS PubMed.
- I. Shefer, K. Lopez, A. P. Straub and R. Epsztein, Applying transition-state theory to explore transport and selectivity in salt-rejecting membranes: A critical review, Environ. Sci. Technol., 2022, 56, 7467–7483 CrossRef CAS PubMed.
- S. Plimpton, Fast parallel algorithms for short-range molecular dynamics, J. Comput. Phys., 1995, 117, 1–19, DOI:10.1006/jcph.1995.1039.
- W. L. Jorgensen, D. S. Maxwell and J. Tirado-Rives, Development and testing of the OPLS all-atom force field on conformational energetics and properties of organic liquids, J. Am. Chem. Soc., 1996, 118, 11225–11236, DOI:10.1021/ja9621760.
- D. J. Price and C. L. Brooks III, A modified TIP3P water potential for simulation with Ewald summation, J. Chem. Phys., 2004, 121, 10096–10103 CrossRef CAS PubMed.
- S. J. Stuart, A. B. Tutein and J. A. Harrison, A reactive potential for hydrocarbons with intermolecular interactions, J. Chem. Phys., 2000, 112, 6472–6486, DOI:10.1063/1.481208.
- J. E. Jones, On the determination of molecular fields. II. from the equation of state of a gas, Proc. R. Soc. A, 1924, 106, 463–477, DOI:10.1098/rspa.1924.0082.
- G. Kresse and J. Furthmüller, Efficient iterative schemes for ab initio total-energy calculations using a plane-wave basis set, Phys. Rev. B: Condens. Matter Mater. Phys., 1996, 54, 11169–11186, DOI:10.1103/PhysRevB.54.11169.
- J. P. Perdew, K. Burke and M. Ernzerhof, Generalized gradient approximation made simple, Phys. Rev. Lett., 1996, 77, 3865–3868, DOI:10.1103/PhysRevLett.77.3865.
Footnote |
| † Electronic supplementary information (ESI) available. See DOI: https://doi.org/10.1039/d3nr02768f |
| This journal is © The Royal Society of Chemistry 2023 |