
 Open Access Article
 This Open Access Article is licensed under a Creative Commons Attribution-Non Commercial 3.0 Unported Licence
A safer framework to evaluate characterization technologies of exhaled biologic materials using electrospun nanofibers†
David T.
Evans
 ,
Dalton J.
Nelson
,
Megan E.
Pask
and
Frederick R.
Haselton
*
,
Dalton J.
Nelson
,
Megan E.
Pask
and
Frederick R.
Haselton
*
Department of Biomedical Engineering, 5824 Stevenson Center, Vanderbilt University, Nashville, TN 37232, USA. E-mail: rick.haselton@vanderbilt.edu
First published on 25th August 2023
Abstract
Exhaled biologic material is the source for the spread of many respiratory tract infections. To avoid the high-level of biosafety required to manage dangerous pathogens, we developed a safer framework using the endogenous surrogate targets RNase P and Streptococcus mitis as a means to sample exhaled biologics. Our exhalation collection scheme uses nanoscale fibrous poly(vinyl alcohol) substrates as facemask inserts. After a period of breathing or speaking, the inserts are removed and dissolved. RNase P RNA and S. mitis DNA are extracted for quantification by multiplexed RT-qPCR. Both surrogate biomarkers were detected in all samples obtained during breathing for at least five minutes or speaking for one minute. Phrases repeated 30 times had the most copies with 375 ± 247 of S. mitis and 54 ± 33 of RNase P. When the phrases were repeated just 5 times, the S. mitis copies collected were still detectable but at a significantly lower level of 11 ± 5 for S. mitis and 12 ± 9 for RNase P. These results demonstrate a collection and quantification framework that can be readily adapted to further characterize the exhalation of nanoscale biologic materials from healthy individuals, explore new collection designs safely, and serve as a method to incorporate sample controls for future pathogen exhalation studies.
Introduction
Exhaled biologic materials are the source for the spread of many respiratory tract infections. However, the emergence of the SARS-CoV-2 virus that ignited the COVID-19 pandemic drew widespread attention to the lack of methods for measuring the exhalation characteristics of this new virus.1–4 One of the reasons that research facilities struggled to adequately diagnose, monitor, and study the spread of this disease was safety concerns with handling potentially infectious samples. A balance of protecting researchers and obtaining necessary public health knowledge brought investigation to a standstill.5–7 A simple, non-pathogenic framework for quantification of exhaled biologic materials from healthy volunteers in advance of the next pandemic would save time, qualify more eligible volunteers, and have minimal safety concerns while still providing a pathway for improving technologies to characterize exhaled pathogens.An ideal framework requires four essential components: safer targets, simple collection systems that work with all masks, basic reproducible respiratory maneuvers, and a highly sensitive detection scheme for DNA and RNA biomarkers of exhaled biologics. S. mitis and RNase P are two promising safer exhalation surrogates for bacterial and viral pathogens, respectively. S. mitis is a commensal bacteria abundantly present in the respiratory tract.8–10 It has previously been shown that exhaled breath from healthy volunteers carries microorganisms from the respiratory tract, thus indicating S. mitis has the potential to be collected in exhaled breath.11 A benign respiratory viral RNA endogenous to all humans would be ideal as a surrogate viral pathogen. Potential candidates include Epstein–Barr virus and Cytomegalovirus, however, both are DNA viruses and neither one is common to a high percentage of the population. Instead, we used RNA that encodes for the human RNase P enzyme as an RNA biomarker since it is present in all human cells. Furthermore, it is commonly used as a human sample control in PCR detection assays.12,13 The endogenous nature of both targets in almost all humans opens the volunteer pool to healthy candidates for a given study by avoiding limiting participants to only patients diagnosed with the disease.
A simple collection method is also needed, and in this framework, we used electrospun poly(vinyl alcohol) (PVA) inserts in a facemask. PVA is a well characterized polymer widely used for biomedical applications due to its tailorable properties and biocompatibility.14–17 The nanosized fibers produced by electrospinning form a fine, porous substrate to collect biologic materials with natural respiratory maneuvers, namely, exhaled breath or speech. The unmodified PVA fibers produce a high surface area to volume ratio which allows for collection of exhaled biologics by entrapment within the porous substrate and physisorption to the polymeric fibers.18–22 The solubility of nanoscale PVA fibers in water is an additional property that can be tuned to integrate with highly sensitive standard sample preparation and RT-qPCR methods available in well-equipped laboratories. These properties allow quantitative analysis of multiple target nucleic acid sequences in a sample even when very few copies are present. Annealing the PVA electrospun substrates with heat has been shown to increase the crystallinity of the polymeric structure thus decreasing the solubility to varying degrees based on time and temperature.23 After collection, mask inserts are processed to extract DNA or RNA and then RT-qPCR is used to quantify the collected endogenous surrogates (Fig. 1). The properties of PVA, namely non-toxic, ease of manufacturing in a high surface to area to volume form, adjustable water solubility, and compatibility with PCR, make it an excellent material for use in a respiratory collection system.
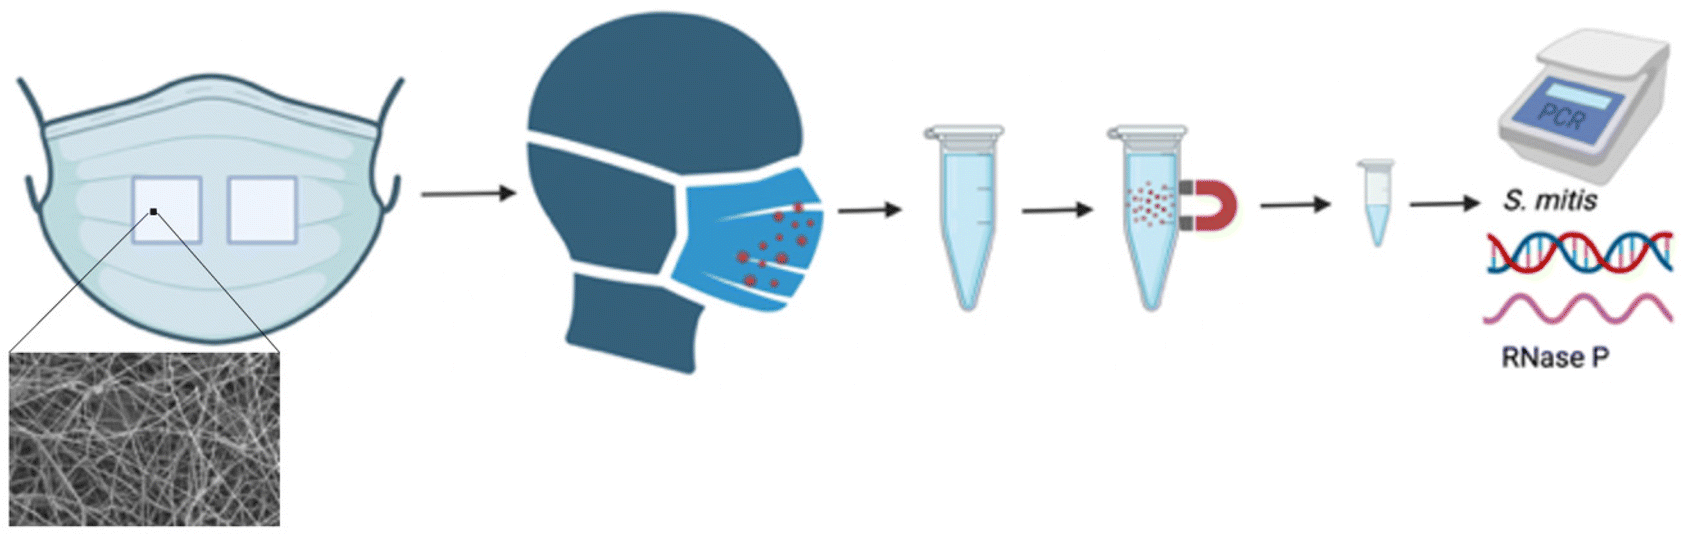 | ||
| Fig. 1 Overall schematic of exhaled biologic collection within a facemask on electrospun PVA inserts which are then processed through magnetic bead extraction of targets for subsequent detected by PCR. | ||
To demonstrate the utility of this framework, we recruited healthy volunteers to provide respiratory samples and sought to answer four basic questions: (1) Are S. mitis and RNase P biomarkers detectable from exhaled breath? (2) What is the simplest respiratory maneuver needed to detect exhaled materials? (3) How long must a mask be worn to quantitatively detect exhaled material? (4) Is a surgical or N95 mask more effective for quantification of exhaled materials?
Materials and methods
Production of electrospun PVA substrates
The electrospinning set-up is shown in Fig. S1.† PVA with a molecular weight (MW) of 205 kDa and a degree of hydrolysis (DH) of 88% (Sigma #324590) was dissolved in nuclease-free deionized water to produce a 12% w/w solution in water. PVAs with higher degrees of hydrolysis (98%+) were not used due to a lack of water solubility. Lower molecular weight PVA did not produce proper electrospun fibers but instead deposited as a thin film or small droplets. The PVA suspension was placed on a stir plate overnight at 85 °C to fully dissolve the polymer. The final solution was then left to cool to room temperature while any bubbles rose out of solution. The PVA solution was loaded into a 5 mL syringe attached to Tygon® tubing that split into two lines with a 1/2′′ 21-gauge blunt tip needle at each end. The tubing was primed until the solution reached the needles and the syringe was placed on a syringe pump (New Era Pump Systems Inc.) which was set to dispense the PVA solution at 1.5 mL h−1 (0.75 mL per h per needle tip). The needles were fixed 20 cm from a 12′′ × 12′′, 1/8′′ thick, mirror finished stainless steel plate that was connected to ground. An electrode was attached to each needle and charged with 30 kV from a high voltage power supply (Gamma High Voltage Research, Inc.) to produce nanofibers deposited onto the stainless-steel plate (Fig. S1†). Every 75 minutes, the power supply was briefly shut off and the steel plate was rotated 90 degrees for a total of four rotations across 5 hours to evenly deposit the fibers on the plate. The syringe was replaced with a new full syringe during the 150-minute rotation. The final deposited fiber sheet was peeled off and placed between two pieces of aluminium foil for safe storage.According to the methods used by Wong, et al., the electrospun PVA was annealed by heating for 2 hours to provide stability for the humid mask environment. Annealing at too high a temperature crystallizes the polymer to a point where it can no longer be dissolved during the later extraction steps.23 The electrospun PVA sheets were annealed at 85 °C or 120 °C under vacuum for 2 hours to test which would produce properly stable and soluble substrates. Once cooled, the PVA substrates were cut into 1′′ × 1′′ squares to fit two inserts contralaterally in two common facemask types, surgical and N95 (Fig. S1†). To test stability, inserts were worn inside a facemask and breathed through while wearing for 30 minutes as a realistic replicate environment of what the inserts will be exposed to during collection periods. Subsequently, they were processed in the same way as the first step of the extraction protocol (outlined below) by dissolving in 560 μL of buffer AVL (Qiagen #19073) to test solubility.
Scanning electron microscope (SEM) imaging
To ensure nanofiber formation, 5 mm × 5 mm samples of the electrospun PVA were cut out and adhered to SEM pin stub mounts with double-sided carbon tape. Each sample was then gold sputter coated using a Cressington 108 Sputter Coater at 30 mA for 20 seconds. The sputter-coated samples were imaged on a Zeiss Merlin SEM with a Gemini II column at 3 kV from a 5 mm working distance (Fig. S1†). All fiber diameter and pore size measurements were taken using ImageJ software. Thirty fiber diameter and thirty pore size measurements were taken from three different electrospun PVA samples.RT-qPCR
All samples were analyzed in duplicate on a Rotor-Gene Q real-time PCR cycler (Qiagen, Germantown, MD) in a multiplexed reverse transcription PCR reaction that detects both RNase P and S. mitis. In 0.2 mL thin-walled microcentrifuge PCR tubes, 20 μL PCR samples were composed of 16 μL of PCR mix solution and 4 μL of extracted sample. The PCR mix solution was prepared in bulk for the whole PCR run immediately before aliquoting and adding the extracted samples. All primers and probes were sourced from Integrated DNA Technologies (IDT, Coralville, IA). The solution was composed of 1× Luna® Universal probe one-step reaction mix (New England Biolabs, Inc., cat. #E3006S), 1× RNase P 2019_nCoV CDC EUA kit primer/probe mix labeled with FAM (cat. #10006770), 400 nM S. mitis forward primer, 400 nM S. mitis reverse primer, 200 nM S. mitis probe, and 1× Luna® WarmStart® RT enzyme mix. In the few cases where amplification of no template controls occurred, the same extracted samples were tested again to ensure there was no contamination or non-specific amplification.The RNase P primer and probe sequences from the CDC kits are as follows: forward primer – 5′-AGA TTT GGA CCT GCG AGC G-3′, reverse primer – 5′-GAG CGG CTG TCT CCA CAA G-3′, probe: 5′-(FAM)TTC TGA CCT(TAO) GAA GGC TCT GCG CG (IAbRQSp)-3′. The S. mitis primers and probe were designed based on sequences from a prior study with one modification of a mixed base ‘S’ to detect two strains.24 This modification was based on amplicon mapping to the bacterial genome GenBank® [AJ582646.1] because the mixed base primer showed the best results in preliminary PCR testing (data not shown). The sequences are as follows: forward primer – 5′-GCC ATT GAA GCS GTT ACT TTG-3′, reverse primer – 5′-CAT CCG ACA TTA ACG CAA GTT C-3′, probe – 5′-(HEX)ATG ATT GAG (ZEN)CGT GGA ACG GTG GGT(IABkFQ)-3′.
The samples were incubated at 55 °C for 15 minutes for the reverse transcription step. This was followed by a 2-minute denaturing step at 95 °C. Finally, the samples were cycled through melting and annealing/extending steps 45 times at 95 °C for 10 seconds and 60 °C for 40 seconds respectively. Fluorescence measurements were taken on the green (470/510 nm) and yellow (530/555 nm) channels.
Analytical performance
To evaluate the analytical sensitivity of this PCR reaction, quantitative standards prepared by serial dilutions from synthetic S. mitis DNA (IDT) and RNase P RNA (Biosynthesis) targets were spiked directly into the assay at a range of copies. S. mitis and RNase P were tested independently of one another from 107 copies down to 100 copy per reaction. Subsequently, the analytical sensitivity tests were repeated in the presence of 105 copies of the opposite target to test potential cross target detection or exhaustion of reaction components.Efficiency of biomarker extraction from mask inserts
To test the performance of the RNA and DNA extraction process from the mask inserts, 2 × 10³ copies of both RNase P and S. mitis were directly spiked onto an insert and processed by the above protocol. Alongside this extraction, the same amount of target was spiked directly into a different extraction tube as a comparator. Control samples with the mask insert but no target and no insert or target were also included. RT-qPCR was used to quantify the extraction efficiencies.Respiratory maneuvers
Mask samples worn by healthy volunteers were collected and de-identified under Vanderbilt University's Institutional Review Board #212208. Volunteers were divided into two categories: breathing and speaking. The speaking individuals were asked to repeat the following phrases either 5 or 30 times.“We will beat the coronavirus…
…sing a song of six pence…
…Peter Piper picked a peck.”
These phrases were selected based on a previous study that analyzed the airflow patterns produced while speaking plosives that produce directed transport in the form of approximately conical turbulent jets.25 The non-speaking individuals were asked to wear the mask for 5 or 30 minutes while simply breathing. Each volunteer was asked to complete their tasks twice, once while wearing a N95 mask (3 M) and once while wearing a surgical mask (Eco Pack). Upon completion, each mask insert was dissolved in a separate 560 μL aliquot of buffer AVL, left to incubate at room temperature for 10 minutes, and then stored at 4–8 °C. Any unexpected respiratory events such as sneezing, coughing, and unplanned speech were recorded, however none occurred of significant consideration. Finally, each volunteer provided a saliva sample to serve as an oral cavity reference value.
Extraction of RNA and DNA biomarkers
Due to the volume and viscosity of a solution used to dissolve the mask inserts, typical DNA and RNA isolation methods, such as spin columns, were not used. Instead, samples were processed for extraction and concentration of RNA and DNA using MyOne™ Silane Dynabeads™ (Invitrogen, #37002D) with a similar method as previously described.26,27 The samples of worn mask inserts previously dissolved in a viral lysis buffer (Qiagen Buffer AVL, #19073) were removed from the fridge and brought to room temperature. Once at room temperature, 560 μL of 100% ethanol, 5.6 μL 2-mercaptoethanol, and 20 μL Dynabeads™ MyOne™ silane magnetic beads were added to the sample and thoroughly mixed by vortexing to capture any RNA and DNA. The magnetic beads were isolated on the side of the tube using a magnetic tube rack and the supernatant was removed. The magnetic beads were resuspended in 1 mL of a wash solution composed of 16% binding buffer [4 M guanidine thiocyanate, 10 mM Tris HCl (pH 8), 1 mM ethylenediamine tetraacetic acid (EDTA, pH 8), and 0.5% Triton X-100] in ethanol. The magnetic beads were again isolated to remove the supernatant and washed with a 70% ethanol solution. Finally, the RNA and DNA were eluted into 50 μL of molecular grade water and the magnetic beads were removed. Saliva samples were processed in the same manner, except 5 μL of the saliva was added to buffer AVL instead of the mask insert. Extracted samples were stored at 4–8 °C until they were ready to be analyzed by PCR.Results
Electrospun PVA
Using SEM to image the electrospun substrates, fiber formation was clearly visualized in all samples (Fig. 2). The average diameter of the fibers was 335.9 ± 68.2 nm2. The average pore size between the fibers was 5.46 ± 2.59 μm2. This small scale, porous structure increases the surface area which is beneficial for dissolving the PVA during the extraction process.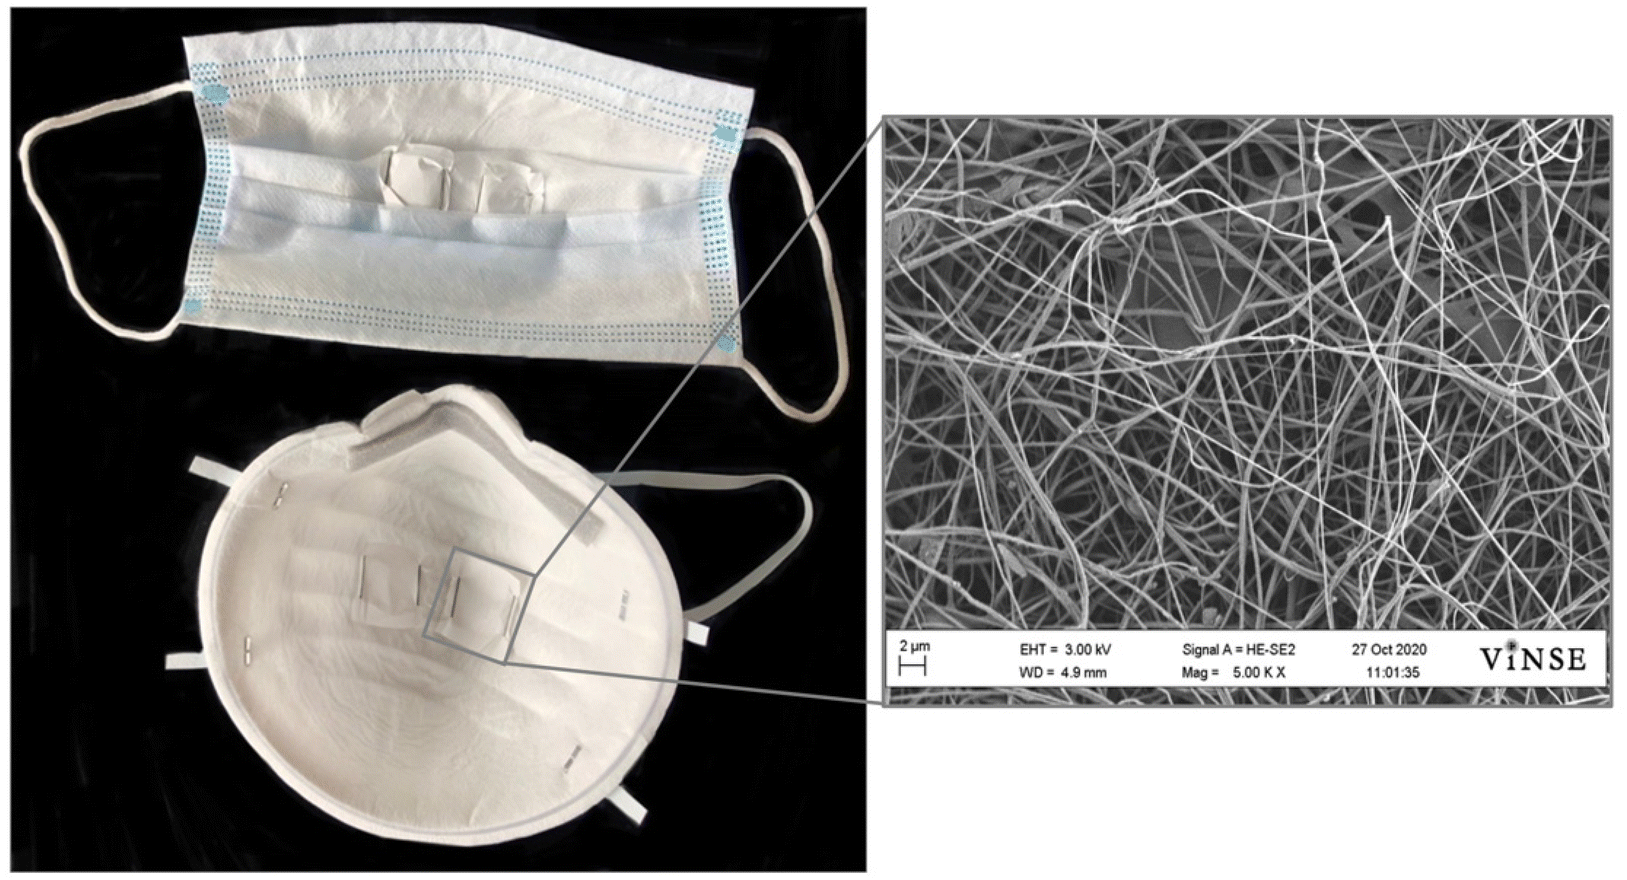 | ||
| Fig. 2 Two contralateral mask inserts fixed in a surgical (top) and N95 (bottom) mask for sample collection. A blown-up SEM image (right) shows the fibrous and porous properties of the electrospun PVA (scale bar = 2 μm). | ||
When not annealed, the electrospun PVA shrinks by approximately 70% after being worn for 30 minutes in a humid mask environment (Fig. 3). When annealed at 120 °C, the insert withstands the humid environment and no noticeable shrinkage occurs, however, the insert is no longer soluble for DNA and RNA extraction. When the electrospun PVA is annealed at a lower temperature of 85 °C, shrinkage is minimized to 15% and dissolves with no issues similar to when no annealing occurs.
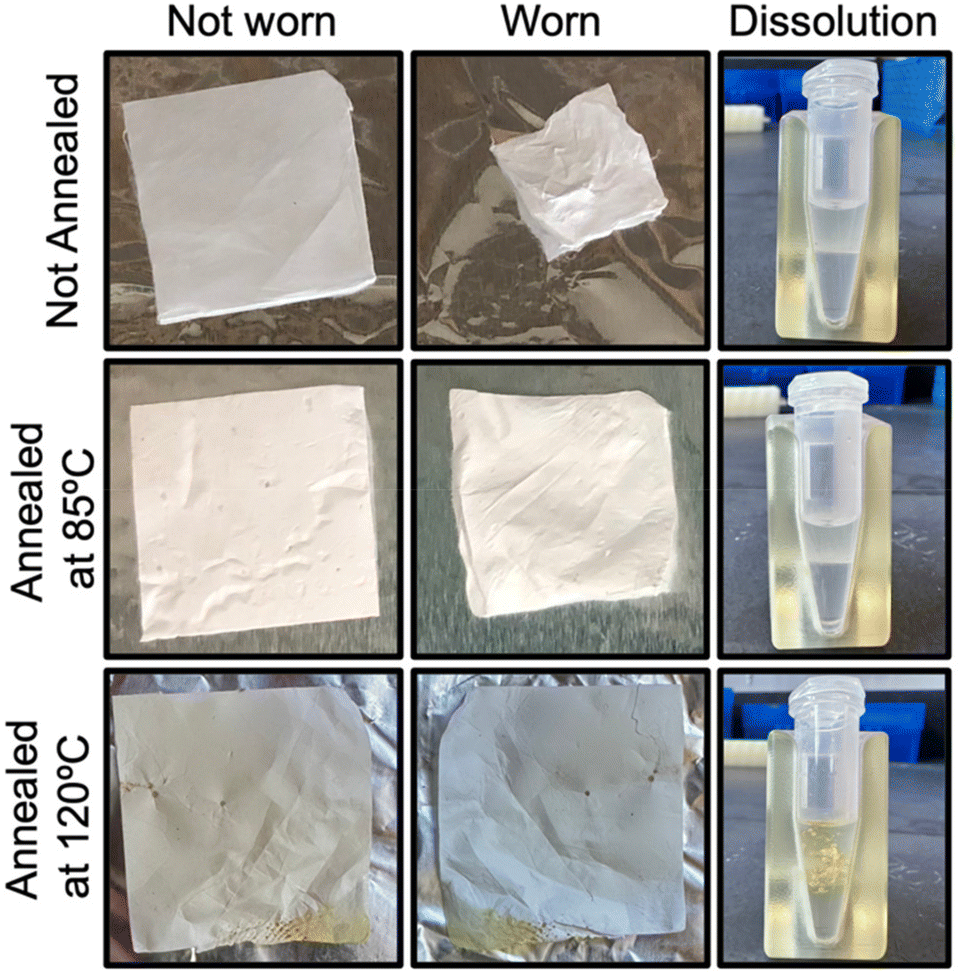 | ||
| Fig. 3 Effect of annealing conditions on insert shrinkage and solubility. The top row was not annealed while the second and third rows were annealed at 85 °C and 120 °C respectively. The second column shows the insert shrinkage after exposure to a worn facemask. | ||
PCR assay analytical sensitivity
To test the primer and probe sets for S. mitis and RNase P detection in the multiplexed RT-qPCR assay, analytical sensitivity experiments were performed for targets ranging from 107 copies down to 100 copies per reaction. Each target was investigated independently, without the presence of the opposite target. These results showed consistent detection down to one copy for both targets with one outlier in the 101S. mitis samples (Fig. 4A & B). Furthermore, when 105 copies of the other target were spiked into the reaction, the assay still consistently detected one copy (Fig. 4C).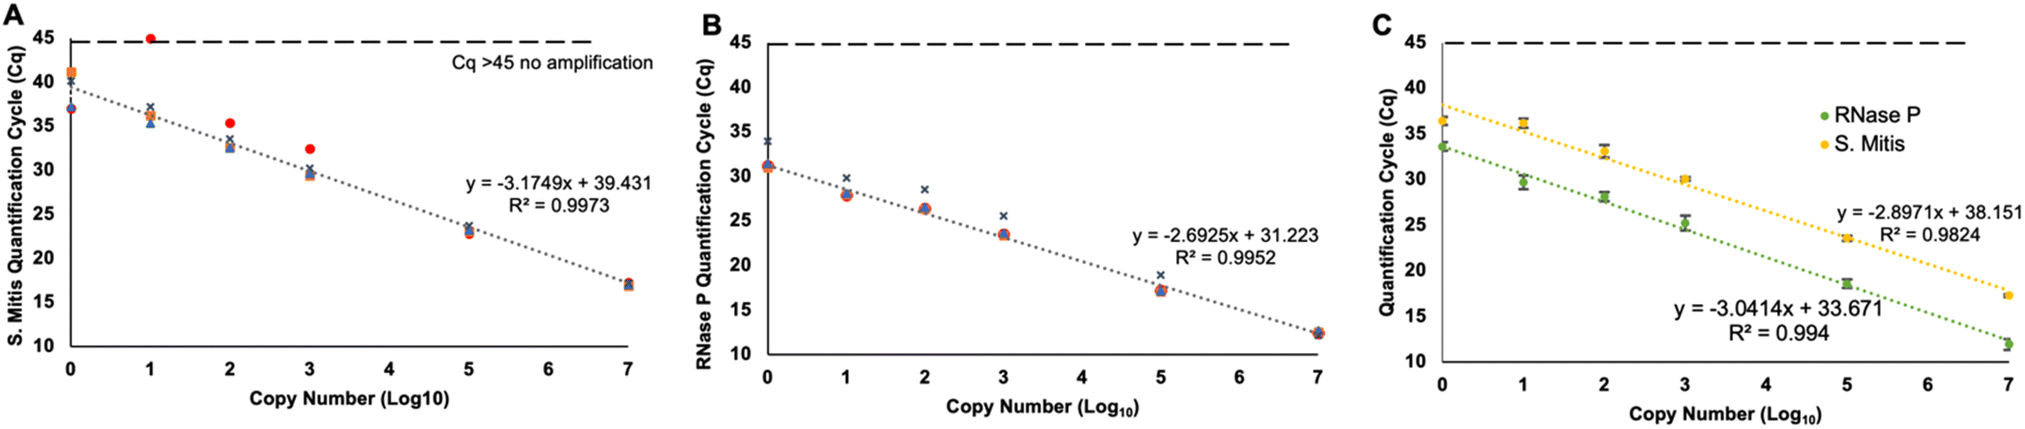 | ||
| Fig. 4 Analytical sensitivity of RT-qPCR biomarkers. S. mitis (A) and RNase P (B) multiplex PCR detection results with targets run separately (n = 4, all replicates shown). Average detection results with 105 copies of the opposite target spiked into the reaction (C) (n = 3, mean ± s.d.). | ||
Efficiency of biomarker extraction from mask inserts
When evaluating the extraction process from the mask inserts, 2 × 10³ copies of each surrogate target were spiked into the samples prior to extraction. Once the extraction is performed and eluted into 50 μL, 4 μL of the elution is used in each PCR reaction. That means, each PCR reaction theoretically contained a maximum of 160 copies of each target. Fig. 5 shows 28 ± 6.6 copies of RNase P and 52 ± 7.7 copies of S. mitis were recovered from spiking the target directly into the sample prior to extraction resulting in 17.8% and 32.2% extraction efficiencies respectively. Thirty-two ± 6.6 copies of RNase P and 59 ± 6.6 copies of S. mitis were recovered from the mask inserts resulting in 19.8% and 36.8% extraction efficiencies, respectively. There was no statistical difference between these recoveries and the recoveries of the controls.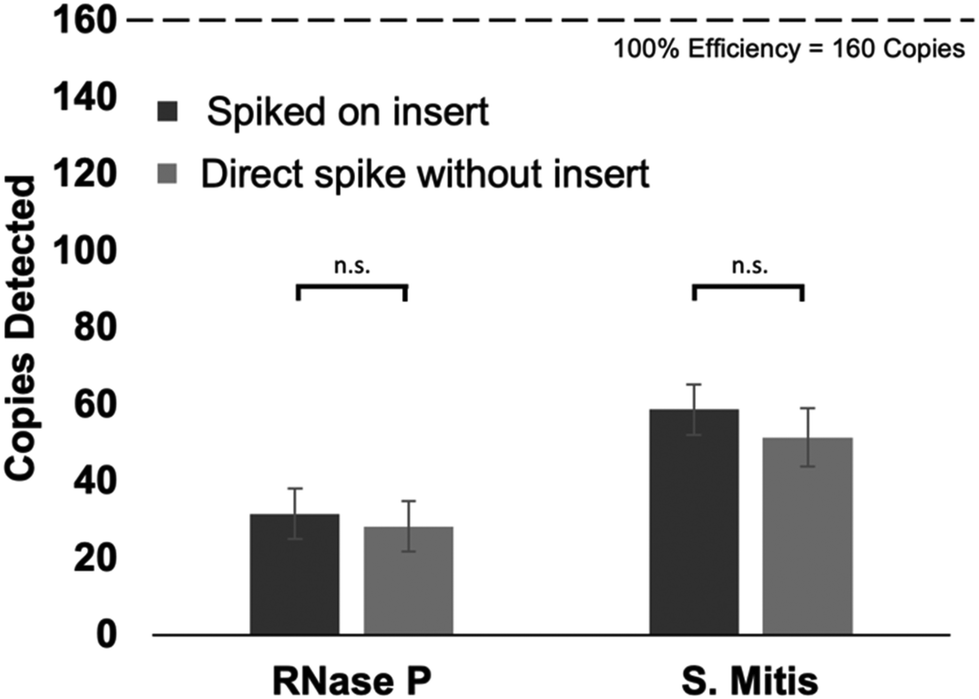 | ||
| Fig. 5 Copies detected after spiking 2 × 10³ copies of synthetic RNase P RNA (left) and S. mitis DNA (right) onto mask inserts (dark grey) or directly into the extraction buffer (light grey). No significant difference was revealed between samples of the same target with or without the insert (n = 3, mean ± SD, paired T-test, α = 0.05). | ||
Detection of S. mitis and RNase P in healthy volunteer samples
For the healthy volunteer samples collected from each set of breathing (5 or 30 minutes) and speaking (5× and 30× phrases) groups, both biomarkers were detectable by multiplexed RT-qPCR. The histogram of the quantification cycles (Cq) shows the range of detection for these sample (Fig. 6). For each surrogate target, 30 samples are displayed resulting from two sample per patient, one for each mask type. The saliva samples for the two targets have 15 values each, one for each volunteer. These include two volunteers, one 10-minute breathing and one 10× speaking, not included in later figures because these groups were incomplete.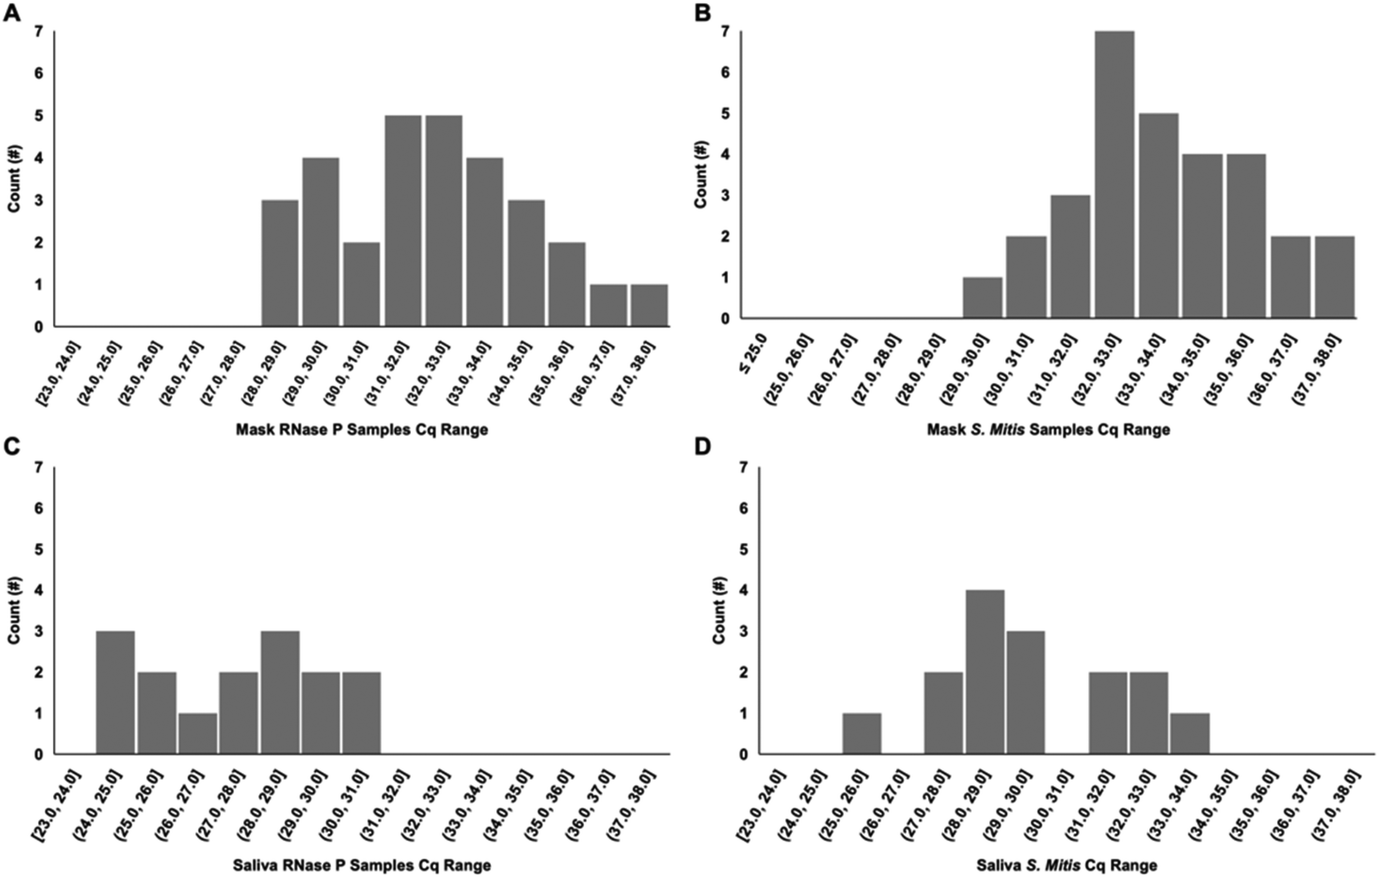 | ||
| Fig. 6 Distribution of RT-qPCR Cq values for samples collected from healthy volunteers. Histograms of the results for all RNase P (A) and S. mitis (B) mask samples (n = 30) and all RNase P (C) and S. mitis (D) saliva samples (n = 15). | ||
Saliva samples were taken from each volunteer along with their exhaled breath samples. Fig. 7 and Fig. S2† shows the relationship between the copies detected in the saliva samples and the mask samples for each volunteer. While each individual point is one volunteer sample, groups of the same collection parameter are connected with a line based on mask type, speaking, or breathing, and collection time (5 and 10 minutes for breathing or 5× or 10× for speaking).
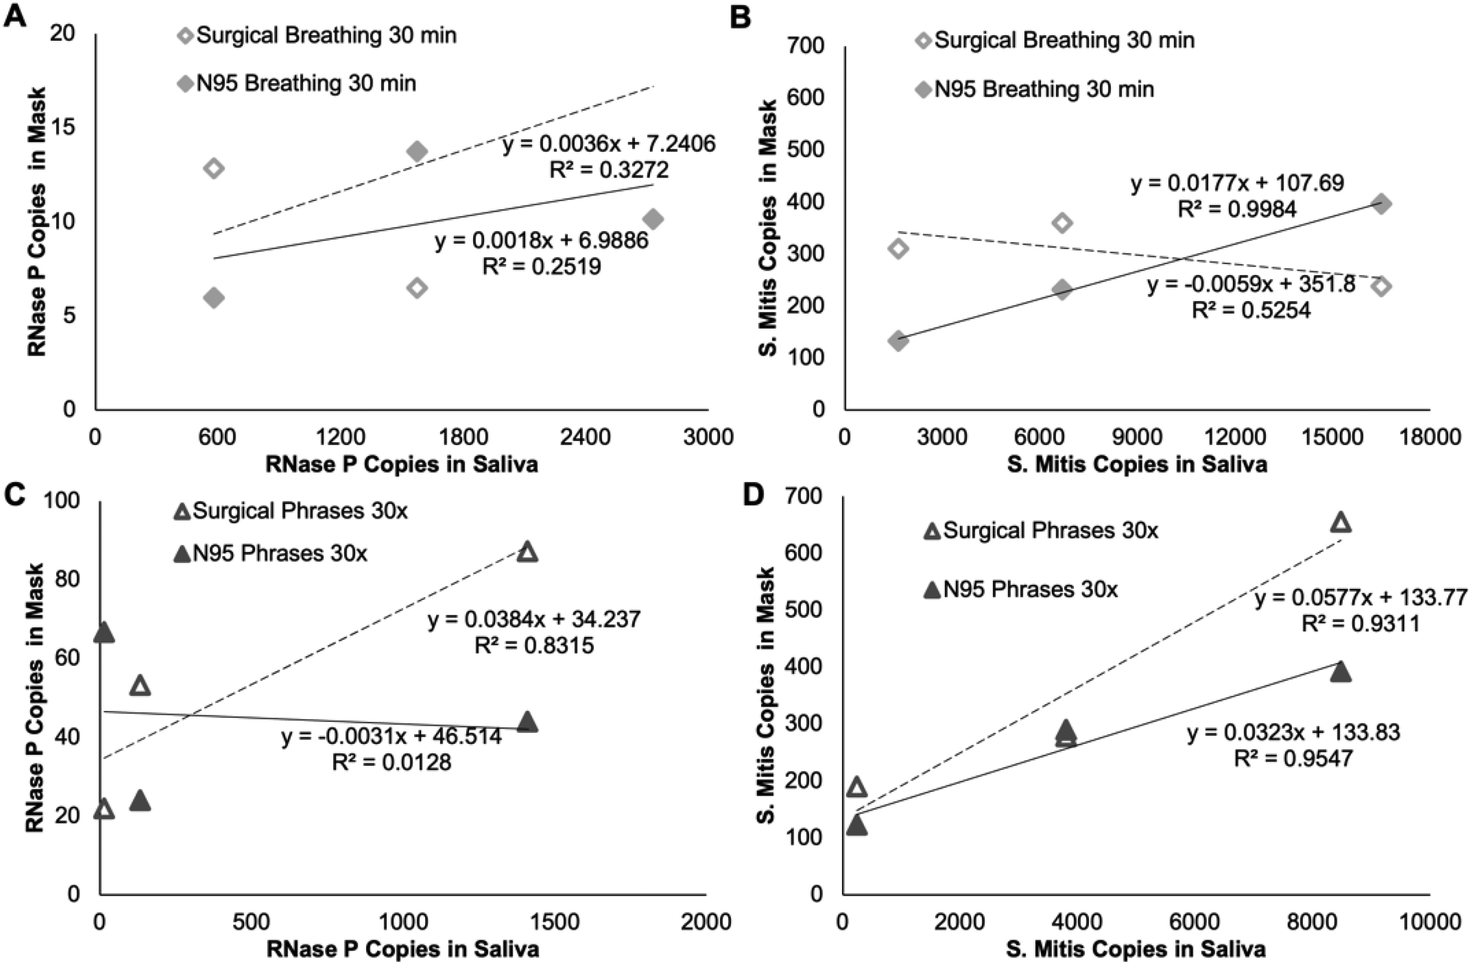 | ||
| Fig. 7 Comparison of RNase P (A & C) and S. mitis (B & D) copies detected in saliva vs. mask type. Plots A & B are of the 30 minutes breathing samples and plots C & D are of the 30× speaking samples. Each point is a different individual and trend lines are grouped by mask type with the hollow points and dashed lines representing surgical masks and the solid points and lines representing N95 masks. See Fig. S2† for 5 minutes and 5× phrases data. | ||
Processing the worn mask inserts yielded 50 μL of extracted RNA and DNA biomarkers. Of this extract, 4 μL was used in the 20 μL PCR reaction. Therefore, the actual number of copies collected on a mask insert is 12.5× the number detected in the corresponding PCR reaction. The number of RNase P and S. mitis copies detected in the PCR reactions is reported in Fig. 8 separating them out based on each parameter: breathing vs. speaking, time worn or number of spoken phrases, and mask type. Breath samples show no statistical difference between 5 minutes and 30 minutes of collection time for either target. The controlled speech samples show a statistical difference for both RNase P and S. mitis between the 5 and 30 repeated phrases with a clear increase in copies collected when the phrases were spoken more times. For breathing samples, after normalizing the results to the number of copies detected in saliva for a given individual, only the S. mitis target collection in an N95 mask was significantly different between collection times. After normalizing the speaking samples to the saliva samples, no significant differences were observed.
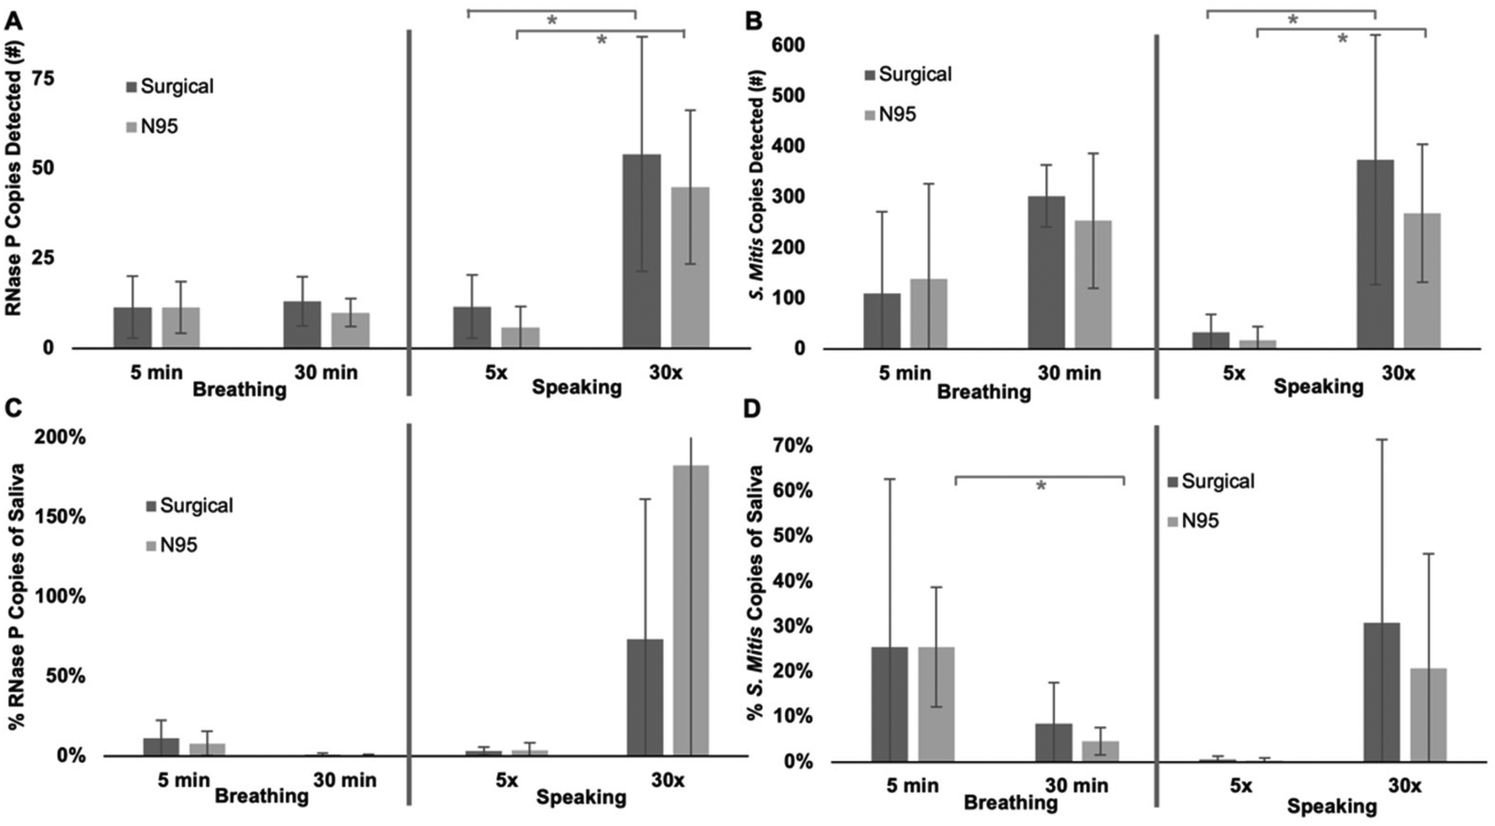 | ||
| Fig. 8 Effect of respiratory maneuver and mask type on copies detected. Each graph is split in half with breathing groups on the left and speaking groups on the right. Breathing has samples of 5 and 30 minutes collection periods while speaking has samples where volunteers repeated the phrases 5 and 30 times. Within each subgroup, data bars show surgical (dark grey) and N95 (light grey) collection data. The top two graphs show the number of copies detected in a single PCR reaction (8% of the total copies collected) with RNase P in plot A and S. mitis in plot B. The bottom two graphs show the data normalized to the number of copies detected in saliva samples from each volunteer with RNase P (C) and S. mitis (D) (n = 3 for all samples except 5 minutes breathing samples n = 4, CI = 95%, standard deviation error bars, error bars on graph C were too large to fit on a reasonably scaled graph). | ||
Discussion
The goal of this study was to develop and demonstrate a simple framework to study the exhalation of biologic materials from the human respiratory tract while avoiding direct handling of known infectious samples. Other respiratory disease monitoring systems directly detect potential infectious pathogens that require high safety overhead to protect the researchers and, furthermore, often have complex collections systems. (1) We found that RNase P and S. mitis were suitable surrogates contained in the exhaled breath of all healthy volunteers. (2) These surrogates were collected with electrospun PVA during simple breathing and speaking maneuvers and produced quantifiable targets when coupled with extraction and RT-qPCR detection. (3) Detectable levels of target were reached while breathing for just five minutes or speaking for less than one minute but speaking for longer periods of time significantly increased the detection level. (4) The mask type, surgical or N95, did not significantly affect the collection in a quantifiable way.Data collected from volunteer exhaled breath and controlled speech samples suggests RNase P and S. mitis are omnipresent endogenous targets that produce detectable levels in short collection times (Fig. 6). These results indicate they can be used as surrogates for respiratory pathogens when conducting studies to characterize exhaled biologic materials without the concerns required to test for infectious agents. Another potential application of these surrogates is to serve as controls to ensure sufficient sample is provided from exhaled breath collection and further used as a baseline to confirm that all downstream processes, such as PCR sample preparation, are working appropriately. While we assumed that saliva would be a successful normalization method, it is noteworthy that we did not find a correlation between targets collected on the mask inserts and targets detected in saliva samples from the same individual. Future studies incorporating biomarker targets characteristic of different regions of the respiratory tract might help clarify these results. Speaking and breathing may produce droplets collected on the mask inserts from regions of the respiratory tract, such as the oropharynx, that vary in target concentration compared to the regions that produced the saliva samples, such as the oral cavity. This could be an explanation for outliers produced in the expected positive trends when normalizing samples to the individual's saliva (Fig. 7 & Fig. S2†). Variance could also occur by different breathing rates or the force with which the subject is speaking. The goal of this study was to identify a target that could work reproducibly; however, future studies may use other targets. For example, one of the other 756 identified bacterial species across the upper and lower respiratory tracts could be chosen based on prevalence in different regions of interest.8
After selecting a proper molecular weight and degrees of hydrolysis along with processing steps including electrospinning and annealing, PVA proved to be an excellent collection platform. PVA is a polymer commonly used for biomedical applications because it has been well-characterized, is biocompatible and non-toxic, and can be tailored to varying levels of strength and water solubility.14–23 Furthermore, it has been widely used for electrospinning applications to produce nanofiber, porous substrates ideal for collecting small particles.28 The inserts handled well during collection and were easily dissolved to maximize extraction of the RNA and DNA biomarkers (Fig. 3). Other collection substrates could be used such as gelatin filters, which can be purchased,5,6 or media-based samplers for preserving live microorganisms.2
For the volunteer pool tested, all the parameters produced a detectable level of both RNase P and S. mitis target (Fig. 6). When comparing the difference in collected target for the 5× vs. 30× speech patterns, statistically different results were observed (Fig. 8). As expected, the greater amount of speech deposited significantly more detectable S. mitis and RNase P. The breathing samples were not statistically different based on the length of collection time for either target (Fig. 8). This could be attributed to factors such as shearing off loosely collected biologic material during inhalation or degradation of the target by nucleases on the insert over longer collection times before it was preserved in a buffer solution. The differences in breathing and speaking samples can potentially be attributed to the oropharynx for speech and the tongue or teeth for breathing. Further origin of expelled biologic materials such as the vocal cord or testing of expelled biologic material based on respiratory maneuvers such as coughing, sneezing, or singing could provide additional useful insights.
Since there can be different availabilities of mask types or preference among users, we compared surgical masks to N95 masks under the same conditions. None of the parameters showed a significant difference in the amount of target collected for either surrogate. This indicates both mask types are suitable to use for the model system based on the parameters we tested and should not otherwise affect the results. Other collection schemes, such as cloth masks or no mask at all could be explored in future studies.
The PCR measurement of exhaled material is a product of the collection efficiency (the fraction of the total exhaled targets collected on the mask inserts) and the extraction efficiency (the fraction of the total target recovered from the PVA inserts). There are three places that target loss occurs which could indicate the number of copies exhaled is actually higher than what was detected. The 1′′ × 1′′ mask inserts take up less than 12% of the target area inside the mask, therefore, they only collect a portion of what is actually expelled which would indicate a low collection efficiency. In this study we only sampled a small area of total potential collection area to minimize the working volume required to dissolve the PVA, to reduce the amount of reagents used, and to retain the natural airflow within a mask. Our biomarker extraction procedures yielded a modest 20–30% extraction efficiency, indicating a large share of the DNA collected is lost during the nucleic acid extraction from PVA (Fig. 5). We expect the RNase P RNA extraction efficiency is lower than S. mitis DNA extraction due to difficulties dealing with RNA such as molecular instability and the presence of RNases in saliva and on the insert which degrade RNA (Fig. S3†). Future studies could explore the use of biosafe RNase inhibitors to prevent such degradation. Finally, the reported copies detected are from the portion of sample used in the PCR reaction which is just 8% of the volume available after the extraction procedure. PCR volume modifications could be explored to incorporate more sample into a reaction. When accounting for all three types of loss, the number of detected copies is less than 1% of what is exhaled. Therefore, these results should not be interpreted as the full expelled biologic content. Instead, they can be used relatively to compare samples and are features that could be further optimized to increase the detection signals. Additional development of the collection material itself could investigate the inclusion of polymer surface modifications that bind exhaled biologics to further increase collection efficiency.
There was no significant decrease in extraction efficiency from the mask insert compared to directly extracting the targets from solution (Fig. 5). This indicates the PVA inserts do not hinder the extraction process but the extraction itself has a low efficiency; however, the high analytical performance of the detection assay helps to compensate. The primers and probes designed to detect S. mitis are effective down to a single copy in a 20 μL reaction volume when combined with a CDC detection kit for RNase P, even when undergoing a 15-minute reverse transcription step at 55 °C intended for the RNA samples (Fig. 4). Furthermore, RNase P maintained sufficient detection performance in the multiplexed reaction. While one of the S. mitis 101 samples did not detect any target, we believe this is an outlier since all the 100 copies were successfully detected. When 105 copies of the opposite target were spiked into a sample, detection was still successful implying the reaction components do not get fully consumed by a high concentration of the opposing target.
Since we followed standard RT-qPCR designs, this nucleic acid detection method can be easily adapted to almost any target by switching out the primer and probe sequences, although a multiplex screening would be required if more than one target is used. For this multiplexed PCR assay, the high analytical sensitivity allows for very few copies of target to be detected giving flexibility in the collection and extraction methods. However, the geometric efficiencies, as described by the slope of the analytical sensitivity log-linear fits (Fig. 4), exceeds 100% in our detection platform with 135% for RNase P and 106% for S. mitis.29 Likely, this is due to non-specific amplification of primer dimers or secondary products due to the multiplexed nature of the reaction.30 However, amplification rarely occurred without the presence of the target of interest, therefore, this low-level non-specific amplification does not affect the results of the detection platform. Furthermore, this efficiency measurement has been shown not to be fully optimal and an overestimate in some cases of highly reproducible studies.31–33
While this framework shows great potential, there were several unexpected observations. First, we expected to detect increased copies with increased time worn for both breathing and speaking samples. The lack of increased target collected with increased time worn while breathing may indicate some imperfection in the system. Second, we expected to see increased exhaled target produced by individuals with more target in saliva. Though we did show that among individuals, the amount of target varies greatly in saliva samples (Fig. 7 & Fig. S2†), this did not successfully normalize the data as expected (Fig. 8). This suggests that what is exhaled may be representative of other regions of the respiratory tract rather than just oral saliva.
Conclusions
This study developed a framework that can be used to safely characterize the exhalation of exhaled biologic materials. Samples collected from anyone in a simple manner and reasonable amount of time can then be evaluated using standard detection technologies. Avoiding pathogenic targets from infected individuals simplifies future experiments by increasing the number of eligible volunteers and avoiding high level biocontainment requirements which enables more laboratories to conduct the research. Finally, two potential candidates are identified that could be used as sample controls in future pathogen exhalation studies.Author contributions
David Evans contributed experimental design, data collection, data analysis, and writing. Dalton Nelson contributed experimental design and review and editing. Megan Pask contributed sample collection and review and editing. Frederick Haselton contributed experimental design, writing, review and editing.Conflicts of interest
There are no conflicts to declare.Acknowledgements
The authors thank Mindy Leelawong for insightful conversations regarding study design. We also thank all the volunteers who provided samples. This work was supported in part by NIH AI157827. The table of contents figure was created using BioRender.com. Finally, we thank the reviewers for key insights and potential future directions.References
- J. Lednicky and J. Loeb, Influenza Res. Treat., 2013, 2013, 656825 Search PubMed.
- J. Kesavan, D. Schepers and A. Mcfarland, Aerosol Sci. Technol., 2010, 44, 817–829 CrossRef CAS.
- T. Booth, B. Kournikakis, N. Bastien, J. Ho, D. Kobasa, L. Stadnyk, Y. Li, M. Spence, S. Paton, B. Henry, B. Mederski, D. White, D. Low, A. Mcgeer, A. Simor, M. Vearncombe, J. Downey, F. Jamieson, P. Tang and F. Plummer, J. Infect. Dis., 2005, 191, 1472–1477 CrossRef PubMed.
- P. Fabian, J. Brain, E. Houseman, J. Gern and D. Milton, J. Aerosol Med. Pulm. Drug Delivery, 2011, 24, 137–147 CrossRef PubMed.
- C. Williams, E. Cheah, J. Malkin, H. Patel, J. Otu, K. Mlaga, J. Sutherland, M. Antonio, N. Perera, G. Woltmann, P. Haldar, N. Garton and M. Barer, PLoS One, 2014, 9, 3104921 Search PubMed.
- M. Williams, M. Abdulwhhab, S. Birring, E. de Kock, N. Garton, E. Townsend, M. Pareek, A. Al-Taie, J. Pan, R. Ganatra, A. Stoltz, P. Haldar and M. Barer, Lancet Infect. Dis., 2020, 20, 607–617 CrossRef PubMed.
- M. Williams, D. Pan, J. Decker, A. Wisniewska, E. Fletcher, S. Sze, S. Assadi, R. Haigh, M. Abdulwhhab, P. Bird, C. Holmes, A. Al-Taie, B. Saleem, J. Pan, N. Garton, M. Pareek and M. Barer, J. Infect., 2021, 82, 253–259 CrossRef PubMed.
- D. Fonkou, J. Dufour, G. Dubourg and D. Raoult, Future Microbiol., 2018, 13, 1611–1624 CrossRef PubMed.
- A. Aas, J. Paster, M. Stokes, I. Olsen and F. Dewhirst, J. Clin. Microbiol., 2005, 43, 5721–5732 CrossRef PubMed.
- J. Mitchell, Mol. Oral Microbiol., 2011, 26, 89–98 CrossRef CAS PubMed.
- Y. Zheng, H. Chen, M. Yao and X. Li, J. Aerosol Sci., 2018, 117, 224–234 CrossRef CAS PubMed.
- A. Wozniak, A. Cerda, C. Ibarra-Henríquez, V. Sebastian, G. Armijo, L. Lamig, C. Miranda, M. Lagos, S. Solari, A. Guzmán, T. Quiroga, S. Hitschfeld, E. Riveras, M. Ferrés, R. Gutiérrez and P. García, Sci. Rep., 2020, 10, 16608 CrossRef CAS PubMed.
- CDC 2019-Novel Coronavirus (2019-nCoV) Real-Time RT-PCR Diagnostic Panel, https://www.fda.gov/media/134922/download, (accessed April 2023).
- S. Muppalaneni and H. Omidian, J. Dev. Drugs, 2013, 2, 3 Search PubMed.
- G. Misra and P. Mukherjee, Colloid Polym. Sci., 1980, 258, 152–155 CrossRef CAS.
- A. Koski, K. Yim and S. Shivkumar, Mater. Lett., 2004, 58, 493–497 CrossRef CAS.
- J. Park, T. Ito, K. Kim, K. Kim, B. Kim, M. Khil, H. Kim and I. Kim, Polym. J., 2010, 42, 273–276 CrossRef CAS.
- X. Wang, Y. Kim, C. Drew, B. Ku, J. Kumar and L. Samuelson, Nano Lett., 2004, 4, 331–334 CrossRef CAS.
- W. Shen, F. Ao, X. Ge, Y. Ning, L. Wang, H. Ren and G. Fan, Mater. Today Commun., 2022, 30, 103093 CrossRef CAS.
- M. Sazegar, S. Bazgir and A. A. Katbab, Mater. Today Commun., 2020, 25, 101489 CrossRef CAS.
- V. V. Kadam, L. Wang and R. Padhye, J. Ind. Text., 2018, 47, 2253–2280 CrossRef CAS.
- C. Nam, S. Lee, M. Ryu, J. Lee and H. Lee, Korean J. Chem. Eng., 2019, 36, 1565–1574 CrossRef CAS.
- K. Wong, M. Zinke-Allmang and W. Wan, J. Mater. Sci., 2010, 45, 2456–2465 CrossRef CAS.
- W. Kim Seow, J. Lam, A. Tsang, T. Holcombe and P. Bird, Int. J. Paediatr. Dent., 2009, 19, 406–411 CrossRef PubMed.
- M. Abkarian, S. Mendez, N. Xue, F. Yang and H. Stone, Proc. Natl. Acad. Sci. U. S. A., 2020, 117, 25237–25245 CrossRef CAS PubMed.
- H. Bordelon, P. Russ, D. Wright and F. Haselton, PLoS One, 2013, 8, e68369 CrossRef CAS PubMed.
- S. Pearlman, M. Leelawong, K. Richardson, N. Adams, P. Russ, M. Pask, A. Wolfe, C. Wessely and F. Haselton, ACS Appl. Mater. Interfaces, 2020, 12, 12457–12467 CrossRef CAS PubMed.
- P. Supaphol and S. Chuangchote, J. Appl. Polym. Sci., 2008, 108, 969–978 CrossRef CAS.
- S. Bustin, V. Benes, J. Garson, J. Hellemans, J. Huggett, M. Kubista, R. Mueller, T. Nolan, M. Pfaffl, G. Shipley, J. Vandesompele and C. Wittwer, Clin. Chem., 2009, 55, 611–622 CrossRef CAS PubMed.
- S. Bustin, in A-Z of Quantitative PCR, Internat. Univ. Line, La Jolla, Calif., 2009, 18.5, pp. 630–631 Search PubMed.
- S. Bustin, in A-Z of Quantitative PCR, Internat. Univ. Line, La Jolla, Calif., 2009, 3.2.8., p. 103 Search PubMed.
- M. Pfaffl, Nucleic Acids Res., 2001, 29, e45 CrossRef CAS PubMed.
- M. Pfaffl, I. Lange, A. Daxenberger and H. Meyer, APMIS, 2001, 109, 103 CrossRef PubMed.
Footnote |
| † Electronic supplementary information (ESI) available. See DOI: https://doi.org/10.1039/d3nr01859h |
| This journal is © The Royal Society of Chemistry 2023 |