
 Open Access Article
 This Open Access Article is licensed under a
 Creative Commons Attribution 3.0 Unported Licence
Surface–particle interactions control the escape time of a particle from a nanopore-gated nanocavity system: a coarse grained simulation†
Robert
Zando
 a,
Mauro
Chinappi
b,
Cristiano
Giordani
cd,
Fabio
Cecconi
e and
Zhen
Zhang
a
a,
Mauro
Chinappi
b,
Cristiano
Giordani
cd,
Fabio
Cecconi
e and
Zhen
Zhang
a
aDivision of Solid-State Electronics, Department of Electrical Engineering, Uppsala University, SE-751 03 Uppsala, Sweden. E-mail: zhen.zhang@angstrom.uu.se
bDipartimento di Ingegneria Industriale, Università di Roma Tor Vergata, Via del Politecnico 1, Roma, Italy. E-mail: mauro.chinappi@uniroma2.it
cGrupo Productos Naturales Marinos, Facultad de Ciencias Farmacéuticas y Alimentarias, Universidad de Antioquia, Calle 70 No. 52-21, Medellín 050010, Colombia
dInstituto de Física, Universidad de Antioquia, Calle 70 No. 52-21, Medellín 050010, Colombia
eIstituto Sistemi Complessi, CNR, Via dei Taurini, Roma, Italy
First published on 9th June 2023
Abstract
Nanopores and nanocavities are promising single molecule tools for investigating the behavior of individual molecules within confined spaces. For single molecule analysis, the total duration of time the analyte remains within the pore/cavity is highly important. However, this dwell time is ruled by a complex interplay among particle–surface interactions, external forces on the particle and Brownian diffusion, making the prediction of the dwell time challenging. Here, we show how the dwell time of an analyte in a nanocavity that is connected to the external environment by two nanopore gates depends on the sizes of the nanocavity/nanopore, as well as particle–wall interactions. For this purpose, we used a coarse-grained model that allowed us to simulate hundreds of individual analyte trajectories within a nanocavity volume. We found that by increasing the attraction between the particle and the wall, the diffusion process transforms from a usual 3D scenario (repulsive wall) to a 2D motion along the cavity surface (highly attractive wall). This results in a significant reduction of the average dwell time. Additionally, the comparison of our results with existing theories on narrow escape problem allowed us to quantify the reliability of theory derived for ideal conditions to geometries more similar to actual devices.
1 Introduction
The motion of single nanoentities in confined geometries is relevant to a wide number of biological processes. Among others,1 examples include the diffusion of molecules on a crowded membrane2 and the modelling of synaptic currents.3 A common feature of all these scenarios is that a single particle diffuses in a confined environment until it reaches a specific location. This location can be a site where the molecules interact with a specific ligand or an aperture on the surface of the confining space. In literature, this class of problems has traditionally been referred to as the Narrow Escape Problem (NEP), and is centered on calculating the mean first passage time of a diffusion process of a particle to a target much smaller than the size of the confining space.4–8NEP's for a single molecule are also highly relevant to the study of the behavior of single molecules in sensing devices, such as nanopores9–15 or nanocavities,16–18 since, once the analyte has been drawn into the confining geometry through external forces such as electrophoresis19,20 or dielectrophoresis21,22 it needs to remain within long enough to allow the acquisition of a signal from it. It is, therefore, crucial to investigate which factors affect the dwell time of the molecules in the confining geometry.
In this study, we focus on the exit of a particle from a nanocavity that is connected to external reservoirs by two nanopores (see Fig. 1). This set-up resembles a number of solid-state nanopore systems used for sensing purposes.9,10,23 These solid-state pores may take on a wide variety of different geometries,24 such as cylindrical, conical or hourglass-shaped25 (though our study focuses primarily on a cylindrical geometry configuration). The nanopore apertures on either entrance of the nanocavity may be varied in size (compared to the cavity dimensions) through the use of secondary barriers9 or the deposition of surface additives such as carbon to reduce the opening diameter.26,27
 | ||
| Fig. 1 Escape from a cylindrical cavity, bulk vs. surface diffusion. (a) When the wall particle interaction is repulsive, the particle, initially placed in the center of the cavity, diffuses in the volume until it reaches one of the two exits. This trajectory used the following conditions: ε = 0.1kBT, dc = 400 nm and de = 50 nm. The center panel is a polar representation of the trajectory, z is the axis of the cylinder, and ρ the distance between the particle an the axis. Left panel is a top view (projection on the Oxy plane). (b) For highly attractive particle–wall interaction, as soon as the particle hits the wall, it starts a surface diffusion along it until it reaches one of the two exits. The trajectory conditions are: ε = 6kBT, dc = 400 nm and de = 50 nm. (c) Average dwell time τ as a function of ε. The upper inset reports a sketch of the Lennard-Jones potential used to model wall–particle interaction, eqn (2), the three curves corresponding to ε = 0.1, 1, 4kBT. The lower inset reports the same data where the logarithmic scale is used for ε/kBT to highlight the repulsive plateau at ε/kBT ≪ 1 (red points). | ||
In order to ensure a reasonable computational cost for our study, we made use of a “coarse-grained” approach, as commonly employed in the literature to make affordable the simulation of system that would be untractable by atomistic models.9,28–30 We simulate several hundred instances of trajectories for an individual analyte particle dwelling within a nanocavity, allowing us to estimate how the average dwell time was affected by particle–surface interactions and aperture size, with a focus on two specific categories of interaction conditions. In the first, the particle–surface interaction is mainly repulsive, and the particle diffuses in the bulk of the nanocavity until it reaches one of the two exits. In the second, there is a strong attraction between the particle and the wall, where contact between the particle and the nanocavity surface confines the analyte to the wall, causing the analyte to undergo surface diffusion.
2 Model and method
The system is simulated using a Brownian model. In such methodology, molecular systems with complex structures (such as DNA or proteins) may instead by simplified to pseudo-particles that may correspond to the entire molecule, as in the case of globular proteins31 or to monomers.9,11,32 In our work the analyte will be modeled as a Brownian particle of given hydrodynamic diameter dp confined by the nanocavity wall. We will also consider the possibility that the particle mobility is reduced close to the wall. Details of the methods are reported in the next sections.2.1 Brownian model
The molecule's motion within the nanocavity is modeled through the use of the overdamped Langevin equation,33–36| ẋ = μF(x, t) + gζ(t) | (1) |
 representing the amplitude of the white noise ζ(t), where kB representing the Boltzmann constant, T representing the system temperature and μ the mobility. Reducing the particle motion to tracking its center of mass can be considered a model for globular biomolecules without large internal flexibility (e.g. insulin, ribonuclease, hemoglobin) and small nanoparticles.37 The overdamped Langevin model, eqn (1), is a reasonable approximation for the transport of spheroidal particles in micro and nanofluidics38–40 where the Reynolds number is ≪1.
2.2 Particle–wall interaction
The Lennard-Jones (LJ) potential was used to model particle–wall interaction, F in the Langevin eqn (1). This potential energy is determined with the equation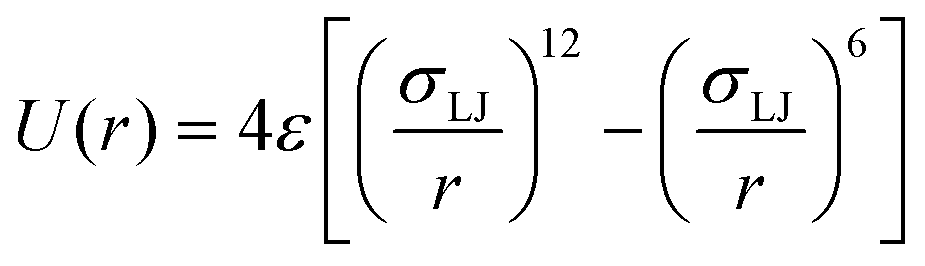 | (2) |
2.3 Geometry of the nanocavity
The nanocavity is modeled as a cylinder with two apertures of equal sizes on the top and the bottom (see Fig. 1a). The analyte was presumed to have started in the center of the cylinder. There are four relevant lengths in the model: the analyte diameter (dp), the cylinder diameter (dc), the cylinder height (h), and the aperture diameter (de). The specific methods used to produce the geometry in our Brownian solver, and how this information was used to determine the wall–particle distance in eqn (2), may be found in ESI Fig. S3.†2.4 Mobility model
Due to a variety of factors, including hydrodynamic shear and particle adsorption at the surface, the ability of the analyte to freely move within the medium is usually diminished significantly near the wall.42–44 We considered the following expression for the mobility | (3) |
 , so that when the particle adheres to the wall (due to the well of the LJ potential) it is in the low μ area adhesion region, an example of which may be found in the Results section. Concerning the numeric integration, we used the stochastic Euler algorithm34,45 where an additional drift term kBT∇·M with M the mobility tensor (in our case, diagonal) is added.46,47
3 Results and discussion
The simulations were run using a cylindrical nanocavity with two identical apertures on its bases. The diameter of the aperture ranges from de = 16 nm to de = 100 nm while the height h, equal to its diameter of the nanocavity dc (h = dc), ranges from 200 to 400 nm. The range of potential-well depths ε is between 0.1kBT (repulsive case) and 8kBT (highly attracting case). A spherical particle of diameter dp = 15 nm is initially placed in the center of the nanocavity and the simulation is stopped when the particle exits from one of the two apertures. Each data set was acquired from 200 individual trajectories, allowing us to measure the average time the particles dwells the nanocavity τ. In order to focus our analysis on the effect of the aperture size de and wall-confinement due to potential energy interaction, we started with homogeneous mobility, i.e. the particle does not experience any reduction in its mobility when it is close to the wall of the nanocavity (μw = μb in eqn (3)).As shown in Fig. 1a and b, one of the most notable phenomena which results from the change in potential well depth ε is an drastic alteration of the particle trajectory. For ε ≪ kBT the particle undergoes a bulk 3D diffusion in the nanocavity, as seen in Fig. 1a. However, for ε > 4kBT, as soon as the particle reaches a wall during its 3D diffusion, it becomes trapped at the surface and starts a 2D diffusion process along the wall, as seen in Fig. 1b. Fig. 1c reports the average dwell time τ as a function of ε for dc = 400 nm and de = 50 nm, showing that the transition from the 3D bulk diffusion regime to the 2D surface diffusion scenario occurs approximately for kBT < ε < 4kBT. More specifically for ε < kBT, the wall is, practically, repulsive as the thermal energy easily allows the particle to escape the LJ well (see also the inset of Fig. 1b). Instead, for ε > 4kBT, the particle hardly escapes from the LJ well. As shown ESI Fig. S4,† this behavior is observed also for different aperture sizes. This transition represents a dimensional reduction in the analyte's degrees of freedom which facilitates the escape from the nanocavity because the particle performs a 2D instead of a 3D diffusion.
3.1 Comparison with theory
We compared our results against two analytical models, one for the 3D bulk diffusion and one for the 2D surface diffusion scenario. The 3D analytical prediction is taken directly (with just a slight modification) from the work of Grigoriev et al.,41 providing an expression for the average escape rate from a nanocavity as a function of its volume V and the radius of the exit. More specifically, we used the following expression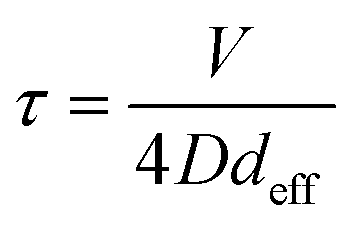 | (4) |
 | ||
| Fig. 2 Comparison with theoretical predictions. (a) Average dwell time τ as a function of the exit diameter de for the repulsive case (ε = 0.1kBT) from our simulations (points) and from an adaptation of the results by Grigoriev et al.,41eqn (4). Three different nanocavity diameter dc are considered. Panel (b) reports the same comparison for the attractive case (ε = 8kBT). Lines refer to our 2D theoretical prediction, eqn (6). Our numerical results match the theoretical prediction for large aperture size. However, as the aperture diameter approaches the particle diameter dp or, in other terms, since deff = de − dp, as deff → 0, the dwell time τ diverges faster than the theoretical prediction, in particular in the attractive 2D diffusion case. The grey area corresponds to de < dpi.e. exit diameter smaller that the particle diameter so that, the right boundary of the grey area corresponds to deff = 0. Error bars are smaller that the data point symbol sizes. | ||
For the surface diffusion case (attractive wall), we derived a theoretical expression for τ. In brief, as common in capture and escape problems, we used a Smoluchowski-like approach that, in absence of external forcings, amounts to calculating the flux of particles on an adsorbing boundary.48–50 More specifically, we calculate the average time τ in which a particle that diffuses on a 2D circular crown domain bounded by an inner circle of diameter de, where the particles are adsorbed by an external circle of diameter dext, and where particle concentration has a prescribed value C0 (see ESI Note S1† for details). The capture frequency kc = τ−1 is given by
 | (5) |
To adapt these results to our nanocavity, we need to find an estimation for dext and C0. Concerning C0, we considered that there is only one particle, hence, C0 = A−1 where A is half of the area of the nanocavity (the factor 1/2 stemming from the presence of two apertures). Concerning dext, in the simplified model that lead to eqn (5), dext is, basically, the distance from the emitting boundary and the adsorbing boundary. In our system, this would correspond to the distance from the pore exit and the first location where, the particle diffusing in the bulk, hits the wall and gets trapped. This distance, scales with the cavity size dc, so we set dext = dc. Consequently, eqn (5) reduces to
 | (6) |
Up to now, we showed that some trends of the dependence of the dwell time τ as a function of the geometrical features of the nanocavity can be caught by using relatively straightforward theoretical approaches. Because of this, one may ask if theoretical insights on the 2D–3D transition may be derived is similar ways. However, this case is much more complex, since in the intermediate regime (ε = 1kBT to ε = 5kBT in Fig. 1) a particle trapped in the well of the interaction potential may escape from the wall before leaving the nanocavity. Hence, the overall motion is composed by periods in which the particle diffuses in the bulk of the nanocavity and periods in which it slides along the wall. An approximated expression for the dwell time in this intermediate regime was proposed by Oshanin et al. (eqn (34) of ref. 6) for a spherical nanocavity. In our notation, the Oshanin result takes the form
 | (7) |
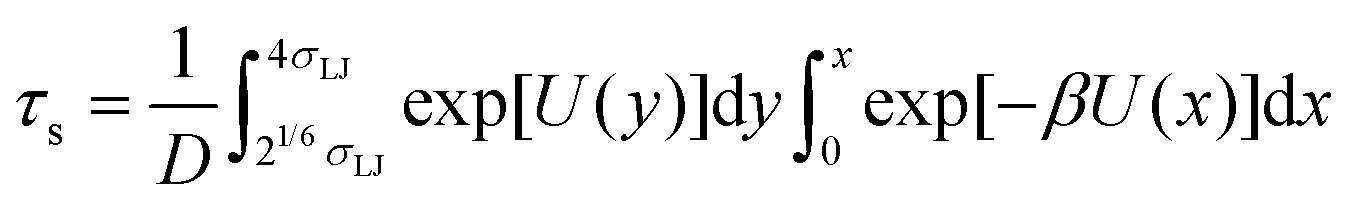 | (8) |
 | ||
| Fig. 3 2D–3D transition. (a) Escape time τs from a planar wall as a function of the wall–particle interaction as predicted by eqn (8) for σLJ = 7.5 nm, with all other parameters identical to those in Fig. 1. (b) Dwell time τ from eqn (7) for dc = 400 nm and deff = 10, 15, 25, 35 nm. The inset reports comparison with numerical data for dc = 400 nm and deff = 35 nm already shown in Fig. 1. | ||
3.2 Effect of mobility reduction
Finally, we incorporate the effects of drag resulting from proximity to the nanocavity wall as a reduction in the mobility coefficient. More specifically, in eqn (3) we set the mobility at the wall to μw = fμb with μb the bulk mobility and f < 1. In essence, when the particle is trapped at the wall (i.e. it is in the area of the attractive well of the LJ potential), and μ is reduced by a factor f. The smoothing between the bulk value μb and the wall value μw is the sigmoid curve provided in eqn (3) and sketched Fig. 4a. The change in the particle mobility at the wall may arise from several phenomena. For instance, in the event of repulsive particle–wall interactions, we expect that the main contribution will came from hydrodynamics. In this case, one can rely on approximated expressions for mobility of a particle near a wall51 or on numerical approaches43 if the liquid slippage may strongly alter the dynamics close to a wall (as it happens in a wide range of transport phenomena52,53). For highly attractive walls, we may instead expect that the main source of mobility reduction will be the partial adsorption due to chemical affinity. In nanopore sensing applications, another possibility is that the coating of a solid-state pore with a fluid-like membrane able to bind the particle.54,55 | ||
| Fig. 4 Effect of reduction of the wall mobility. (a) The mobility of the particle is modeled as a sigmoid (eqn (3)). Far from the wall, the mobility has the bulk value μb, while close to the wall, when the particle is trapped in the well of the potential representing the wall–particle interaction, the mobility is reduced by a factor f, i.e. μw = fμb. (b) Average dwell time τ as a function of intensity ε of the wall–particle interaction for f = 0.2 and f = 0.5 for dc = 400 nm and de = 50 nm. For comparison, the case with no mobility reduction (already presented in Fig. 1) is also reported. | ||
When mobility at the wall is reduced, the dependence of the dwell time on the depth ε of the wall–particle interaction is no longer monotonic (see Fig. 4b). Indeed, now the reduction in the dwell time due to the surface diffusion is compensated for by the increase in the drag. For the highly attractive case (ε ≥ 8kBT), the dwell time τ tends to a plateau for all three curves in Fig. 4b. As expected from the theoretical expression for the dwell time for the 2D surface diffusion (eqn (5)), τ scales to roughly as 1/f (for instance, the plateau value for f = 0.5 is approximately the double of the plateau value for f = 1). Interestingly, for low f (i.e. the mobility is largely reduced at the wall) the dwell time shows a minimum for intermediate values of ε (see red points in Fig. 4b). An additional phenomenon of note is the effect of a change in the value of σμ on the dwell time of an analyte within a confined volume. As can be seen in ESI Fig. S5,† when all other factors are constant, an increase in σμ (which roughly correlates to an ever-greater distance from the wall where mobility reduction becomes measurable) results in an increase in the average dwell time τ. While this effect is somewhat limited for the repulsive case (likely due to the fact that the particle in not trapped in the wall region where the mobility is reduced), it is much more pronounced for the attractive wall case. As expected, in both repulsive and attractive case, when σμ approach to the particle size dp/2 the dwell time is comparable to that of an identical scenario with no mobility reduction.
4 Conclusions
In this study, we employed Brownian simulations to simulate the exit of a particle from a nanocavity. The Brownian model has computational cost much lower compared with other coarse grained approaches and is able to include thermal fluctuation such as DPD56–60 or MPCD.61,62 This allowed us to explore the effects of a wide range of parameters on particle trajectories within a confined volume. In particular, we investigated the effects on the average dwell time of particle–wall interactions, as well those of the size of the nanocavity and of the aperture, as well as that of a reduction in particle mobility when the analyte adheres the wall.Varying the intensity of particle–wall attractive interaction had an intriguing effect on the dwell time. For repulsive walls, the particles explored the nanocavity volume until they reach one of the apertures. For sufficiently attractive particle–wall interactions, on the other hand, becomes trapped upon contact with the wall starts diffusing along the nanocavity surface. This 2D diffusive process allows the particle to escape more quickly. Overall, the dwell time of the particle decreases with the strength of the wall–particle interaction until a plateau is reached for interaction energies with minima's less than ∼5kBT. Since exact theoretical results in the literature were found only for more ideal geometries (such as spheres or disks), our simulation may be used to test the capability of existing theoretical models for more complex system geometries which have a greater similarity to some laboratory conditions. The comparison with existing theories indicates that analytical models are able to predict the trends of the dwell time as a function of the nanocavity and aperture size in the 2D and the 3D case and even to catch some features of the 2D–3D transition. Our simulation also allowed us to study the effect of the reduction of the mobility at the wall. If the wall mobility is much lower than that of the bulk, the 2D scenario is no longer the faster way for the particle to leave the nanocavity. Taken together, we think that our results may contribute to the understanding of how geometry and wall–particle interactions may be tuned to control the dwell time of a particle within a confined space. From a practical perspective, once estimations on the reduction of mobility at the wall and on the intensity of the particle–wall interaction are available, this information may be embedded in the Brownian solver. This evidence may come from experiments63–65 or, alternatively, from atomistic simulations.66
However, as the experimental data for pure volumetric confinement (the focus of our work) is extremely limited, we have found it necessary to design our own novel, in situ experimental methodology. This will form the basis of future work into refining our model to more closely match laboratory conditions. Overall, the understanding of the escape time from a nanocavity may be relevant in developing nanopore–nanocavity systems for sensing single particles or to monitor the interaction of a small number of molecules.
Conflicts of interest
There are no conflicts of interest to declare.Notes and references
- D. Holcman and Z. Schuss, Rep. Prog. Phys., 2013, 76, 074601 CrossRef CAS PubMed.
- D. Holcman, N. Hoze and Z. Schuss, Phys. Rev. E: Stat., Nonlinear, Soft Matter Phys., 2011, 84, 021906 CrossRef CAS PubMed.
- Z. Schuss, A. Singer and D. Holcman, Proc. Natl. Acad. Sci. U. S. A., 2007, 104, 16098–16103 CrossRef CAS PubMed.
- O. Bénichou and R. Voituriez, Phys. Rep., 2014, 539, 225–284 CrossRef.
- D. S. Grebenkov and G. Oshanin, Phys. Chem. Chem. Phys., 2017, 19, 2723–2739 RSC.
- G. Oshanin, M. Tamm and O. Vasilyev, J. Chem. Phys., 2010, 132, 06B607 CrossRef PubMed.
- O. Bénichou, D. Grebenkov, P. Levitz, C. Loverdo and R. Voituriez, Phys. Rev. Lett., 2010, 105, 150606 CrossRef PubMed.
- D. Holcman and Z. Schuss, J. Stat. Phys., 2004, 117, 975–1014 CrossRef.
- S. Zeng, M. Chinappi, F. Cecconi, T. Odijk and Z. Zhang, Nanoscale, 2022, 14, 12038–12047 RSC.
- D. Pedone, M. Langecker, G. Abstreiter and U. Rant, Nano Lett., 2011, 11, 1561–1567 CrossRef CAS PubMed.
- E. L. Bonome, F. Cecconi and M. Chinappi, Nanoscale, 2019, 11, 9920–9930 RSC.
- F. Bétermier, B. Cressiot, G. Di Muccio, N. Jarroux, L. Bacri, B. Morozzo della Rocca, M. Chinappi, J. Pelta and J.-M. Tarascon, Commun. Mater., 2020, 1, 59 CrossRef.
- Y. N. D. Bandara, N. Farajpour and K. J. Freedman, J. Am. Chem. Soc., 2022, 144, 3063–3073 CrossRef CAS PubMed.
- N. Meyer, I. Abrao-Nemeir, J.-M. Janot, J. Torrent, M. Lepoitevin and S. Balme, Adv. Colloid Interface Sci., 2021, 298, 102561 CrossRef CAS PubMed.
- I. M. F. Tanimoto, B. Cressiot, N. Jarroux, J. Roman, G. Patriarche, B. Le Pioufle, J. Pelta and L. Bacri, Biosens. Bioelectron., 2021, 183, 113195 CrossRef PubMed.
- F. Farhangdoust, F. Cheng, W. Liang, Y. Liu and M. Wanunu, Adv. Mater., 2022, 34, 2108479 CrossRef CAS PubMed.
- X. Liu, M. M. Skanata and D. Stein, Nat. Commun., 2015, 6, 6222 CrossRef CAS PubMed.
- Y. Zhang, X. Liu, Y. Zhao, J.-K. Yu, W. Reisner and W. B. Dunbar, Small, 2018, 14, 1801890 CrossRef PubMed.
- F. A. Morrison Jr., J. Colloid Interface Sci., 1970, 34, 210–214 CrossRef.
- M. Boukhet, F. Piguet, H. Ouldali, M. Pastoriza-Gallego, J. Pelta and A. Oukhaled, Nanoscale, 2016, 8, 18352–18359 RSC.
- S. Tanaka, M. Tsutsui, H. Theodore, H. Yuhui, A. Arima, T. Tsuji, K. Doi, S. Kawano, M. Taniguchi and T. Kawai, Sci. Rep., 2016, 6, 31670 CrossRef CAS PubMed.
- L. Liu, K. Chen, N. Xiang and Z. Ni, Electrophoresis, 2019, 40, 873–889 CrossRef CAS PubMed.
- C. Liao, F. Antaw, A. Wuethrich and M. Trau, Adv. Mater. Technol., 2020, 5, 2000701 CrossRef CAS.
- N. H. Pham, Y. Yao, C. Wen, S. Li, S. Zeng, T. Nyberg, T. T. Tran, D. Primetzhofer, Z. Zhang and S.-L. Zhang, et al. , ACS Nano, 2021, 15, 17938–17946 CrossRef CAS PubMed.
- J. P. Fried, J. L. Swett, B. P. Nadappuram, J. A. Mol, J. B. Edel, A. P. Ivanov and J. R. Yates, Chem. Soc. Rev., 2021, 50, 4974–4992 RSC.
- S. Zeng, C. Wen, S. Li, X. Chen, S. Chen, S.-L. Zhang and Z. Zhang, Nanotechnology, 2019, 30, 455303 CrossRef CAS PubMed.
- S. Li, S. Zeng, C. Wen, L. Barbe, M. Tenje, Z. Zhang, K. Hjort and S.-L. Zhang, J. Phys. Chem. B, 2020, 124, 11573–11583 CrossRef CAS PubMed.
- L. Qiao and G. W. Slater, Phys. Chem. Chem. Phys., 2022, 24, 6444–6452 RSC.
- T. Y. Molotilin, V. Lobaskin and O. I. Vinogradova, J. Chem. Phys., 2016, 145, 244704 CrossRef PubMed.
- C. C. Wells, D. V. Melnikov and M. E. Gracheva, J. Chem. Phys., 2019, 150, 115103 CrossRef PubMed.
- G. A. Huber and J. A. McCammon, Trends Chem., 2019, 1, 727–738 CrossRef CAS PubMed.
- C. Y. Kong and M. Muthukumar, Electrophoresis, 2002, 23, 2697–2703 CrossRef CAS PubMed.
- P. Lançon, G. Batrouni, L. Lobry and N. Ostrowsky, Europhys. Lett., 2001, 54, 28 CrossRef.
- M. S. Miguel and R. Toral, Instabilities and nonequilibrium structures VI, Springer, 2000, pp. 35–127 Search PubMed.
- N. G. van Kampen, Stochastic processes in physics and Chemistry, North-Holland, 2008 Search PubMed.
- T. Schlick, Molecular modeling and simulation: An interdisciplinary: Guide, Springer, 2014 Search PubMed.
- S. Tan, L. Wang, H. Liu, H. Wu and Q. Liu, Nanoscale Res. Lett., 2016, 11, 1–10 CrossRef CAS PubMed.
- E. M. Purcell, Am. J. Phys., 1977, 45, 3–11 CrossRef.
- S. Kim and S. J. Karrila, Microhydrodynamics: Principles and selected applications, Butterworth-Heinemann, 1991 Search PubMed.
- T. M. Squires and S. R. Quake, Rev. Mod. Phys., 2005, 77, 977–1026 CrossRef CAS.
- I. V. Grigoriev, Y. A. Makhnovskii, A. M. Berezhkovskii and V. Y. Zitserman, J. Chem. Phys., 2002, 116, 9574–9577 CrossRef CAS.
- M. Lisicki, B. Cichocki and E. Wajnryb, J. Chem. Phys., 2016, 145, 034904 CrossRef PubMed.
- D. Pimponi, M. Chinappi, P. Gualtieri and C. M. Casciola, Microfluid. Nanofluid., 2014, 16, 571–585 CrossRef CAS.
- T. Ala-Nissila, R. Ferrando and S. Ying, Adv. Phys., 2002, 51, 949–1078 CrossRef CAS.
- D. L. Ermak and J. McCammon, J. Chem. Phys., 1978, 69, 1352–1360 CrossRef CAS.
- A. Gubbiotti, M. Chinappi and C. M. Casciola, Phys. Rev. E, 2019, 100, 053307 CrossRef CAS PubMed.
- A. W. Lau and T. C. Lubensky, Phys. Rev. E: Stat., Nonlinear, Soft Matter Phys., 2007, 76, 011123 CrossRef CAS PubMed.
- M. Chinappi, M. Yamaji, R. Kawano and F. Cecconi, ACS Nano, 2020, 14, 15816–15828 CrossRef CAS PubMed.
- C. T. A. Wong and M. Muthukumar, J. Chem. Phys., 2007, 126, 164903 CrossRef CAS PubMed.
- A. Y. Grosberg and Y. Rabin, J. Chem. Phys., 2010, 133, 10B617 CrossRef PubMed.
- A. J. Goldman, R. G. Cox and H. Brenner, Chem. Eng. Sci., 1967, 22, 637–651 CrossRef CAS.
- M. Manghi, J. Palmeri, K. Yazda, F. Henn and V. Jourdain, Phys. Rev. E, 2018, 98, 012605 CrossRef CAS PubMed.
- E. S. Asmolov, A. V. Belyaev and O. I. Vinogradova, Phys. Rev. E: Stat., Nonlinear, Soft Matter Phys., 2011, 84, 026330 CrossRef PubMed.
- E. C. Yusko, J. M. Johnson, S. Majd, P. Prangkio, R. C. Rollings, J. Li, J. Yang and M. Mayer, Nat. Nanotechnol., 2011, 6, 253–260 CrossRef CAS PubMed.
- O. M. Eggenberger, C. Ying and M. Mayer, Nanoscale, 2019, 11, 19636–19657 RSC.
- P. Espanol and P. Warren, Europhys. Lett., 1995, 30, 191 CrossRef CAS.
- P. Español and P. B. Warren, J. Chem. Phys., 2017, 146, 150901 CrossRef PubMed.
- A. Gubbiotti, M. Chinappi and C. M. Casciola, Eur. Phys. J. Plus, 2022, 137, 1–21 Search PubMed.
- D. S. Bolintineanu, G. S. Grest, J. B. Lechman, F. Pierce, S. J. Plimpton and P. R. Schunk, Comput. Part. Mech., 2014, 1, 321–356 CrossRef.
- I. Pagonabarraga and D. Frenkel, J. Chem. Phys., 2001, 115, 5015–5026 CrossRef CAS.
- A. Malevanets and R. Kapral, J. Chem. Phys., 1999, 110, 8605–8613 CrossRef CAS.
- G. Gompper, T. Ihle, D. Kroll and R. Winkler, Advanced computer simulation approaches for soft matter sciences III, 2009, pp. 1–87 Search PubMed.
- V. Michailidou, G. Petekidis, J. Swan and J. Brady, Phys. Rev. Lett., 2009, 102, 068302 CrossRef CAS PubMed.
- P. Holmqvist, J. K. Dhont and P. R. Lang, Phys. Rev. E: Stat., Nonlinear, Soft Matter Phys., 2006, 74, 021402 CrossRef PubMed.
- M. Matse, M. V. Chubynsky and J. Bechhoefer, Phys. Rev. E, 2017, 96, 042604 CrossRef PubMed.
- A. Baer, P. Malgaretti, M. Kaspereit, J. Harting and A.-S. Smith, J. Mol. Liq., 2022, 368, 120636 CrossRef CAS.
Footnote |
| † Electronic supplementary information (ESI) available. See DOI: https://doi.org/10.1039/d3nr01329d |
| This journal is © The Royal Society of Chemistry 2023 |