Flexible plasmonic nanocavities: a universal platform for the identification of molecular orientations†
Lei
Yao‡
 a,
Qi
Hao‡
*a,
Mingze
Li
 a,
Xingce
Fan
 a,
Guoqun
Li
a,
Xiao
Tang
a,
Yunjia
Wei
a,
Jiawei
Wang
a,
Guoqun
Li
a,
Xiao
Tang
a,
Yunjia
Wei
a,
Jiawei
Wang
 b and
Teng
Qiu
 a
a
aSchool of physics, Southeast University, Nanjing 211189, P. R. China. E-mail: qihao@seu.edu.cn
bSchool of Electronic and Information Engineering, Harbin Institute of Technology (Shenzhen), Shenzhen 518055, China
First published on 14th March 2023
Abstract
The molecular orientation provides fundamental images to understand molecular behaviors in chemistry. Herein, we propose and demonstrate sandwich plasmonic nanocavities as a surface-selection ruler to illustrate the molecular orientations by surface-enhanced Raman spectroscopy (SERS). The field vector in the plasmonic nanocavity presents a transverse spinning feature under specific excitations, allowing the facile modulation of the field polarizations to selectively amplify the Raman modes of the target molecules. It does not require the knowledge of the Raman spectrum of a bare molecule as a standard and thus can be extended as a universal ruler for the identification of molecular orientations. We investigated the most widely used Raman probe, Rhodamine 6G (R6G) on the Au surface and tried to clarify the arguments about its orientations from our perspectives. The experimental results suggest concentration-dependent adsorption configurations of R6G: it adsorbs on Au primarily via an ethylamine group with the xanthene ring lying flatly on the metal surface at low concentrations, and the molecular orientation gradually changes from “flat” to “upright” with the increase of molecular concentrations.
Introduction
The determination of molecular adsorption orientation is crucial to illustrate molecular mechanics. It provides fundamental understandings to interpret the DNA dynamics,1 clarify the roadmap in heterogeneous reactions2,3 and depict the interfacial charge transfer channels in optoelectronics,4–6 as well as investigate the mechanisms in a wide range of fields in chemistry and biology.Experimental efforts, including infrared reflectance (IR),7,8 fluorescence,9,10 ellipsometry,11 and second harmonic generation,12 have been initially invested to determine the molecular orientation, but these methods generally do not fit the requirements for interfacial studies. Visualization microscopy techniques, such as scanning tunneling microscopy (STM) and atomic force microscopy (AFM), were then developed to investigate the molecule structures.13–16 These techniques offer a sub-molecular resolution in characterization, but they are incapable to specify the molecular chemical configuration. On the other hand, the density functional theory (DFT) offers a solution to derive the most probable adsorption pattern by calculating and comparing the lowest energy adsorption geometry of the molecules.17 However, the simulations are sometimes disconnected from the actual situation due to improper initial settings of the molecular orientations or an absence of considering the effects of molecule–molecule interactions.
Raman microscopy is a noninvasive molecular sensing technique featuring chemically specific detection by offering the “fingerprints” of target analytes. Though originally weak in intensity, Raman scattering can be significantly boosted by exciting the localized surface plasmon resonance (LSPR) of plasmonic materials, which is known as surface-enhanced Raman scattering (SERS).18–22 The SERS intensity of each Raman mode depends on its tensor symmetry with respect to the surface and reaches a maximum when it is aligned with the axial polarization of the local electromagnetic (EM) fields.23–25 This character, which is known as the surface selection rule, grants SERS the potential in illustrating the molecular orientations by evaluating the SERS enhancement of the target modes and their corresponding normal Raman intensities.26,27
However, the application of SERS in determining molecular orientations is limited due to the absence of knowledge of the local field polarizations around the complex plasmonic structures. The solutions can be divided into two categories: (1) directing the target molecules into precisely designed plasmonic structures with determined EM fields28,29 and (2) generating EM fields perpendicular to the sample surface at the molecular position by tip-enhanced Raman scattering (TERS).30–35 Though these advanced techniques offer decent strategies to interpret molecular structures with a molecular or sub-molecular resolution, the measurement of the intrinsically weak normal Raman scattering of bare molecules, which is required to evaluate the relative enhancement of each Raman mode and determine the molecular orientation, is still a major limit. To date, the potential of SERS in illustrating molecular orientations has not been efficiently explored. For example, the orientation of the mostly studied Raman probe, Rhodamine 6G, is still under debate. Dyck et al.17 deduced that the xanthene ring of R6G is parallel to the substrate, and the ethylamine group exhibits an upward orientation respect to the surface by calculating the max adsorption energy with DFT, while Heinz et al.36 suggested the non-parallel adsorption of R6G and Klingsporn37et al. and Turley et al.38 proposed that R6G can be adsorbed along the xanthene ring via an ethylamine group.
Herein, we propose and demonstrate a sandwich plasmonic nanocavity for the identification of molecule orientations. The nanocavity is composed of two face-to-face flexible plasmonic membranes and a monolayer of molecules in between. The configuration provides dense EM fields for SERS enhancement and allows favorable control over the LSPRs by adjusting the polarization of the incident light, lifting the limitations in microscopy techniques, as mentioned above. Moreover, it is applicable to provide the map of the distribution of molecular adsorption configurations statistically, enabling ensemble analysis of the Raman modes. The contributions from adsorbate–adsorbate interactions and adsorbate-binding site interactions, which are generally ignored in single-molecule microscopies and DFT calculations, can be covered.
Results and discussion
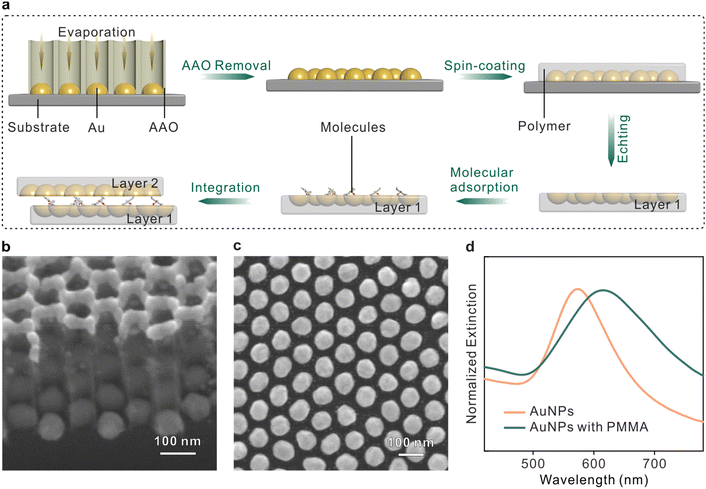
The fabrication procedures of the sandwich plasmonic nanocavity are illustrated in Fig. 1a. The sandwich plasmonic nanocavity is composed of two flexible membranes containing embedded plasmonic Au nanoparticles (AuNPs) and a monolayer of molecules sandwiched between the membranes. The plasmonic AuNPs were prepared on a silicon wafer with template-assisted evaporation by employing an anodic aluminium oxide (AAO) membrane as a mask in E-beam evaporation. This technique features centimeter-scale fabrication of patterned nanoarrays, and the details about the manipulation of the AAO membranes are available in our previous publications.39–41 The AAO membranes were peeled off from the substrate after evaporation to get the AuNP arrays. The Fabricated nanoarrays were spin-coated on a polymethyl methacrylate (PMMA) membrane and subsequently baked in the air. The prepared samples were immersed in a hot alkaline solution to remove the substrates to obtain the flexible plasmonic membranes. The integrity of the nanoarrays maintained well during the transfer, and wafer-level smoothness was granted onto the flat side of the AuNPs.42 The membranes were transferred in the solution containing target analytes to form an adsorbed self-assembled monolayer that was organized by non-covalent bonds under near-thermodynamic equilibrium conditions.43,44 The sample was adhered to another plasmonic membrane by van der Waals forces to form the sandwich structure. The sandwich plasmonic nano-cavities were dried naturally in the air, and the extra liquids were absorbed using blotting paper. In this configuration, the spacing between two membranes is determined by the size of the adsorbed molecules, which is supposed to be around 1 nm.45–47 The ultra-small gap between the membranes offers the potential to generate dense LSPRs for SERS studies.Fig. 1b and c present the scanning electron microscopy (SEM) image of the fabricated AuNPs nanoarray on a silicon wafer. The diameter of the particles was 75 ± 5 nm and the spacing between two adjacent particles was about 25 ± 5 nm (see Fig. S2†). The X-ray diffraction pattern of the AuNPs exhibits intense and sharp diffraction peaks, confirming the highly crystalline state with a face-centered cubic structure (Fig. S2†).48 The plasmonic modes of a single-layer plasmonic membrane were characterized using UV–vis spectra, as shown in Fig. 1d. It was observed that the peak of the plasmonic resonance mode was originally located at ∼570 nm, and the mode red shifted and broadened when the nanoparticles were embedded in PMMA polymer due to the variations in the dielectric environment.49 The resonance mode was well coupled with the 633 nm irradiation laser, suggesting efficient SERS enhancement from this configuration.
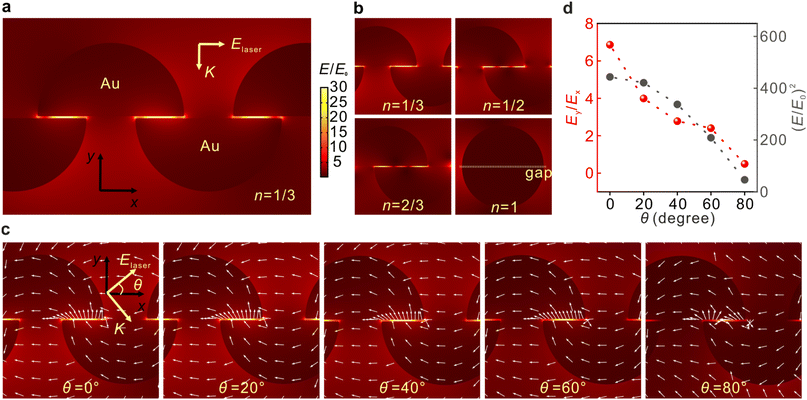
The three-dimensional flexible plasmonic nanocavity can be freely rotated in space to manipulate the relative angle between its plane and laser polarization and modulate the distributions of the EM fields. The EM field distributions are systematically investigated by the finite element method (FEM) calculations, as shown in Fig. 2. Fig. 2a depicts the typically calculated field distribution around the AuNPs with the laser polarization along the x-axis (θ = 0°). It is clear that the ‘hot spots’ were located at the gap position between two layers with a maximum of E/E0 = 49.7. The EM enhancement factor of SERS is proportional to the fourth power of E/E0, and the maximum enhancement factor was calculated to be 6.1 × 10⁶ at 633 nm. Considering that the overlap between the upper and lower hemisphere NPs can be different in the experiments, the effects of the overlap ratio n on EM fields were investigated. Fig. 2b shows that the ‘hot spots’ were located at the gap regions in all cases, except for the full overlapping situation. The ‘hot spots’ are likely to be periodically distributed, indicating that the EM polarizations in the gaps are not simply along the y-axis. Since the simulation cannot exhaust all the structural arrangements, we take n = 1/3 as a typical example to visualize the changes in the EM fields as a function of the laser polarization. Fig. 2c reveals the EM field distribution upon varied excitation conditions with different polarization angles. It should be noted that the simulation at θ = 80° was presented instead of the results at θ = 90° to match the experimental results in the following sections, and there is no significant difference between the two cases. When the gap reaches the extremely small regime, the local field vector presents a transverse spinning feature at the metal–air interface, which is in contrast to the case that the gap is relatively large (see Fig. S4†). This can be explained by the transverse spinning angular momentum in the LSPR modes.50,51 These near-fields dominate the SERS signal in our experiments when the gap scale comes to the single-molecule level, and thus can be exploited to manipulate the polarizations of the EM fields. In the experiments, our preparations offered a wafer-level ultrasmooth surface on the flat side of the AuNPs, which is essential for the formation of transverse fields.52Fig. 2d depicts the changes in EM fields as a function of θ. It is observed that both the intensity E2 and the intensity ratio between Ey and Ex were decreasing with the increase of θ. The results suggest that the Raman modes with tensors along the y-axis will be efficiently enhanced, while tensors along the x-axis will be relatively suppressed when the laser polarization is parallel to the x-axis at θ = 0°, and vice versa at θ = 90°. Similar results can be concluded for other conditions at n = 1/2 and 2/3 (Fig. S3†).
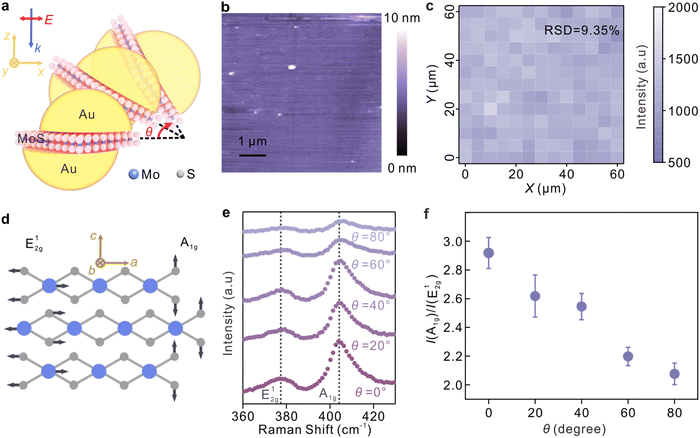
The simulation results are well supported by the experiments by employing a continuous thin film of molybdenum disulphide (MoS2), which has been verified with the determined lattice orientation in the nanocavities, as a spacer layer in the nanocavities. Fig. 3a depicts the polarization-dependent SERS enhancement from the sandwich plasmonic nanocavities, and θ represents the angle between the laser polarization and the x-y plane. The continuous MoS2 thin films were obtained by chemical vapor deposition on silicon substrates. The X-ray photoelectron spectroscopy of the MoS2 layer is shown in Fig. S5.† The fabrication was similar to the procedures described in the above sections, and the details are available in Fig. S6.† The lattice orientation of the MoS2 layer is well defined, and thus the out-of-plane mode (A1g) and in-plane mode (E12g) can be extracted from the Raman spectroscopy independently. The continuity of the MoS2 layers was illustrated by the atomic force microscopy (AFM) image in Fig. 3b, and the good homogeneity of the MoS2 sandwiched nanocavities was further characterized by the SERS intensity map in Fig. 3c. The changes in the molecular-induced dipole moment of MoS2 were characterized and the data are shown in Fig. 3e and f. The Raman peaks at 378 cm−1 and 404 cm−1, corresponding to the in-plane mode (E12g) and out-of-plane mode (A1g), respectively, were discerned from the Raman spectra. Atomic displacements of these two modes are shown in Fig. 3d, where the directions of a, b, and c are along the x, y, and z directions of the nanocavity, respectively.
It is observed that the maximum enhancement of the out-of-plane mode was obtained when the laser polarization is parallel to the x–y plane while the maximum of the in-plane mode was obtained in the case that the polarization is parallel to the z-axis. Therefore, the monotonicity between the intensity ratio between the E12g and A1g modes and the enhancement factors of the transverse fields (Ex, Ey) and longitudinal fields (Ez), respectively, can be established.47Fig. 3f plots the tendency of the intensity ratio as a function of the laser polarization angles. A significant decrease in the intensity ratio was observed with the increase of the incident angle θ, suggesting that the sandwich plasmonic nanocavities can work as a polarization selective ruler to selectively amplify the Raman modes of the molecules, and then identify the adsorption configurations. According to the surface selection rule, strong Raman enhancement can be expected when the polarizability of the vibrational mode is aligned with the EM direction.25,53 Therefore, the adsorption configuration of molecules can be determined by evaluating the changes in the mode intensity as a function of the EM polarizations. The determination of the molecular adsorption configuration using the sandwich plasmonic nanocavity is illustrated in Fig. 4. R6G molecule was employed as an illustration, and its spatial scale is 1.1 nm, 1.1 nm, and 0.9 nm in three dimensions, respectively.37
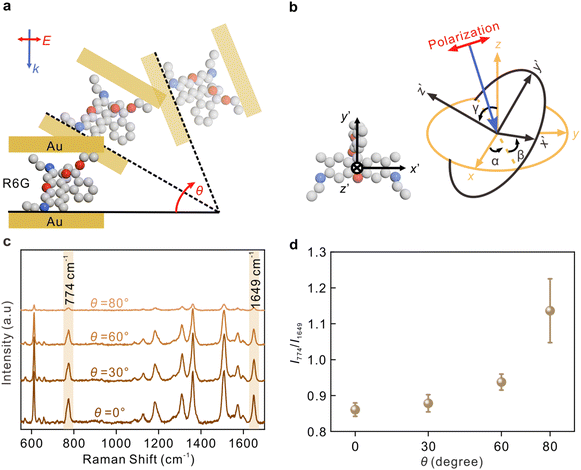
The angle between the incident light and nanocavity is modulated by rotating the sample, as shown in Fig. 4a. Fig. 4b depicts the molecular coordinate system with the coordinate origin located at the center of the molecular xanthene ring, the x′-axis along the long axis, the y′-axis along the short axis, and z′-axis along the normal direction of the xanthene. The angles between molecular coordinates and nanocavity coordinates are described by α, β, and γ, respectively.
The Raman spectra of R6G at different angles from 0° to 80° from the sandwich cavities are presented in Fig. 4c. The corresponding assignments of the Raman peaks are summarized in Table S1.† Two typical modes, the C–H out-of-plane bending in the xanthene ring at 774 cm−1 containing αxy and the C–C stretching related in the xanthene ring at 1649 cm−1 containing αzz, were investigated.25 These two modes were selectively enhanced by modulating the incident angle, and their intensity ratio as a function of the rotating angle θ is plotted in Fig. 4d. The SERS sensitivity at 80° was relatively decreased because the effective detection area under the laser spot was decreased. As mentioned in previous discussions, the increase of θ is accompanied by a decrease in the intensity ratio Ez/Ex, and therefore, the component Raman tensors paralleling or perpendicular to the sample surface can be selectively enhanced by modulating the angle θ. The results in Fig. 4d reveal that there was an increase in I774/I1649 with the increase of θ, indicating that the xanthene ring of R6G was most likely to be vertical to the metal surface.
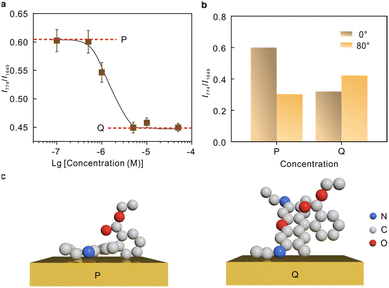
The intensity ratio as a function of the molecular concentrations was recorded in Fig. 5a. The curve tends to be horizontal at the low concentration (P) and high concentration (Q) ends, and a significant drop is observed at ∼10−6 M. The polarization-depend SERS studies at 1.0 × 10⁻⁷ M and 5 × 10⁻⁶ M representing the low concentrations and high concentrations, respectively, are compared in Fig. 5b (Raman spectra see Fig. S7†). The comparison suggests that the two modes at 774 cm−1 and 1649 cm−1 underwent different Raman enhancements at P and Q, respectively, indicating a difference in the molecular adsorption orientations. The molecular orientation is related to the packing density of the molecule, and thus the adsorption orientation can be stable within a certain concentration range.54,55 Currently, there are different perspectives on the most probable adsorption configuration of R6G. Despite the arguments, it is commonly agreed that R6G can form a chemical bond with the metal by the nitrogen atom with free electron pairs. This is confirmed by the vibrational mode at 234 cm−1 shown in Fig. S6.† Therefore, it can be preliminarily determined that angle α is arbitrary. The results in Fig. 5b suggest that the tilt angle β between the xanthene plane and metal surface is large at high molecular concentrations, and the molecular xanthene rings tend to lie flatly on the metal surface at low concentrations. Hence, we deduce that the adsorption configuration gradually changes from “flat” to “upright” on Au with the increase of molecular concentrations, and the corresponding proposed adsorption configurations are plotted in Fig. 5c.
Conclusions
To conclude, the determination of molecular orientation is demonstrated by polarization-dependent studies performed by employing the sub-nanoscale plasmonic nanocavities. The nanocavity works as a surface selection ruler, amplifying the Raman modes which are aligned with the EM fields. Therefore, the adsorption configurations of target molecules can be identified by judging the Raman intensity ratio between the in-plane and out-of-plane modes of the molecule as a function of the polarization angles. We investigated the mostly used Raman probe R6G on the Au surface, and the experiment results suggest that R6G adsorbs on Au primarily via an ethylamine group and the xanthene ring tends to lie on the metal surface flatly at low concentrations, and the molecular orientation gradually changes from “flat” to “upright” with the increase of molecular concentrations. The flexible sandwich plasmonic nanocavities offer a universal platform to study the adsorption configurations of molecules on metal surfaces, which is crucial to understand the molecular behavior in chemistry.Experimental
Fabrication of the plasmonic nanoarrays by template-assisted E-beam evaporation
The porous AAO membrane was produced by anodizing aluminium foil in phosphoric acid solution at 40 V. It was subsequently peeled off from the aluminium foil by a three-step etching method.39 The Au nanoparticles were evaporated onto the substrates through the AAO pores by an electron beam evaporator at 4 × 10⁻⁴ Pa with a rate of 0.05 nm s−1. The AAO was removed by tape after evaporation, leaving the Au nanoparticles on the substrate. The diameter of the nanoparticles was 75 nm and the gap between the particles was 25 nm.Fabrication of the sandwich nanocavities
PMMA membranes were spin-coated on the Au nanoarrays at 600 rpm and then baked at 120 °C for 30 min. The membranes were subsequently separated from substrates in a hot alkaline solution to obtain the flexible plasmonic membranes. Two membranes with identical parameters were adhered together by the van der Waals force to form the nanocavity and were then dried in the air. The self-assembly monolayer of R6G was formed between the membranes during the adhesion. The monolayer MoS2 was transferred onto one membrane before the adhesion. Details are available in Fig. S6.†Characterization and Raman detection of samples
Images to obtain surface morphologies were acquired using a scanning electron microscope (FEI Inspect F50). The Raman spectra were collected using a LabRAM HR800 Raman system (Horiba Jobin Yvon) under a 633 nm laser with a 50× magnification objective lens (NA = 0.55). The XRD patterns were obtained using a Rigaku smartlab. The UV-visible spectra were collected on a HITACHI U-3900 spectrometer. The Raman spectra from Au/MoS2/Au and Au/molecules/Au were collected with an integral time of 5 s under irradiation at 1 mW and 0.1 mW, respectively. The spot size for the laser was about ∼1 μm2.Simulations
The simulations of the EM fields around plasmonic structures were carried out by the FEM method. The wavelength of the incident laser was 633 nm and the electric field density E0 was 1 V m−1. The scattering boundary conditions were applied along the x and y axes. The particle diameter was set to 75 nm and the nanogap between the AuNPs was set at 1 nm referenced on the size of the molecules.Author contributions
The manuscript was written through the contributions of all the authors. All authors have given approval for the final version of the manuscript. L. Y., M. L., and X. F. conceived the idea and designed the experiment. L. Y., X. T., and Y. W. conducted the experiments. G. L. and W. J. charged the simulation. The manuscript was revised by Q. H. and T. Q.Conflicts of interest
There are no conflicts to declare.Acknowledgements
Q. H. acknowledges the National Natural Science Foundation of China (Grant 22004016). T. Q. acknowledges the National Natural Science Foundation of China (Grant 11874108). J. W. acknowledges support from the National Natural Science Foundation of China (Grant No. 62105080).References
- J. Mathe, A. Aksimentiev, D. R. Nelson, K. Schulten and A. Meller, Proc. Natl. Acad. Sci. U. S. A., 2005, 102, 12377–12382 CrossRef CAS PubMed.
- J. J. Sun, H. S. Su, H. L. Yue, S. C. Huang, T. X. Huang, S. Hu, M. M. Sartin, J. Cheng and B. Ren, J. Phys. Chem. Lett., 2019, 10, 2306–2312 CrossRef CAS PubMed.
- K. Brandt, M. E. Chiu, D. J. Watson, M. S. Tikhov and R. M. Lambert, J. Am. Chem. Soc., 2009, 131, 17286–17290 CrossRef CAS PubMed.
- P. Wang, Y. Ma, P. Yin, D. Cai, S. Wan and Q. Zheng, Chem. Eng. J., 2021, 418, 129497 CrossRef CAS.
- D. Yokoyama, J. Mater. Chem., 2011, 21, 19187–19202 RSC.
- A. Hofmann, M. Schmid and W. Brütting, Adv. Opt. Mater., 2021, 9, 2101004 CrossRef CAS.
- M. Ito and W. Suetaka, J. Phys. Chem., 1975, 79, 1190–1193 CrossRef CAS.
- S. Attia, E. J. Spadafora, M. C. Schmidt, C. Schroder, A. K. Baumann and S. Schauermann, Phys. Chem. Chem. Phys., 2020, 22, 15696–15706 RSC.
- Y. Nishijima, Y. Onogi and T. Asai, J. Polym. Sci., Part C: Polym. Symp., 1967, 15, 237–250 CrossRef.
- J. Engelhardt, J. Keller, P. Hoyer, M. Reuss, T. Staudt and S. W. Hell, Nano Lett., 2011, 11, 209–213 CrossRef CAS PubMed.
- D. Yokoyama and C. Adachi, J. Appl. Phys., 2010, 107, 123512 CrossRef.
- T. F. Heinz, H. W. K. Tom and Y. R. Shen, Phys. Rev. A, 1983, 28, 1883–1885 CrossRef CAS.
- C. L. Chiang, C. Xu, Z. Han and W. Ho, Science, 2014, 344, 885–888 CrossRef CAS PubMed.
- F. J. Giessibl, Science, 1995, 267, 68–71 CrossRef CAS PubMed.
- J. Zhang, P. Chen, B. Yuan, W. Ji, Z. Cheng and X. Qiu, Science, 2013, 342, 611–614 CrossRef CAS PubMed.
- R. Otero, F. Hummelink, F. Sato, S. B. Legoas, P. Thostrup, E. Laegsgaard, I. Stensgaard, D. S. Galvao and F. Besenbacher, Nat. Mater., 2004, 3, 779–782 CrossRef CAS PubMed.
- C. Van Dyck, B. Fu, R. P. Van Duyne, G. C. Schatz and M. A. Ratner, J. Phys. Chem. C, 2017, 122, 465–473 CrossRef.
- S. Y. Ding, E. M. You, Z. Q. Tian and M. Moskovits, Chem. Soc. Rev., 2017, 46, 4042–4076 RSC.
- X. Wang, S.-C. Huang, S. Hu, S. Yan and B. Ren, Nat. Rev. Phys., 2020, 2, 253–271 CrossRef.
- Q. Hao, Z. Peng, J. Wang, X. Fan, G. Li, X. Zhao, L. Ma, T. Qiu and O. G. Schmidt, Anal. Chem., 2022, 94, 1046–1051 CrossRef CAS PubMed.
- Z. Q. Tian, B. Ren, J. F. Li and Z. L. Yang, Chem. Commun., 2007, 3514–3534 RSC.
- H. Xu, J. Aizpurua, M. Kall and P. Apell, Phys. Rev. E: Stat. Phys., Plasmas, Fluids, Relat. Interdiscip. Top., 2000, 62, 4318–4324 CrossRef CAS PubMed.
- M. Moskovits, J. Chem. Phys., 1982, 77, 4408–4416 CrossRef CAS.
- L.-J. Wan, M. Terashima, H. Noda and M. Osawa, J. Phys. Chem. B, 2000, 104, 3563–3569 CrossRef CAS.
- S. Thomas, S. Venkateswaran, S. Kapoor, R. D'Cunha and T. Mukherjee, Spectrochim. Acta, Part A, 2004, 60, 25–29 CrossRef CAS PubMed.
- S. J. Bae, C. R. Lee, I. S. Choi, C. S. Hwang, M. S. Gong, K. Kim and S. W. Joo, J. Phys. Chem. B, 2002, 106, 7076–7080 CrossRef CAS.
- S. W. Joo, W. J. Kim, W. S. Yoon and I. S. Choi, J. Raman Spectrosc., 2003, 34, 271–275 CrossRef CAS.
- J. J. Baumberg, J. Aizpurua, M. H. Mikkelsen and D. R. Smith, Nat. Mater., 2019, 18, 668–678 CrossRef CAS PubMed.
- A. R. L. Marshall, J. Stokes, F. N. Viscomi, J. E. Proctor, J. Gierschner, J. G. Bouillard and A. M. Adawi, Nanoscale, 2017, 9, 17415–17421 RSC.
- K. F. Domke, D. Zhang and B. Pettinger, J. Am. Chem. Soc., 2006, 128, 14721–14727 CrossRef CAS PubMed.
- R. Zhang, Y. Zhang, Z. C. Dong, S. Jiang, C. Zhang, L. G. Chen, L. Zhang, Y. Liao, J. Aizpurua, Y. Luo, J. L. Yang and J. G. Hou, Nature, 2013, 498, 82–86 CrossRef CAS PubMed.
- J. Lee, K. T. Crampton, N. Tallarida and V. A. Apkarian, Nature, 2019, 568, 78–82 CrossRef CAS PubMed.
- N. Jiang, N. Chiang, L. R. Madison, E. A. Pozzi, M. R. Wasielewski, T. Seideman, M. A. Ratner, M. C. Hersam, G. C. Schatz and R. P. Van Duyne, Nano Lett., 2016, 16, 3898–3904 CrossRef CAS PubMed.
- P. Liu, X. Chen, H. Ye and L. Jensen, ACS Nano, 2019, 13, 9342–9351 CrossRef CAS PubMed.
- J. Xu, X. Zhu, S. Tan, Y. Zhang, B. Li, Y. Tian, H. Shan, X. Cui, A. Zhao, Z. Dong, J. Yang, Y. Luo, B. Wang and J. G. Hou, Science, 2021, 371, 818–822 CrossRef CAS PubMed.
- T. F. Heinz, C. K. Chen, D. Ricard and Y. R. Shen, Phys. Rev. Lett., 1982, 48, 478–481 CrossRef CAS.
- J. M. Klingsporn, N. Jiang, E. A. Pozzi, M. D. Sonntag, D. Chulhai, T. Seideman, L. Jensen, M. C. Hersam and R. P. Van Duyne, J. Am. Chem. Soc., 2014, 136, 3881–3887 CrossRef CAS PubMed.
- H. K. Turley, Z. W. Hu, L. Jensen and J. P. Camden, J. Phys. Chem. Lett., 2017, 8, 1819–1823 CrossRef CAS PubMed.
- Q. Hao, H. Huang, X. C. Fan, X. Y. Hou, Y. Yin, W. Li, L. F. Si, H. Y. Nan, H. Y. Wang, Y. F. Mei, T. Qiu and P. K. Chu, Nanotechnology, 2017, 28, 105301 CrossRef PubMed.
- Q. Hao, W. Li, H. Xu, J. Wang, Y. Yin, H. Wang, L. Ma, F. Ma, X. Jiang, O. G. Schmidt and P. K. Chu, Adv. Mater., 2018, 30, 1705421 CrossRef PubMed.
- X. Fan, Q. Hao, R. Jin, H. Huang, Z. Luo, X. Yang, Y. Chen, X. Han, M. Sun, Q. Jing, Z. Dong and T. Qiu, Sci. Rep., 2017, 7, 2322 CrossRef PubMed.
- Q. Hao, M. Li, J. Wang, X. Fan, J. Jiang, X. Wang, M. Zhu, T. Qiu, L. Ma, P. K. Chu and O. G. Schmidt, ACS Appl. Mater. Interfaces, 2020, 12, 54174–54180 CrossRef CAS PubMed.
- F. Schreiber, A. Eberhardt, T. Y. B. Leung, P. Schwartz, S. M. Wetterer, D. J. Lavrich, L. Berman, P. Fenter, P. Eisenberger and G. Scoles, Phys. Rev. B: Condens. Matter Mater. Phys., 1998, 57, 12476–12481 CrossRef CAS.
- A. Ulman, Chem. Rev., 1996, 96, 1533–1554 CrossRef CAS PubMed.
- R. A. Bissell, A. P. de Silva, H. Q. N. Gunaratne, P. L. M. Lynch, G. E. M. Maguire and K. R. A. S. Sandanayake, Chem. Soc. Rev., 1992, 21, 187–195 RSC.
- A. Ahmed, K. Banjac, S. S. Verlekar, F. P. Cometto, M. Lingenfelder and C. Galland, ACS Photonics, 2021, 8, 1863–1872 CrossRef CAS PubMed.
- W. Chen, S. Zhang, M. Kang, W. Liu, Z. Ou, Y. Li, Y. Zhang, Z. Guan and H. Xu, Light: Sci. Appl., 2018, 7, 56 CrossRef PubMed.
- Y. Wei, Q. Hao, X. Fan, M. Li, L. Yao, G. Li, X. Zhao, H. Huang and T. Qiu, ACS Appl. Mater. Interfaces, 2022, 14, 54320–54327 CrossRef CAS PubMed.
- K. L. Kelly, E. Coronado, L. L. Zhao and G. C. Schatz, J. Phys. Chem. B, 2003, 107, 668–677 CrossRef CAS.
- J. Petersen, J. Volz and A. Rauschenbeutel, Science, 2014, 346, 67–71 CrossRef CAS PubMed.
- D. Pan, H. Wei, L. Gao and H. Xu, Phys. Rev. Lett., 2016, 117, 166803 CrossRef PubMed.
- A. Aiello, P. Banzer, M. Neugebauer and G. Leuchs, Nat. Photonics, 2015, 9, 789–795 CrossRef CAS.
- M. Moskovits and J. S. Suh, J. Phys. Chem., 2002, 88, 5526–5530 CrossRef.
- M. P. Soriaga and A. T. Hubbard, J. Am. Chem. Soc., 2002, 104, 3937–3945 CrossRef.
- A. Barhoumi, D. Zhang and N. J. Halas, J. Am. Chem. Soc., 2008, 130, 14040–14041 CrossRef CAS PubMed.
Footnotes |
| † Electronic supplementary information (ESI) available: Fabrication of plasmonic nanoarrays with the AAO membranes. SEM images of the AAO membrane before and after pore broadening. XRD spectra of AuNPs on quartz. The fabrication of molybdenum disulphide nanocavity. The XPS spectra of the MoS2. Simulations of the EM fields in the nanocavities. The Raman spectra and modes assignment of Rhodamine 6G. The calculations of the enhancement factors. See DOI: https://doi.org/10.1039/d3nr01059g |
| ‡ These authors contributed equally to this work. |
| This journal is © The Royal Society of Chemistry 2023 |

