
 Open Access Article
 This Open Access Article is licensed under a Creative Commons Attribution-Non Commercial 3.0 Unported Licence
Improved activity for the oxygen evolution reaction using a tiara-like thiolate-protected nickel nanocluster†
Sota
Funaki
a,
Tokuhisa
Kawawaki
 *ab,
Tomoshige
Okada
a,
Kana
Takemae
a,
Sakiat
Hossain
b,
Yoshiki
Niihori
b,
Takumi
Naito
c,
Makito
Takagi
c,
Tomomi
Shimazaki
c,
Soichi
Kikkawa
d,
Seiji
Yamazoe
d,
Masanori
Tachikawa
c and
Yuichi
Negishi
*ab
*ab,
Tomoshige
Okada
a,
Kana
Takemae
a,
Sakiat
Hossain
b,
Yoshiki
Niihori
b,
Takumi
Naito
c,
Makito
Takagi
c,
Tomomi
Shimazaki
c,
Soichi
Kikkawa
d,
Seiji
Yamazoe
d,
Masanori
Tachikawa
c and
Yuichi
Negishi
*ab
aDepartment of Applied Chemistry, Faculty of Science, Tokyo University of Science, 1-3 Kagurazaka, Shinjuku-ku, Tokyo 162-8601, Japan. E-mail: kawawaki@rs.tus.ac.jp; negishi@rs.tus.ac.jp; Fax: +81-3-5261-4631; Tel: +81-3-5228-9145
bResearch Institute for Science and Technology, Tokyo University of Science, 1-3 Kagurazaka, Shinjuku-ku, Tokyo 162-8601, Japan
cGraduate School of NanoBioScience, Yokohama City University, 22-2 Seto, Kanazawa-ku, Yokohama 236-0027, Japan
dDepartment of Chemistry, Graduate School of Science, Tokyo Metropolitan University, 1-1 Minami-Osawa, Hachioji-shi, Tokyo 192-0397, Japan
First published on 7th February 2023
Abstract
Practical electrochemical water splitting and carbon-dioxide reduction are desirable for a sustainable energy society. In particular, facilitating the oxygen evolution reaction (OER, the reaction at the anode) will increase the efficiency of these reactions. Nickel (Ni) compounds are excellent OER catalysts under basic conditions, and atomically precise Ni clusters have been actively studied to understand their complex reaction mechanisms. In this study, we evaluated the geometric/electronic structure of tiara-like metal nanoclusters [Nin(PET)2n; n = 4, 5, 6, where PET refers to phenylethanethiolate] with the same SR ligand. The geometric structure of Ni5(SR)10 was determined for the first time using single-crystal X-ray diffraction. Additionally, combined electrochemical measurements and X-ray absorption fine structure measurements revealed that Ni5(SR)10 easily forms an OER intermediate and therefore exhibits a high specific activity.
Introduction
Polynuclear metal complexes, termed metal nanoclusters (NCs), exhibit physicochemical properties that differ from those of bulk metals composed of the same metal elements. These metal NCs can be synthesized as stable compounds using thiolate (SR),1–8 which plays a role in preventing the oxidation of metal atoms from air. Furthermore, such metal NCs have attracted much attention as highly functional new materials in catalysis, bioimaging, and sensing.9–13 In particular, tiara-like metal NCs (TNCs) are cyclic compounds containing metals. TNCs composed of group 10 transition metals can be synthesized easily with atomic precision under air using SR ligands.14,15 Furthermore, the synthesized TNCs can be separated by thin-layer chromatography (TLC), gel permeation chromatography, or high-performance liquid chromatography to obtain TNCs with atomic precision.16–18 Tiara-like nickel (Ni) NCs (Nin(SR)2n) including various numbers of metal atoms have also been synthesized with several SR ligands19–34 and their applications have been studied, including hydrogenation of nitrophenol35 and nitrile,36 oxidation of ascorbic acid,37 hydrogen evolution from water using a photocatalyst38 or an electrocatalyst,39 and photocatalytic methane oxidation.40Meanwhile, in recent years, researchers have focused on achieving practical use of electrochemical water splitting and carbon-dioxide reduction for the realization of a sustainable energy society. However, the efficient use of the oxygen evolution reaction (OER, an anodic reaction occurring at the counter electrode in both reactions) is particularly important for further enhancement of the functionality of these reaction systems. The base metal Ni is an excellent OER catalyst under basic conditions, and Nin(SR)2n exhibits a high OER activity.41–43 Thus, the use of metal NCs with unambiguous structures as catalysts is expected to help researchers understand the correlation between electrocatalytic activity and the geometric structure of the catalysts, and thereby elucidate the mechanism of electrocatalytic activity.44–48 However, few reports have compared the structure and OER activity of Nin(SR)2n (n = 4, 5, 6) with the same SR ligand, and the correlation between the structure and activity is still unclear in many cases.41–43 Therefore, it is desirable to elucidate the geometric structure and its correlation with the OER activity using the same type of SR ligand for Nin(SR)2n (n = 4, 5, 6) (Fig. 1).
 | ||
| Fig. 1 Schematic of the purpose of this study. TNC: tiara-like metal nanocluster. PET: 2-phenylethanethiolate. CB: carbon black. OER: oxygen evolution reaction. | ||
In this study, we successfully determined the geometric structure of Ni5(PET)10 (PET = 2-phenylethanethiolate) for the first time by single-crystal X-ray diffraction (SC-XRD). Using the obtained Nin(PET)2n (n = 4, 5, 6), we also prepared Nin(PET)2n/carbon black (CB) (n = 4, 5, 6) catalysts with a higher OER activity than general Ni oxide (NiO) nanoparticle (NP) catalysts. Furthermore, among the Nin(PET)2n/CB (n = 4, 5, 6), Ni5(PET)10/CB exhibited particularly high OER activity compared with Ni4(PET)8/CB and Ni6(PET)12/CB because of easy formation of an OER intermediate.
Results and discussion
Characterization of Nin(PET)2n (n = 4, 5, 6)
The matrix-assisted laser desorption/ionization (MALDI) mass spectra of the obtained products (1–3) are shown in Fig. 2a and S1.† Compounds 1–3 exhibited peaks centered at m/z = 1332, 1664, and 1998, respectively, in the positive ionization mode. The interval of the isotope pattern was m/z = 1, indicating that the products were monovalent. The peak positions of 1–3 are in good agreement with [Nin(PET)2n + H]+ (n = 4, 5, 6), respectively.49 The ultraviolet–visible (UV-Vis) absorption spectra of 1–3 indicate similar shapes to the previously reported spectra of Nin(PET)2n (n = 4, 5, 6) (Fig. 2b). In the Fourier-transform infrared (FT-IR) spectra, the peaks were attributable to phenyl and ethylene groups in PET (Fig. S2 and Table S1†). On the basis of these results, we determined 1–3 as [Nin(PET)2n]0 (n = 4, 5, 6), respectively.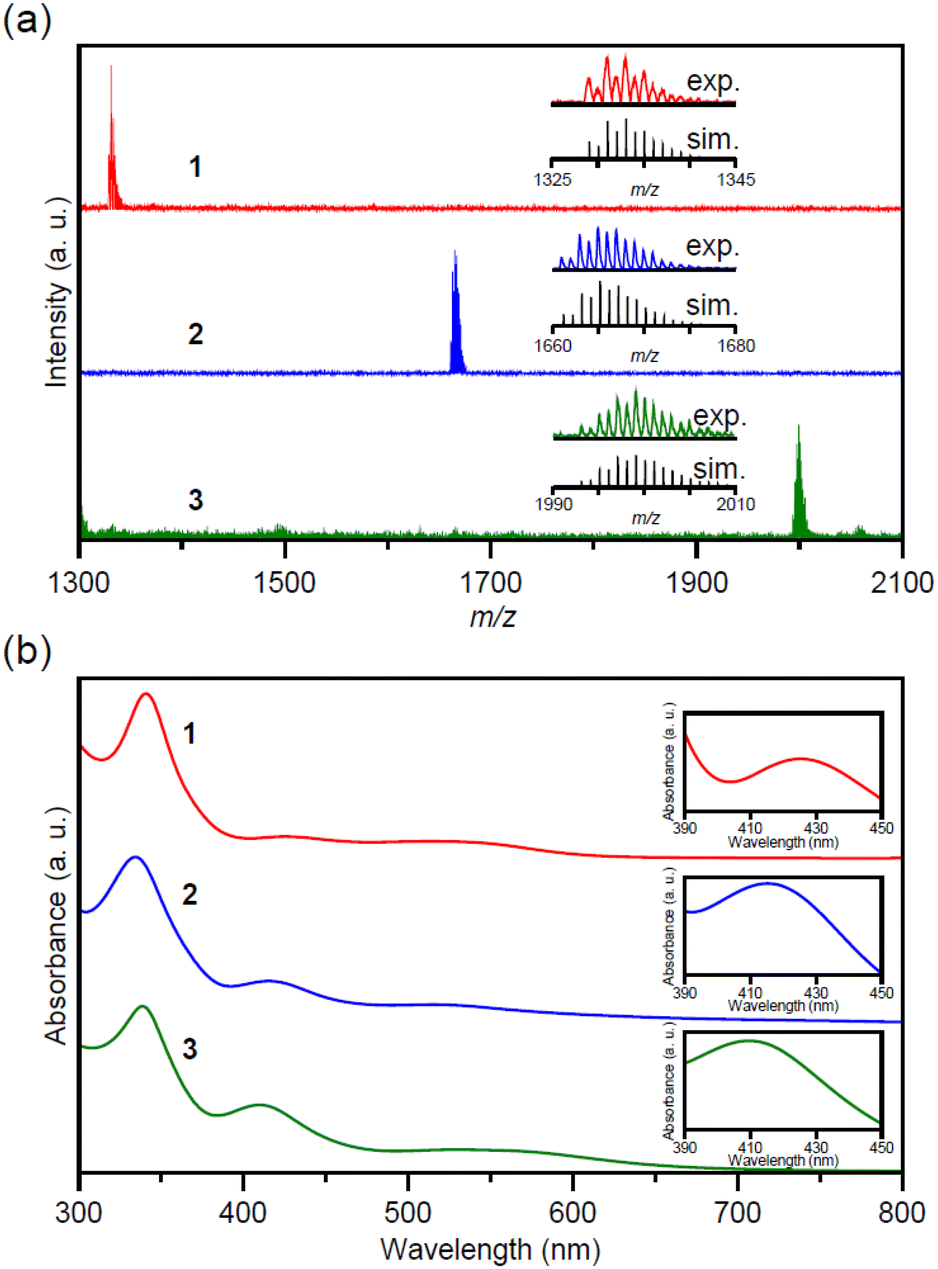 | ||
| Fig. 2 (a) Positive-ion MALDI mass spectra of 1–3. Insets: comparison of the isotope pattern between the experimental spectra (exp; red, 1; blue, 2; green, 3) and the simulated spectra (sim; black). (b) UV-Vis absorption spectra of 1–3. Insets: comparison of peak maxima at ∼410 nm. | ||
Fig. S3 and S4† show the results of X-ray absorption fine structure (XAFS) measurements of 1–3. In the Ni K-edge X-ray absorption near-edge structure (XANES) spectra of 1–3 (Fig. S3†), we observed a broad pre-edge peak originating from the transition of the tetracoordinated divalent Ni ion (Ni2+) from the 1s to the 3d orbital at ∼8331 eV similar to NiO and Ni(OH)2. There were almost no differences in the position of this peak between 1 and 3, indicating that the Ni 3d orbitals in 1–3 were similar. In addition, we observed a peak at ∼8336 eV in the spectra of 1–3. This peak is attributable to the transition from 1s to 4p of Ni2+ and the charge transfer (CT) transition to the ligands, indicating the presence of a strong covalent Ni–S bond in 1–3.50,51 Fig. S4† shows the Ni K-edge Fourier-transform extended XAFS (FT-EXAFS) spectra of 1–3. We did not observe peaks derived from Ni–O bonds (∼1.8 Å), Ni–Ni bonds (∼2.1 Å), or Ni–O–Ni bonds (∼2.6 Å); only a peak (1.9 Å) derived from Ni–S bonds was observed.51–55 These results indicate that Ni was directly bonded to the S in PET as the ligand in 1–3.
The UV-Vis absorption spectra of 1–3 in Fig. 2b show the characteristic absorption peaks from ∼340 to ∼410 nm, and these exhibited overall similar shapes. This indicates that 1–3 had similar electronic structures overall. Additionally, the absorption peak at ∼410 nm shifted to shorter wavelengths and the absorption intensity increased, with an increasing number of Ni atoms. We performed density functional theory (DFT) calculations of [Ni6(PET)12]0 (3) to elucidate these features. First, we calculated the optimized structures (Fig. S5†) in tetrahydrofuran (THF) (3′) and in a vacuum (3′′) of [Ni6(PET)12]0 and then calculated the corresponding optical absorption spectra (Fig. S6†). The results revealed the following: (1) ∼410 nm peak in the UV-Vis spectrum of 3 is mainly due to d–d transitions between Ni atoms and (2) ∼340 nm peak is mainly caused by CT transitions from the phenyl group to Ni and the S in PET. Previous studies by other groups have also attributed the absorption peak at ∼340 nm to the CT transition from the PET-derived S 3p π orbital to the Ni 3d orbital;41,49 our calculations are consistent with these previous reports. On the basis of the results of these DFT calculations, we interpreted the change in the absorption peak at ∼410 nm observed in Fig. 2b with the differences in the number of Ni atoms to be due to the differences in the distance between the Ni and Ni of 1–3 described in a subsequent paragraph.
Regarding the geometric structure of [Nin(PET)2n]0 (n = 4, 5, 6), a previous study has revealed the geometric structures of [Ni4(PET)8]0 (1) and [Ni6(PET)12]0 (3) by SC-XRD (Fig. 3a, b and S7†).42 However, the geometric structure of [Ni5(PET)10]0 has only been predicted by theoretical calculations. In this study, we determined the geometric structure of [Ni5(PET)10]0 (2) by SC-XRD for the first time (Fig. 3a, b and Table S2†). The result revealed that [Ni5(PET)10]0 consisted of a ring with five Ni atoms in the plane and five S atoms bridged above and below the plane, in total ten S atoms, almost as predicted by theoretical calculations.
 | ||
| Fig. 3 Geometric structure of 1–3 determined by SC-XRD from (a) the top view and (b) the side view. Hydrogen atoms and solvents are omitted for clarity. Ni: light green, S: yellow, and carbon: gray. The geometric structures of 1 and 3 were obtained from ref. 42. | ||
Next, we compared the obtained geometric structures of [Nin(PET)2n]0 (n = 4, 5, 6) (Fig. 4 and S8; Tables S3 and S4†). The average bond length of the Ni–S bonds and the average angles of the S–Ni–S bonds in 1–3 were ∼2.20 Å and ∼98°, respectively, indicating no differences in terms of the number of constituent Ni atoms. Regarding the average Ni–Ni–Ni angle, these are ideal angles in regular polygons (90.0°, 108.0°, and 120.0°). However, the average length of the Ni–Ni distance (from 2.67 Å to 2.93 Å) and the average Ni–S–Ni angle (from 74.3° to 83.5°) increased as the number of constituent Ni atoms increased. These results indicate that in 1–3, the Ni–S–Ni angle extended in the horizontal direction of the ring structure with an increase in the number of constituent Ni atoms while maintaining the Ni–S bond length (Fig. 4a, b and S8†). These features are overall in good agreement with those reported for Nin(SR)2n (n = 4–12) with different ligands.34
 | ||
| Fig. 4 (a) Relevant geometric parameters for the structure of 2. (b) Averages and (c) standard deviations of Ni–Ni–Ni, S–Ni–S, and Ni–S–Ni angles (°)and lengths of the Ni–Ni distance and the Ni–S bond (Å). SD: standard deviation. Relevant geometric parameters used for the analysis of structures 1–3 are shown in Fig. S8(A).† In (c), the SD represents the disorder of each interatomic distance and angle, and a larger SD means a more distorted structure of compounds. | ||
Regarding the average angles for Ni–Ni–Ni, S–Ni–S, and Ni–S–Ni bonds in these geometric structures, 2 had the largest standard deviation (SD). This indicates that 2 exhibits the most distorted geometric structure among 1–3. The direction of PET alternates between the vertical (V site) and horizontal (H site) directions against the ring structure to avoid steric repulsion between PETs (Fig. S9†). In the case of 1 and 3, which form even-numbered polygons, this alternation between PETs is possible. However, in the case of 2, which forms odd-numbered polygons, such a perfect alternation is not possible.56 We can interpret that the distortion of the structure was larger in 2 than in 1 and 3 due to this imperfect alternation. Regarding Mn(SR)2n (M = Ni; palladium, Pd; platinum, Pt), many studies have reported the synthesis of Mn(SR)2n with an even number of metal atoms.17–21,23,24,27,28,30,32–34 This is assumed to be largely related to their high stability caused by a perfect alternation. In addition, the distortion of the structure in 2 is larger than that in Ni5(SCH2CH3)10 and Ni5(SCH2SiMe3)10.25,26 It can be considered that since PET exhibits a bulkier geometric structure than SCH2SiMe3 and SCH2CH3, a larger strain occurs in 2 than in Ni5(SCH2SiMe3)10 and Ni5(SCH2CH3)10 (Fig. S10, Tables S5 and S6†).
We also examined the stability of 1–3 against deterioration in solution by tracking the change in the optical absorption of 1–3 dissolved in THF over time. We observed no substantial differences in the stability of 1–3 (Fig. S11†). As shown in Fig. S7,† there were π–π and C–H⋯π interactions between phenyl groups at the surface of 1–3. We assume that these ligand interactions suppress the dissociation of 1–3,57 leading to the fact that 2 also exhibits the same stability as 1 and 3. Thus, when we use PET as the ligand, 2 (an odd number of metal atoms) could also be stably isolated.
Characterization of Nin(PET)2n(n = 4, 5, 6)/CB and NiO-IM/CB
We prepared Nin(PET)2n/CB (n = 4, 5, 6) catalysts using 1–3 (see the Experimental section). In addition, a NiO NP catalyst (NiO-IM/CB) (IM; impregnation) was prepared for comparison. The XAFS spectra of Nin(PET)2n/CB (n = 4, 5, 6) (Fig. S12–S15†) implied that there were no substantial changes in the geometric/electronic structures of Nin(PET)2n (n = 4, 5, 6) before and after adsorption of 1–3 on CB. Fig. 5 shows transmission electron microscopy (TEM) images (Fig. S16†), high-angle annular dark-field scanning TEM (HAADF-STEM) images, and energy-dispersive spectroscopy (EDS) elemental mapping (Fig. S17 and S18†) of Nin(PET)2n/CB (n = 4, 5, 6). The average particle sizes of Nin(PET)2n (n = 4, 5, 6) on CB were ca. 0.6 ± 0.1, 0.6 ± 0.1, and 0.7 ± 0.1 nm, respectively. HAADF-STEM images and EDS elemental mapping confirmed that Nin(PET)2n (n = 4, 5, 6) were adsorbed monodispersely on CB (Fig. 5 and S17†). These results indicate that Nin(PET)2n (n = 4, 5, 6) were loaded uniformly on CB without aggregation in this study. Experiments with different loading weights of Nin(PET)2n (Fig. S16 and S19†) revealed that at least up to 5 wt% of Ni could be loaded onto CB without aggregation of Nin(PET)2n (n = 4, 5, 6). | ||
| Fig. 5 (a) TEM images and the resulting histograms of particle-size distribution of Ni4(PET)8/CB (left), Ni5(PET)10/CB (middle) and Ni6(PET)12/CB (right). (b) HAADF-STEM images and EDS elemental mapping (Ni, S, C and O) of Ni5(PET)10/CB. In (a) and (b), the loading weights of Ni are 0.5 and 5 wt%, respectively. | ||
OER activity of Nin(PET)2n/CB (n = 4, 5, 6)
Fig. 6a shows the results of linear sweep voltammetry (LSV) for each Ni catalyst [Nin(PET)2n/CB (n = 4, 5, 6) and NiO-IM/CB] in 0.1 M potassium hydroxide (KOH). As we applied the potential from the negative side to the positive side, each Ni catalyst produced a larger oxidation current than CB without a Ni catalyst. It can be understood that among the observed oxidation currents, the peak at 1.35 V vs. the reversible hydrogen electrode (RHE) is attributed to the oxidation current derived from the change from Ni2+ to Ni3+.58 When we applied a more positive potential than 1.45 V vs. RHE, the current density caused by the OER increased dramatically. We defined the overpotential to be the applied potential until the current density reaches 10 mA cm−2 and show the overpotential in Table S7† for each Ni catalyst. These results reveal a 31 mV decrease in the overpotential of Ni5(PET)10/CB compared with NiO-IM/CB. Fig. 6b shows the OER mass activity per Ni weight (at 1.55 V vs. RHE) for each Ni catalyst [Nin(PET)2n/CB (n = 4, 5, 6) and NiO-IM/CB]. Surprisingly, Ni5(PET)10/CB exhibited ca. 2.3 times higher OER mass activity than NiO-IM/CB. Ni4(PET)8/CB and Ni6(PET)12/CB also exhibited a slightly higher OER mass activity than NiO-IM/CB.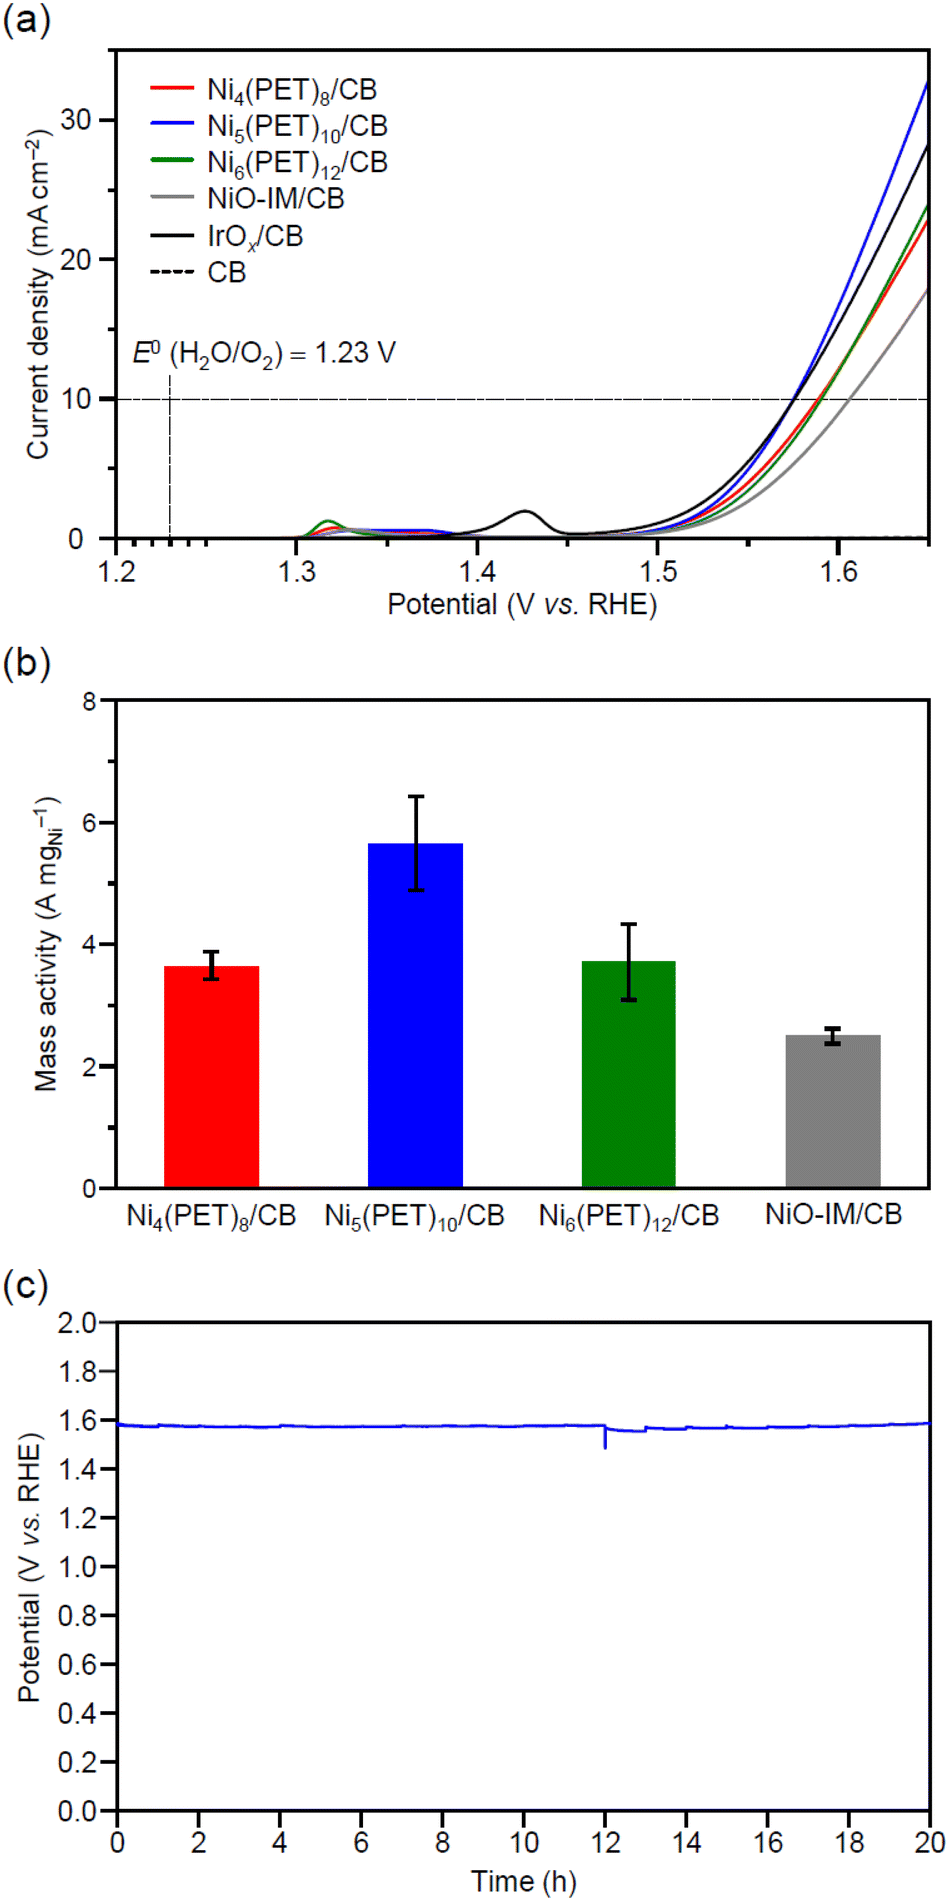 | ||
| Fig. 6 (a) Linear sweep voltammetry (LSV) curves and (b) mass activity at 1.55 V vs. RHE for Nin(PET)2n/CB (n = 4, 5, 6) and NiO-IM/CB on a glassy carbon (GC) electrode in 0.1 M KOH. (c) Chronopotentiometry curves for Ni5(PET)10/CB collected at 10 mA cm−2 for 20 hours on GC electrodes in 0.1 M KOH. The metal loading weight of all samples was 5 wt%, which was estimated by ICP-MS. In (a), LSV curves obtained for IrOx/CB and CB are also shown for comparison. | ||
To confirm that we correctly evaluated the OER activity in these measurements, we calculated the Tafel slope at 1.55 V vs. RHE, at which the OER mass activity was compared, for each Ni catalyst (Table S7 and Fig. S20†). In the OER, the first step (Step I) is the adsorption of OHads to the bare metal site (typical Tafel slope: 120 mV dec−1). In Step II, OHads is oxidized to Oads (typical Tafel slope: 60 mV dec−1), and in the subsequent Step III, Oads combines with a second OH− to form OOHads (typical Tafel slope: 40 mV dec−1). In the last Step IV, O2 gas is released and bare metal sites are regenerated; these sites are again available for the catalytic cycle.41,42 Considering this mechanism, if the obtained Tafel slope differed substantially from 40–120 mV dec−1, the OER activity might not have been properly evaluated. In our measurements, the Tafel slope for Ni5(PET)10/CB near 1.55 V vs. RHE was 70 mV dec−1, which confirms that we correctly evaluated the OER. Experiments with different loading weights of Ni catalysts confirmed that the OER activity can be correctly evaluated even at a lower loading weight of 0.5 wt% (Fig. S21†).
Regarding Ni5(PET)10/CB, which exhibited the highest activity, we also evaluated the durability of the activity (Fig. 6c, and S22†). Specifically, we performed chronopotentiometry at a current density of 10 mA cm−2 (1.96 mA). We observed no increase in the applied potential after 20 hours, and Ni5(PET)10/CB exhibited a stable OER activity. To investigate the change in the particle size of Ni5(PET)10/CB with the applied potential, we also obtained TEM images of Ni5(PET)10/CB after an applied potential (Fig. S16–S18†). The average particle size of Ni5(PET)10/CB after the applied potential was 0.6 ± 0.2 nm, which is similar to that of Ni5(PET)10/CB before the applied potential. These results indicate that the applied potential did not cause aggregation of Ni5(PET)10/CB (Fig. S16†).
Origin of high OER activity of Nin(PET)2n/CB (n = 4, 5, 6)
To clarify the origin of the specifically high OER activity of Ni5(PET)10/CB, we performed XAFS measurements on Ni5(PET)10/CB after applied potentials. Fig. 7a shows the Ni K-edge XANES spectra of Ni5(PET)10/CB upon an applied potential from 1.2–1.5 V vs. RHE. The absorption intensity at ∼8348 eV gradually increased as the applied potential shifted toward the positive side. When the applied potential increased to 1.5 V vs. RHE, Ni5(PET)10/CB was substantially oxidized. Fig. 7b shows the Ni K-edge FT-EXAFS spectra of Ni5(PET)10/CB upon an applied potential from 1.2–1.5 V vs. RHE. The peak derived from the Ni–S bond (∼1.9 Å) slightly shifted toward a short bond length after the applied potential. These results indicate that the Ni–O bond (∼1.8 Å) was generated after the applied potential, demonstrating that an OER intermediate was formed. The obvious Ni–O bond was observed when the applied potential was increased up to 1.6 V vs. RHE. We also observed such a change in the electronic structure for Ni4(PET)8/CB and Ni6(PET)12/CB after the LSV measurements (Fig. S23†). However, the changes in the electronic structure of Ni4(PET)8/CB and Ni6(PET)12/CB before and after the LSV measurements were smaller than those of Ni5(PET)10/CB (Fig. S23†). These results indicate that the OER intermediates adsorbed with oxygen formed more easily in Ni5(PET)10/CB than in Ni4(PET)8/CB and Ni6(PET)12/CB upon the applied potential. Based on the geometric structure of Nin(PET)2n (n = 4, 5, 6) obtained by SC-XRD, the exposed area of the Ni sites (4–6 Å) in 2 was larger than those in 1 and 3. Therefore, OH− (2.67 Å) should more easily approach the Ni site in 2 than in 1 and 3 (Fig. 8 and S24†). This is probably the main reason why Ni5(PET)10/CB formed the OER intermediate more easily than Ni4(PET)8/CB and Ni6(PET)12/CB, and thereby the reaction proceeded more easily on Ni5(PET)10/CB than on Ni4(PET)8/CB and Ni6(PET)12/CB. | ||
| Fig. 7 Ni K-edge (a) XANES spectra and (b) FT-EXAFS spectra for Ni5(PET)10/CB before and after applied potential at 1.2–1.5 V vs. RHE. Ni foil, NiO and Ni(OH)2 are also shown for comparison. | ||
 | ||
| Fig. 8 Space-filling models and percentage of exposed Ni sites in Nin(PET)2n (n = 4, 5, 6). The arrows indicate exposed Ni sites. The ratio of exposed Ni sites was estimated by dividing the amount of Ni sites with the exposed area (4–6 Å) by all Ni sites. | ||
To investigate the reason why Ni5(PET)10/CB exhibited a higher OER activity than NiO-IM/CB, we also evaluated the change in the electronic structure of Ni before and after an applied potential to NiO-IM/CB (Fig. S25†). The electronic structure of NiO-IM/CB is almost the same before and after the applied potential. For NiO-IM/CB prepared by calcination, a phase change is unlikely to occur during the applied potential, different from the case of the active transition metal sulfides,59 since a stable NiO phase is formed. We assumed that the dependence of the electronic structure of the Ni catalyst on the applied potential was one factor in the differences in the OER activities.
Finally, we note that the OER activity and electronic structure of the catalysts obtained in this study were substantially different from those of Nin(PET)2n/CB in the previous report.43 For example, the OER activity in this study was higher than that in the previous report and exhibited a different dependence on the number of metal atoms. In this study, we added Nafion during the catalyst slurry preparation. Thus, the interactions between Nin(PET)2n and the support, the accessibility of the substrate to the Nin(PET)2n surface, and the stability of the reaction intermediates should be different from those in the previous report. We assume that this difference in the catalyst slurry preparation resulted in the different OER activity and electronic structure during the reaction from those in the previous report.43
Conclusions
We synthesized Ni TNCs protected by the same SR ligands {[Nin(PET)2n]0; n = 4, 5, 6} with atomic precision. For Ni5(PET)10, we succeeded in determining the geometric structure by SC-XRD for the first time; [Ni5(PET)10]0 exhibited a distorted geometric structure and a larger exposed area of Ni sites than [Nin(PET)2n]0 (n = 4, 6). We have also succeeded in loading the obtained Ni TNCs on CB without aggregation. Interestingly, Ni5(PET)10/CB exhibited the highest OER activity among [Nin(PET)2n]0 (n = 4, 5, 6) thus prepared. It can be considered that the external reactants easily approach the Ni site of Ni5(PET)10 since the Ni site is largely exposed in Ni5(PET)10 than in Ni4(PET)8 and Ni6(PET)12. We expect that these findings lead to the elucidation of the mechanism of high OER activity of Ni sulfides and thereby the development of OER catalysts with a higher activity. In a future study, it is expected that the formation mechanism of the OER intermediates of Ni5(PET)10 will be elucidated by DFT calculations to provide a clear design guideline for synthesizing materials with activity exceeding that of conventional OER materials.Experimental
Synthesis of Nin(PET)2n (n = 4, 5, 6)
Nin(PET)2n (n = 4, 5, 6) were synthesized using the reported method49 by Z. Wang et al. with some modifications (Scheme S1†). The entire reaction was carried out in a 50 mL vial at 25 °C under air. First, nickel nitrate hexahydrate (NiNO3·6H2O, 200 mg, 0.69 mmol) was added to n-propanol (12 mL) and stirred for 20 min until complete dissolution. The solution was then stirred vigorously and 2-phenylethanethiol (0.186 mL, 1.38 mmol) was slowly added to the solution. At this time, the color of the solution gradually changed from light green to brown. The solution was stirred for 15 min to facilitate the complete reaction of Ni2+ with 2-phenylethanethiol. Triethylamine (NEt3, 0.5 mL) was then added rapidly to the solution and the color of the solution immediately changed to dark brown. After stirring for 3 h, the crude products were washed three times with methanol to remove unreacted precursors. The crude products were then extracted with dichloromethane (DCM) and were separated by TLC (DCM![[thin space (1/6-em)]](https://www.rsc.org/images/entities/char_2009.gif) :hexane = 3:4, v:v). Layers 1–3 from the top of the TLC shown in Fig. S26† were collected and extracted with DCM (1–3). Regarding 2, the single crystal of 2 was obtained using a liquid–liquid diffusion method (DCM:methanol = 1:2) and its geometric structure was determined by SC-XRD (Table S2†).
:hexane = 3:4, v:v). Layers 1–3 from the top of the TLC shown in Fig. S26† were collected and extracted with DCM (1–3). Regarding 2, the single crystal of 2 was obtained using a liquid–liquid diffusion method (DCM:methanol = 1:2) and its geometric structure was determined by SC-XRD (Table S2†).
Preparation of Ni catalyst
Electrochemical measurements
The prepared Ni catalysts [Nin(PET)2n/CB; n = 4, 5, 6, NiO-IM/CB] were added to a solution (12.8 mg for Nin(PET)2n/CB and 10.6 mg for NiO-IM/CB) consisting of ultrapure water (19.1 mL), 2-propanol (6 mL), and Nafion solution (100 μL). The obtained mixture was sonicated in an ice-water bath for 30 min to disperse the Ni catalyst and afford a catalyst slurry. The catalyst slurry (10 μL) was cast spread over an entire glassy carbon (GC) electrode and dried at 60 °C for 15 min. Then, electrochemical measurements were performed in 0.1 M KOH using the GC coated with the prepared catalyst slurry as the working electrode, a Pt coil counter electrode, and a silver/silver chloride (Ag/AgCl) reference electrode to form a three-electrode system (Fig. S27†). The detailed protocol of the electrochemical measurements61 is shown in Schemes S4 and S5.†Author contributions
T. K. and Y. Negishi conceived the research and designed the experiments. T. K., S. H., Y. Niihori, and Y. Negishi designed the synthesis and electrocatalytic tests. S. F., T. O., and K. T. performed the synthesis, characterization, and electrocatalytic activity procedures. T. N., M. Takagi, T. S. and M. Tachikawa performed the theoretical calculations. T. K., S. K., and S. Y. performed the XAFS measurements. T. K. and Y. Negishi wrote the manuscript.Conflicts of interest
There are no conflicts to declare.Acknowledgements
We thank Yuki Iwamatsu (Tokyo University of Science) for technical assistance. This work was supported by the Japan Society for the Promotion of Science (JSPS) KAKENHI (grant number 20H02698 and 20H02552), the Scientific Research on Innovative Areas “Innovations for Light-Energy Conversion” (grant number 18H05178 and 20H05115), and the Scientific Research on Innovative Areas “Hydrogenomics” (grant number 21H00026 and 21H00027). Funding from the Yazaki Memorial Foundation for Science and Technology, the Sasakawa Scientific Research Grant from the Japan Science Society, the Advanced Technology Institute Research Grants 2022, and a TEPCO Memorial Foundation Research Grant (Basic Research) is gratefully acknowledged.References
- I. Chakraborty and T. Pradeep, Chem. Rev., 2017, 117, 8208–8271 CrossRef CAS PubMed.
- N. A. Sakthivel and A. Dass, Acc. Chem. Res., 2018, 51, 1774–1783 CrossRef CAS PubMed.
- M. Agrachev, M. Ruzzi, A. Venzo and F. Maran, Acc. Chem. Res., 2019, 52, 44–52 CrossRef CAS PubMed.
- B. Nieto-Ortega and T. Bürgi, Acc. Chem. Res., 2018, 51, 2811–2819 CrossRef CAS PubMed.
- Z. Gan, N. Xia and Z. Wu, Acc. Chem. Res., 2018, 51, 2774–2783 CrossRef CAS PubMed.
- Q. Yao, T. Chen, X. Yuan and J. Xie, Acc. Chem. Res., 2018, 51, 1338–1348 CrossRef CAS PubMed.
- T. Tsukuda and H. Häkkinen, Protected Metal Clusters: From Fundamentals to Applications, Elsevier, Amsterdam, 2015 Search PubMed.
- J. Yan, B. K. Teo and N. Zheng, Acc. Chem. Res., 2018, 51, 3084–3093 CrossRef CAS PubMed.
- T. Kawawaki, A. Ebina, Y. Hosokawa, S. Ozaki, D. Suzuki, S. Hossain and Y. Negishi, Small, 2021, 17, 2005328 CrossRef CAS PubMed.
- T. Kawawaki, Y. Negishi and H. Kawasaki, Nanoscale Adv., 2020, 2, 17–36 RSC.
- T. Kawawaki, Y. Mori, K. Wakamatsu, S. Ozaki, M. Kawachi, S. Hossain and Y. Negishi, J. Mater. Chem. A, 2020, 8, 16081–16113 RSC.
- T. Kawawaki, Y. Kataoka, M. Hirata, Y. Akinaga, R. Takahata, K. Wakamatsu, Y. Fujiki, M. Kataoka, S. Kikkawa, A. S. Alotabi, S. Hossain, D. J. Osborn, T. Teranishi, G. G. Andersson, G. F. Metha, S. Yamazoe and Y. Negishi, Angew. Chem., Int. Ed., 2021, 60, 21340–21350 CrossRef CAS PubMed.
- T. Kawawaki, Y. Kataoka, M. Hirata, Y. Iwamatsu, S. Hossain and Y. Negishi, Nanoscale Horiz., 2021, 6, 409–448 RSC.
- X. Gao and W. Chen, Chem. Commun., 2017, 53, 9733–9736 RSC.
- J. Chen, L. Liu, X. Liu, L. Liao, S. Zhuang, S. Zhou, J. Yang and Z. Wu, Chem. – Eur. J., 2017, 23, 18187–18192 CrossRef CAS PubMed.
- T. Imaoka, Y. Akanuma, N. Haruta, S. Tsuchiya, K. Ishihara, T. Okayasu, W.-J. Chun, M. Takahashi and K. Yamamoto, Nat. Commun., 2017, 8, 688 CrossRef PubMed.
- J. Chen, Y. Pan, Z. Wang and P. Zhao, Dalton Trans., 2017, 46, 12964–12970 RSC.
- J. Chen, L. Liu, L. Weng, Y. Lin, L. Liao, C. Wang, J. Yang and Z. Wu, Sci. Rep., 2015, 5, 16628 CrossRef CAS PubMed.
- C. Zhang, T. Matsumoto, M. Samoc, S. Petrie, S. Meng, T. C. Corkery, R. Stranger, J. Zhang, M. G. Humphrey and K. Tatsumi, Angew. Chem., Int. Ed., 2010, 49, 4209–4212 CrossRef CAS PubMed.
- P. Woodward, L. F. Dahl, E. W. Abel and B. C. Crosse, J. Am. Chem. Soc., 1965, 87, 5251–5253 CrossRef CAS.
- E. W. Abel and B. C. Crosse, J. Chem. Soc. A, 1966, 1377–1378 RSC.
- R. O. Gould and M. M. Harding, J. Chem. Soc. A, 1970, 875–881 RSC.
- H. Barrera, J. C. Bayón, J. Suades, C. Germain and J. P. Declerq, Polyhedron, 1984, 3, 969–975 CrossRef CAS.
- I. G. Dance, M. L. Scudder and R. Secomb, Inorg. Chem., 1985, 24, 1201–1208 CrossRef CAS.
- M. Kriege and G. Henkel, Z. Naturforsch., B: Chem. Sci., 1987, 42, 1121–1128 CrossRef CAS.
- B.-K. Koo, E. Block, H. Kang, S. Liu and J. Zubieta, Polyhedron, 1988, 7, 1397–1399 CrossRef CAS.
- T. Krüger, B. Krebs and G. Henkel, Angew. Chem., Int. Ed. Engl., 1989, 28, 61–62 CrossRef.
- T. Krüger, B. Krebs and G. Henkel, Angew. Chem., Int. Ed. Engl., 1992, 31, 54–56 CrossRef.
- A. H. Mahmoudkhani and V. Langer, Inorg. Chim. Acta, 1999, 294, 83–86 CrossRef CAS.
- A. H. Mahmoudkhani and V. Langer, Polyhedron, 1999, 18, 3407–3410 CrossRef CAS.
- S. A. Ivanov, M. A. Kozee, W. A. Merrill, S. Agarwal and L. F. Dahl, J. Chem. Soc., Dalton Trans., 2002, 4105–4115 RSC.
- C. Zhang, S. Takada, M. Kölzer, T. Matsumoto and K. Tatsumi, Angew. Chem., Int. Ed., 2006, 45, 3768–3772 CrossRef CAS PubMed.
- R. Angamuthu, H. Kooijman, M. Lutz, A. L. Spek and E. Bouwman, Dalton Trans., 2007, 4641–4643 RSC.
- C. Tan, M. Jin, X. Ma, Q. Zhu, Y. Huang, Y. Wang, S. Hu, T. Sheng and X. Wu, Dalton Trans., 2012, 41, 8472–8476 RSC.
- M. Zhu, S. Zhou, C. Yao, L. Liao and Z. Wu, Nanoscale, 2014, 6, 14195–14199 RSC.
- X. Chai, T. Li, M. Chen, R. Jin, W. Ding and Y. Zhu, Nanoscale, 2018, 10, 19375–19382 RSC.
- Z. Zhuang and W. Chen, Analyst, 2020, 145, 2621–2630 RSC.
- H. N. Kagalwala, E. Gottlieb, G. Li, T. Li, R. Jin and S. Bernhard, Inorg. Chem., 2013, 52, 9094–9101 CrossRef CAS PubMed.
- R. Angamuthu and E. Bouwman, Phys. Chem. Chem. Phys., 2009, 11, 5578–5583 RSC.
- W. Hu, Y. Sun, S. Li, X. Cheng, X. Cai, M. Chen and Y. Zhu, CCS Chem., 2021, 3, 2509–2519 CrossRef CAS.
- D. R. Kauffman, D. Alfonso, D. N. Tafen, J. Lekse, C. Wang, X. Deng, J. Lee, H. Jang, J.-s. Lee, S. Kumar and C. Matranga, ACS Catal., 2016, 6, 1225–1234 CrossRef CAS.
- K. S. Joya, L. Sinatra, L. G. AbdulHalim, C. P. Joshi, M. N. Hedhili, O. M. Bakr and I. Hussain, Nanoscale, 2016, 8, 9695–9703 RSC.
- S. Srinivasan, Z. Liu, S. House and R. Jin, Inorg. Chem., 2023, 62, 1875–1884 CrossRef CAS PubMed.
- K. Kwak and D. Lee, Acc. Chem. Res., 2019, 52, 12–22 CrossRef CAS PubMed.
- M. H. Naveen, R. Khan and J. H. Bang, Chem. Mater., 2021, 33, 7595–7612 CrossRef CAS.
- Y. Du, H. Sheng, D. Astruc and M. Zhu, Chem. Rev., 2020, 120, 526–622 CrossRef CAS PubMed.
- T. Kawawaki and Y. Negishi, Nanomaterials, 2020, 10, 238 CrossRef CAS PubMed.
- B. Kumar, T. Kawawaki, N. Shimizu, Y. Imai, D. Suzuki, S. Hossain, L. V. Nair and Y. Negishi, Nanoscale, 2020, 12, 9969–9979 RSC.
- Y. Pan, J. Chen, S. Gong and Z. Wang, Dalton Trans., 2018, 47, 11097–11103 RSC.
- D. Y. Chung, J. W. Han, D.-H. Lim, J.-H. Jo, S. J. Yoo, H. Lee and Y.-E. Sung, Nanoscale, 2015, 7, 5157–5163 RSC.
- Q. Li, D. Wang, C. Han, X. Ma, Q. Lu, Z. Xing and X. Yang, J. Mater. Chem. A, 2018, 6, 8233–8237 RSC.
- Y. Hattori, T. Konishi and K. Kaneko, Chem. Phys. Lett., 2002, 355, 37–42 CrossRef CAS.
- Q. Ma, C. Hu, K. Liu, S.-F. Hung, D. Ou, H. M. Chen, G. Fu and N. Zheng, Nano Energy, 2017, 41, 148–153 CrossRef CAS.
- M. A. Peck and M. A. Langell, Chem. Mater., 2012, 24, 4483–4490 CrossRef CAS.
- G. Zhao, P. Li, N. Cheng, S. X. Dou and W. Sun, Adv. Mater., 2020, 32, 2000872 CrossRef CAS PubMed.
- P. Alemany and R. Hoffmann, J. Am. Chem. Soc., 1993, 115, 8290–8297 CrossRef CAS.
- S. Hossain, Y. Imai, Y. Motohashi, Z. Chen, D. Suzuki, T. Suzuki, Y. Kataoka, M. Hirata, T. Ono, W. Kurashige, T. Kawawaki, T. Yamamoto and Y. Negishi, Mater. Horiz., 2020, 7, 796–803 RSC.
- Y. Dou, L. Zhang, J. Xu, C.-T. He, X. Xu, Z. Sun, T. Liao, B. Nagy, P. Liu and S. X. Dou, ACS Nano, 2018, 12, 1878–1886 CrossRef CAS PubMed.
- M. Wang, Q. Wa, X. Bai, Z. He, W. S. Samarakoon, Q. Ma, Y. Du, Y. Chen, H. Zhou, Y. Liu, X. Wang and Z. Feng, JACS Au, 2021, 1, 2216 CrossRef CAS PubMed.
- P. T. Babar, A. C. Lokhande, M. G. Gang, B. S. Pawar, S. M. Pawar and J. H. Kim, J. Ind. Eng. Chem., 2018, 60, 493–497 CrossRef CAS.
- C. Wei, R. R. Rao, J. Peng, B. Huang, I. E. L. Stephens, M. Risch, Z. J. Xu and Y. Shao-Horn, Adv. Mater., 2019, 31, 1806296 CrossRef PubMed.
Footnote |
| † Electronic supplementary information (ESI) available: Experimental; characterization; crystal data; peak assignments of FT-IR spectroscopy; additional UV-vis, XPS, FT-IR, XANES, and EXAFS spectra; TEM images; and electrocatalytic activity. CCDC 2212626. For ESI and crystallographic data in CIF or other electronic format see DOI: https://doi.org/10.1039/d2nr06952k |
| This journal is © The Royal Society of Chemistry 2023 |