Point-of-care (POC) SARS-CoV-2 antigen detection using functionalized aerosol jet-printed organic electrochemical transistors (OECTs)

Jiaxin Fan a, Sheldon Parr a, Seongdae Kang b and Manisha Gupta *a
aDepartment of Electrical and Computer Engineering, University of Alberta, Edmonton, Alberta T6G 1H9, Canada. E-mail: mgupta1@ualberta.ca
bDepartment of Chemical and Materials, University of Alberta, Edmonton, Alberta T6G 1H9, Canada

Received 20th November 2022 , Accepted 8th February 2023

First published on 10th February 2023


Abstract

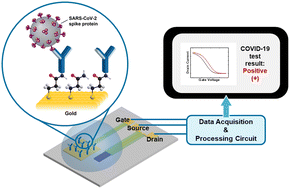
The continuous spread of coronavirus disease 2019 (COVID-19) has highlighted the need for simple and reliable diagnostic technologies for point-of-care (POC) virus detection applications. Here, we report a COVID-19 diagnostic platform based on aerosol jet-printed antibody-functionalized organic electrochemical transistors (OECTs) for rapidly identifying severe acute respiratory syndrome coronavirus-2 (SARS-CoV-2) antigens. Selective sensing of SARS-CoV-2 spike S1 protein is achieved in phosphate-buffered saline (PBS) with a detectable range of 1 fg mL−1 to 1 μg mL−1. We used the sensors to detect the antigens in unprocessed patient nasopharyngeal swab samples in universal transport medium (UTM) and achieved an overall accuracy of 70%. In addition, these patient sample tests clearly demonstrate that our OECT threshold voltage shift is correlated with the sample SARS-CoV-2 viral load. Hence, we have demonstrated an accurate POC biosensor for detecting SARS-CoV-2 antigens, which holds great promise towards developing on-site and at-home rapid SARS-CoV-2 infection screening and COVID-19 prognosis.

Introduction

The emergence of viral infectious diseases with epidemic and pandemic potential, such as severe acute respiratory syndrome (SARS), Ebola, Zika, Middle East respiratory syndrome (MERS), and the ongoing COVID-19, is continually challenging the world's strategies for combating pandemics. Efforts have been made to reduce COVID-19 transmission through public health interventions, including physical distancing, face mask ordinances, isolation cases, and vaccinations.1,2 Exploring rapid, accurate, and sensitive diagnostic methods is crucial for monitoring the spread of COVID-19.

Currently, the real-time reverse transcription polymerase chain reaction (RT-PCR) test of nasopharyngeal swab samples is the gold standard for COVID-19 diagnosis.3–6 RT-PCR-based tests are highly sensitive but cannot keep up with the accelerated mutation and spread pace of COVID-19, as this approach requires skilled personnel, centralized laboratory facilities, and long testing times of ∼3 hours with sample preparation. Hence, developing sensitive and accurate point-of-care (POC) diagnostic tools that directly target viral antigens with no sample preparation is necessary for rapid mass population screening.

There has been increasing research interest in rapid COVID-19 diagnostic tools, such as graphene7–9 and carbon nanotube10,11 field-effect transistor (FET) biosensors, organic field-effect transistor (OFET) biosensing devices,12 cell-based biosensors,13 silicon thin-film transistor aptasensors,14 fluorescence immunochromatographic assays,15 and electrochemical biosensors using various nanomaterial-based electrodes.16–20 Among these approaches, nanomaterial FET-based biosensors modified with antibodies demonstrate high sensitivity for both samples in buffer solutions and clinical samples. However, mass production of these devices remains challenging due to fabrication limitations.

Organic electrochemical transistors (OECTs) have been recognized as promising biosensing transducers due to their unique properties that allow efficient signal transduction with intrinsic amplification. OECTs are three-terminal devices with an ion-permeable conducting polymer channel between the source and the drain and an electrolyte connecting the channel and the gate. The drain current is modulated by the gate voltage, which controls the electrochemical doping/dedoping of the electroactive channel. OECTs show great stability in aqueous media with low operation voltages, and they have been demonstrated to sense various analytes such as ions,21–23 molecules,24–26 and biomolecules.27–32 Studies have shown that antibody–antigen binding events could be detected by functionalized OECTs.28,32–35 To use OECTs for COVID-19 diagnosis, either the gate or the channel needs to be modified with antibodies targeting SARS-CoV-2. Guo et al. have reported a nanobody-functionalized OECT for rapid single-molecule detection of SARS-CoV-2 and MERS antigens.36 Liu et al. have developed an ultrafast and sensitive POC COVID-19 IgG detection platform based on flexible OECTs.37 These studies have demonstrated the feasibility of using OECTs for COVID-19-related detection. In addition, OECTs can be manufactured by conventional microfabrication and low-temperature processing techniques, such as inkjet printing,34,38,39 screen printing,40,41 3D printing,21,42,43 and aerosol jet printing.25,44,45 Printing techniques offer the benefits of easy design iterations, reduced manufacturing costs, and mass production using continuous large-scale roll-to-roll processing. Therefore, the OECT is an excellent candidate for low-cost disposable biosensors and POC diagnostic tools.

Here, we present an aerosol jet-printed OECT-based biosensor for detecting SARS-CoV-2 antigens, controlled by a customized data collection unit. The OECTs are printed on Kapton substrates using gold nanoparticle (Au NP) ink for contacts, poly(3,4-ethylenedioxythiophene)–polystyrene sulfonate (PEDOT:PSS) as the channel, and polydimethylsiloxane (PDMS) as the insulator. Anti-SARS-CoV-2 spike S1 antibodies are immobilized onto the Au gate electrode through covalent bonding, and the SARS-CoV-2 antigens bind to the functionalized gate due to the antibody–antigen interaction, inducing shifts in the device threshold voltage. The antibody-functionalized OECT sensors show selectivity for SARS-CoV-2 spike S1 protein with a detection range of 1 fg mL−1 to 1 μg mL−1. Our device can also detect SARS-CoV-2 virus-like particles (VLPs) of 106 times dilution, corresponding to 103 copies per mL. We validated the OECT-based POC COVID-19 diagnostic platform with unprocessed real COVID-19 patients’ nasopharyngeal samples suspended in universal transport medium (UTM). We demonstrated a fast detection of <10 min, with 70% accuracy, and a correlation between the device response and sample viral load. This simple and cost-effective platform opens new opportunities for developing rapid SARS-CoV-2 detection strategies and a wide range of diagnoses.

Experimental methods

Materials

10× Phosphate-buffered saline (PBS) stock solution, bovine serum albumin (BSA), dimethyl sulfoxide (DMSO), Tris base, Dulbecco's Modified Eagle's Medium (DMEM), an Invitrogen™ Zip Alexa Fluor™ 647 rapid antibody labelling kit, and Molecular Probes™ Alexa Fluor™ 488 hydrazide were purchased from Fisher Scientific. 10× PBS was diluted with ultrapure water to obtain 1× PBS solution (pH = 7.4). 1 M Tris-HCl solution was prepared by dissolving the Tris base in ultrapure water with pH adjusted to 7.5 using HCl. 3,3′-Dithiodipropionic acid di(N-hydroxy succinimide ester) (DSP) was purchased from Sigma-Aldrich. Recombinant SARS-CoV-2 spike S1 antibody (1 mg mL−1) and SARS-CoV-2 spike subunit 1 (S1) protein (His tag) were purchased from antibodies-online Inc. The SARS-CoV-2 spike S1 antibody was diluted to 250 μg mL−1 with 1× PBS. The SARS-CoV-2 spike S1 protein was first dissolved in ultrapure water and diluted to different concentrations (1 fg mL−1 to 1 μg mL−1) in 1× PBS containing 0.1% BSA as suggested by the manufacturer's datasheet. Human coronavirus HKU1 (HCoV-HKU1) spike S1 protein (S1 subunit, His tag) and Middle East respiratory syndrome coronavirus (MERS-CoV) spike S1 protein (S1 subunit, aa 1-725, His tag) were purchased from SinoBiological and diluted to different concentrations in 1× PBS containing 0.1% BSA. SARS-CoV-2 VLPs in DMEM were purchased from Virongy. The concentrated VLP solution contained approximately 109 copies of VLPs per microliter and was diluted with 1× PBS.

OECT fabrication

OECTs were fabricated using an Optomec Aerosol Jet 5X printer equipped with an ultrasonic atomizer (UA) and a pneumatic atomizer (PA). Au NP ink (UT Dots, Inc.) was deposited onto 127 μm thick Kapton HN films to form the source, drain, and gate electrodes. The Au ink was printed using a 150 μm nozzle and the UA with a sheath flow rate (S_MFC) of 30 standard cubic centimeters per minute (sccm), net ink carrier flow rate (C_MFC) of 27 sccm, and printing speed of 8 mm s−1. While printing, the UA bath and the platen were maintained at 25 °C and 80 °C, respectively. After printing, the samples were annealed at 280 °C for 1 hour. The printed Au films have an average thickness and resistivity of 584 nm and 8.32 × 10⁻⁶ Ω cm, respectively. The channel was printed using PEDOT:PSS (94% Heraeus Clevios™ PH-1000, 5% ethylene glycol, 0.1% dodecylbenzenesulfonic acid solution, and 1 wt% (3-glycidyloxypropyl) trimethoxysilane). The PEDOT:PSS mixture was printed using the UA through a 150 μm nozzle with S_MFC = 35 sccm and C_MFC = 25 sccm at a speed of 5 mm s−1. The bubbler was filled with DI water to add moisture to the carrier flow. The UA bath was kept at 30 °C and the platen was kept at room temperature (∼21 °C) during printing. Two-layer printing was adopted for the PEDOT:PSS to ensure film continuity, and the samples were annealed at 130 °C for 20 minutes post-printing. A 1.05 μm thick layer of UV-curable PDMS (Shin-Etsu Chemical Co., Ltd) was printed to passivate the metal traces. The PDMS layer was deposited using a 300 μm nozzle and the PA (S_MFC = 60 sccm, C_MFC = 30 sccm) at 3 mm s−1 while constantly stirring the ink at 30 °C. The PDMS ink was cured with UV on-the-fly while printing and then annealed at 130 °C for 30 minutes. The contact traces for the OECT to the circuit connector were printed using Au NP ink, and the Kapton substrate was attached to a glass slide for easy handling. PDMS reservoirs were made using a 3D-printed plastic mold and a SYLGARD™ 184 silicone elastomer kit (10[thin space (1/6-em)]:[thin space (1/6-em)]1 mix), cured overnight at 80 °C, and attached to OECTs using a thin layer of PDMS and by baking at 80 °C for 2 hours.

Gate functionalization

OECTs were cleaned with acetone, 2-propanol, ethanol, and deionized (DI) water and dried. 10 mM DSP in DMSO was prepared and added onto the gate and left for 30 minutes at room temperature and washed off with DMSO and DI water and dried. SARS-CoV-2 spike S1 antibody solution was immediately added to the DSP-modified gate region and left for 2 hours under ambient conditions. The devices were rinsed thoroughly with 1× PBS and DI water to remove non-specific adsorption and reaction by-products. 1 M Tris-HCl buffer was used to quench the unreacted DSP. The functionalized devices were washed with DI water and 1× PBS and stored in 1× PBS at 4 °C. Attenuated total reflection Fourier transform infrared (ATR-FTIR) spectroscopy, fluorescence imaging and cyclic voltammetry (CV) were used to characterize the functionalized printed Au surface to confirm the antibody attachment.

Electrical characterization

OECT electrical characteristics were measured using a Keithley 2612B sourcemeter controlled via LabVIEW. The output and transfer characteristics were obtained using 1× PBS as the electrolyte. Antigen detection was performed by measuring the transfer curve of the functionalized OECT at a fixed drain bias voltage (VD) of −0.4 V and sweeping gate voltage (VG) from −0.4 to 1.1 V with a step size of 0.05 V before and after incubating in antigen solutions. Threshold voltages were extracted by the linear extrapolation method and calculated from the transfer curve by finding the maximum slope of the curve and adding VD/2 to the extrapolated x-intercept (ID = 0).46 The threshold voltage shift (ΔVT) was calculated based on eqn (1):
 
ΔVT = ΔVT,before − ΔVT,after(1)
where ΔVT,before is the threshold voltage extracted for a functionalized device measured with the background electrolyte (1× PBS or UTM). ΔVT,after is the threshold voltage calculated for the same device after incubation in the analyte solution.

Patient sample testing

COVID-19 patient sample testing was conducted in Alberta Provincial Laboratory for Public Health (ProvLab)47 at the University of Alberta in Edmonton using our OECT-based biosensors and a customized circuit as a payment service. Patient samples used by ProvLab were nasopharyngeal swabs suspended in UTM and verified by RT-PCR with a cycle threshold (Ct) cutoff of 38.00 cycles for COVID-19 positive results.

Results and discussion

OECTs were fabricated on polyimide substrates using an Optomec aerosol jet 5X system with Au (for biofunctionalization) contacts, a PEDOT:PSS channel, and a PDMS insulator (Fig. S1). The printed OECTs show good stability as shown in the output characteristics in Fig. S2. Based on the structure of the coronavirus, the spike protein locates on the surface of the SARS-CoV-2 and facilitates viral entry into host cell receptors. Therefore, this has been the main target for infection detection and therapy.3 Here, we selected the anti-SARS-CoV-2 spike antibody as the biorecognition element for biosensor design. Hence, gate electrode functionalization of the OECT with SARS-CoV-2 antibodies can detect SARS-CoV-2 antigens (Fig. 1(a)). The Au gate functionalization is shown in Fig. 1(b). This process utilizes N-hydroxysuccinimide (NHS) esters reacting with primary amine groups on the antibodies to form stable amide bonds.48 The effectiveness of Au surface functionalization was verified by printed Au thin films using ATR-FTIR spectroscopy, fluorescence imaging, and cyclic voltammetry. ATR-FTIR spectra (Fig. S3) show two distinctive peaks at ∼1658 cm−1 and ∼1548 cm−1 corresponding to the amide I and II bonds, respectively,33,37,49,50 which are only observed in the samples with antibodies attached. Fluorescence imaging also verified the coverage of the DSP linkers and covalent coupling of antibodies to the Au surface shown in Fig. S4. Cyclic voltammetry shows additional evidence of the surface change after antibody functionalization and antigen binding (Fig. S5). These results confirm the antibody immobilization on the printed Au surface through DSP.
image file: d2nr06485e-f1.tif
Fig. 1 Schematic of (a) the OECT-based SARS-CoV-2 biosensor and (b) Au surface antibody functionalization.

The transfer curves are collected before and after antibody functionalization and show a clear shift towards lower VG. The antibody immobilization changes the gate surface potential, leading to the OECT transfer characteristic shift.27,33,37 The transfer characteristics of the gate-functionalized OECTs were acquired after incubating in solutions with varying SARS-CoV-2 spike S1 protein concentrations for 3 minutes. Geometric optimization of the functionalized OECT was performed by varying both the gate sizes (1, 4, and 9 mm2) and channel width-to-length ratios (2, 5, and 10). Both channel and gate dimensions were found to affect the sensing performance, as observed in Fig. S6 and S7, and the extracted VT shifts and sensitivities are listed in Table S1. The devices with a gate size of 1 mm2 with different W/L could not detect the target antigen due to the less functionalized antibodies on a smaller gate area. Also, on devices with a 4 mm2 gate area, we were able to detect S1 protein with W/L = 10. The potential change induced by the antigen binding can only be detected with a device with higher transconductance. On increasing the gate area to 9 mm2, VT shifted consistently with increasing S1 protein concentrations for all the different W/L values, and the extracted detection sensitivity correlates with the device transconductance. Thus, for SARS-CoV-2 detection, an OECT with a larger gate area and a higher W/L is desired to obtain higher sensitivity. OECTs with a gate area of 9 mm2 and a W/L of 10 were used to achieve sufficient antibody immobilization and the desired device performance.

Fig. 2(b) shows the typical transfer characteristics of an optimized gate-functionalized OECT after incubation in varying concentrations of SARS-CoV-2 S1 protein solutions. As more spike proteins bind to the gate, the transfer curve shifts to higher VG due to the increase in the device VT. This shift is likely attributed to the change in the net electrostatic charge upon the formation of antigen–antibody complexes on the gate surface, which induces a gate surface potential change and alters the transistor behavior. In the study by Liu et al., the OECT transfer curve shifts to lower voltages as the SARS-CoV-2 antibody concentration increases,37 which agrees with our observation. Our biosensors show excellent selectivity for SARS-CoV-2, and the transfer curves for HCoV-HKU1 and MERS-CoV spike S1 proteins demonstrate negligible changes (Fig. 2(c) and (d)). The biosensor responses are qualified by extracting the threshold voltage shift (ΔVT) for the three analytes and are shown in Fig. 2(e). A logarithmic correlation between ΔVT and SARS-CoV-2 spike S1 protein concentration is observed with an average slope of −11.5 ± 2.4 mV per decade (mV per dec) extracted from five biosensors (n = 5). However, for HCoV-HKU1 and MERS-CoV spike S1 proteins, the average slopes are only −1.2 ± 0.4 mV dec−1 (two biosensors n = 2) and −1.7 ± 1.0 mV dec−1 (two biosensors n = 2), respectively. Thus, the gate-functionalized OECTs are sensitive and selective to SARS-CoV-2 spike protein. Limit of detection (LOD) is usually extracted based on the three-sigma (3σ) method, which can be obtained from the standard deviation of ΔVT measured with the background electrolyte. Considering the standard deviation we observed for SARS-CoV-2 spike protein measurements (Fig. 2(e)), the lowest concentration our biosensor could detect was 1 fg mL−1.


image file: d2nr06485e-f2.tif
Fig. 2 Transfer characteristics of an OECT measured (a) before and after gate functionalization. Transfer characteristics measured after incubating in (b) SARS-CoV-2, (c) HCoV-HKU1, and (d) MERS-CoV spike S1 protein solutions. (e) Semi-logarithmic plot of average threshold voltage shift (ΔVT) versus analyte concentration. Error bars represent standard deviation.

The biosensors were then verified with SARS-CoV-2 VLP antigens. VLPs were suspended in DMEM, which contains various reagents that may cause competing reactions. Therefore, we first measured transfer curves for an unfunctionalized OECT with varying DMEM dilutions in PBS (106× dilution to undiluted (1×)) (Fig. 3(a)). Nearly no shift is observed with 1× PBS and DMEM diluted 106× to 103×, but a larger shift to lower VG is observed for DMEM diluted 100× to 1×. We tested a gate-functionalized OECT with a DMEM dilution range of 106× to 103×, and the transfer characteristics remained nearly identical (Fig. 3(b)). Thus, a dilution range of 106× to 103× was used for VLP testing. The transfer curve shifts to higher VG as the VLP concentration increases, shown in Fig. 3(c), which is consistent with the shift observed for SARS-CoV-2 spike protein. ΔVT exhibits a logarithmic dependence on the VLP dilution with an average slope of −45.7 ± 13.0 mV dec−1 for five biosensors (n = 5) (Fig. 3(d)). SARS-CoV-2 VLP binding generates larger ΔVT than the spike S1 protein due to its higher binding affinity and larger size.


image file: d2nr06485e-f3.tif
Fig. 3 Transfer curves of (a) an unfunctionalized OECT measured with varying dilutions (106× to 1×) of blank DMEM in PBS, (b) a gate-functionalized OECT measured in 106× to 103× dilution of blank DMEM, and (c) a gate-functionalized OECT measured after exposure to VLPs (106× to 103× dilution). (d) Semi-log plot of average ΔVTversus VLP dilution with a slope of −45.7 ± 13.0 mV dec−1 (n = 5). Error bars represent the standard deviation.

Having confirmed the specificity and sensitivity of our gate-functionalized OECTs to the target antigens, we turned our attention to nasopharyngeal samples. We developed a signal processing and data acquisition circuit for the OECT-based biosensors at point-of-care. Fig. 4(a) shows a photograph of our POC COVID-19 diagnostic platform. A PDMS reservoir was attached to the OECT-based biosensor to contain the testing solution (Fig. 4(b)). Fig. 4(c) is the schematic of our POC biosensing platform with its main circuit components. The detailed description and circuit schematic (Fig. S8) are provided in the ESI. The circuit was validated against the Keithley sourcemeter (Fig. S9) and found to perform well (Fig. S10).


image file: d2nr06485e-f4.tif
Fig. 4 Photograph of (a) our POC COVID-19 diagnostic tool and (b) OECT-based SARS-CoV-2 biosensor. (c) Schematic of our POC COVID-19 diagnostic platform showing the main circuit components. (d) Schematic of the sample measurement using our COVID-19 diagnostic platform.

Since the clinical nasopharyngeal samples are collected and stored in UTM, we first measured OECTs in blank UTM to check for interferences. Fig. S11 shows the average normalized ID in blank UTM with different waiting intervals (<1, 3, and 5 minutes) between three consecutive measurements. The ID deviation reduced significantly for 3- and 5-minute waiting times, indicating that undiluted UTM can be directly used. Thus, the circuit was programmed with prompts to run blank UTM for the baseline and incubate with the sample for 5 minutes, for a total test duration of less than 10 minutes. Ten disposable biosensors and the circuit were delivered to ProvLab for patient sample testing, and the procedure is illustrated in Fig. 4(d). Without prior knowledge of our POC diagnostic tool, the medical technologist conducted the testing independently by following the standard operation procedure created by us.

Five positive and five negative undiluted patient samples in UTM were tested, and the results are listed in Table S2.Fig. 5(a) shows the patient sample results acquired by our biosensors using ΔVT,cutoff = −10 mV. The ΔVT,cutoff was chosen using the 3σ method (σ = 3.65 mV) by extracting VT of each device before functionalization in PBS (Table S3). C1 and E3 were defective as observed from their transfer curves in Fig. S12(i) and (j) and were excluded from the analysis. For C1, the functionalization failed, as there was no shift in the transfer curves before and after functionalization. For device E3, the ID magnitude had decreased more than 3-fold after functionalization, which may have been caused by accidental damage during handling. Seven out of ten patient samples were accurately detected using the selected ΔVT,cutoff. Also, functionalization of the devices D2 and D3 did not work very well as only a small shift in the transfer curve was observed from Fig. S12(e)–(j), and D3 showed a false positive result. Thus, we obtained an overall testing accuracy of 70% and an accuracy of 87.5%, excluding the two defective biosensors. In PCR tests, Ct correlates with the sample viral load, and a lower Ct indicates higher viral load. From the ΔVTversus Ct plot for the five COVID-19 positive samples (Fig. 5(b)), we observe an increasing ΔVT trend for higher viral load. Thus, our biosensors can detect SARS-CoV-2 infection along with the viral load. As previously reported, the SARS-CoV-2 viral load is associated with the infectivity and severity of the illness and is useful for evaluating the disease progression.51–54 Antiviral drugs, such as molnupiravir, paxlovid, and remdesivir, have been used to reduce the risk of severe complications of COVID-19.55 Our SARS-CoV-2 biosensors may be used to aid in identifying the infection stages and suitable treatments for patients. In the recent studies concerning long-COVID consequences, it was suggested that POC and lab-on-a-chip biosensor systems that are portable and easy to use have the advantages of reducing diagnostic costs, improving remote healthcare accessibility, and promoting personalized and intelligent COVID-19 management.56,57 The POC biosensor system we developed has promising potential for boosting the development of precision medicine for disease management. However, more extensive clinical testing is required to confirm the biosensor performance and the association with sample viral load.


image file: d2nr06485e-f5.tif
Fig. 5 (a) ΔVT of patient samples collected using our biosensors and circuit. A COVID-19 positive cut-off threshold voltage change, ΔVT,cutoff, of −10 mV was used. (b) Biosensor ΔVTversus PCR Ct for the 5 COVID-19 positive samples; ΔVT increases with the sample viral load.

This technology is eco-friendly as the circuit is reusable, and less waste is generated per test. Additionally, the readout unit can be used with other OECT sensors to measure different analytes such as respiratory viruses and other coronaviruses. There is also a possibility to expand a single OECT biosensor to an array of devices to achieve multiplexed analyte detection.

Conclusions

In summary, we have developed a rapid POC COVID-19 diagnostic platform using aerosol jet-printed OECTs with a SARS-CoV-2 antibody-functionalized gate. These biosensors show very clear selectivity towards SARS-CoV-2 spike S1 protein with a detectable range of 1 fg mL−1 to 1 μg mL−1 in PBS. In addition, tests with SARS-CoV-2 VLPs show a much larger sensitivity of −45.7 ± 13.0 mV dec−1 compared to the spike S1 protein due to their binding affinity and size. This clearly indicates that our biosensors have sufficient sensitivity for detecting spike protein binding. Since we have used a virus neutralizing antibody to functionalize the devices, which has been tested against multiple SARS-CoV-2 variants, including lineages B.1.1.7 (alpha), B.1.351 (beta), P.1 (gamma), B.1.429 (epsilon), and B.1.525 (eta), our biosensors should be effective for detecting other variants.58 However, further testing is required to confirm the effectiveness of our biosensor in responding to different variants. Our POC COVID-19 diagnostic platform was used to test 10 unprocessed undiluted patient nasopharyngeal samples in UTM, demonstrating an overall accuracy of 70% and correlation with the sample viral load. Each sample testing takes <10 minutes. Rapid biosensing devices with high sensitivity and accuracy are important for controlling the spread of SARS-CoV-2 and are in high demand during the pandemic. The rapid POC diagnostic system we developed is portable, reliable, accurate and user-friendly. As we have used aerosol jet printing, this technology can be easily scaled for commercialization for a real-world on-site or at-home detection system. Such a system is a transferrable technology platform for developing sensors for detecting other biomolecules in the future. We believe that this technology can boost the development and distribution progress of affordable POC diagnostic tools.

Author contributions

M. G. conceptualized the research idea and acquired the research fundings. J. F. carried out most experiments and data analysis and wrote the original manuscript. S. P. designed and developed the software and hardware of the data collection unit. S. K. assisted in device functionalization. All authors contributed to manuscript editing and revision.

Conflicts of interest

There are no conflicts to declare.

Acknowledgements

The authors would like to acknowledge NSERC Alliance Grant (ALLRP 555165-20) and Alberta Innovates CASBE grant for the financial support. The authors also thank NSERC for the PGDS and USRA funding for JF (PGSD-534859-2019) and SP (506072), respectively. The authors would also like to acknowledge Clinisys EMR Inc. and Biostream Diagnostics Inc. for their in-kind support.

References

  1. D. M. Hartley and E. N. Perencevich, J. Am. Med. Assoc., 2020, 323, 1908–1909 CrossRef CAS PubMed.
  2. P. Nouvellet, S. Bhatia, A. Cori, K. E. C. Ainslie, M. Baguelin, S. Bhatt, A. Boonyasiri, N. F. Brazeau, L. Cattarino, L. V. Cooper, H. Coupland, Z. M. Cucunuba, G. Cuomo-Dannenburg, A. Dighe, B. A. Djaafara, I. Dorigatti, O. D. Eales, S. L. van Elsland, F. F. Nascimento, R. G. FitzJohn, K. A. M. Gaythorpe, L. Geidelberg, W. D. Green, A. Hamlet, K. Hauck, W. Hinsley, N. Imai, B. Jeffrey, E. Knock, D. J. Laydon, J. A. Lees, T. Mangal, T. A. Mellan, G. Nedjati-Gilani, K. V. Parag, M. Pons-Salort, M. Ragonnet-Cronin, S. Riley, H. J. T. Unwin, R. Verity, M. A. C. Vollmer, E. Volz, P. G. T. Walker, C. E. Walters, H. Wang, O. J. Watson, C. Whittaker, L. K. Whittles, X. Xi, N. M. Ferguson and C. A. Donnelly, Nat. Commun., 2021, 12, 1090 CrossRef CAS PubMed.
  3. T. Ji, Z. Liu, G. Wang, X. Guo, S. Akbar Khan, C. Lai, H. Chen, S. Huang, S. Xia, B. Chen, H. Jia, Y. Chen and Q. Zhou, Biosens. Bioelectron., 2020, 166, 112455 CrossRef CAS PubMed.
  4. W. Wang, Y. Xu, R. Gao, R. Lu, K. Han, G. Wu and W. Tan, J. Am. Med. Assoc., 2020, 323, 1843–1844 CAS.
  5. Y. W. Tang, J. E. Schmitz, D. H. Persing and C. W. Stratton, J. Clin. Microbiol., 2020, 58(6), e00512–e00520 CrossRef PubMed.
  6. N. Ravi, D. L. Cortade, E. Ng and S. X. Wang, Biosens. Bioelectron., 2020, 165, 112454 CrossRef CAS PubMed.
  7. G. Seo, G. Lee, M. J. Kim, S. H. Baek, M. Choi, K. B. Ku, C. S. Lee, S. Jun, D. Park, H. G. Kim, S. J. Kim, J. O. Lee, B. T. Kim, E. C. Park and S. I. Kim, ACS Nano, 2020, 14, 5135–5142 CrossRef CAS PubMed.
  8. J. Li, D. Wu, Y. Yu, T. Li, K. Li, M. M. Xiao, Y. Li, Z. Y. Zhang and G. J. Zhang, Biosens. Bioelectron., 2021, 183, 113206 CrossRef CAS PubMed.
  9. J. Gao, C. Wang, Y. Chu, Y. Han, Y. Gao, Y. Wang, C. Wang, H. Liu, L. Han and Y. Zhang, Talanta, 2022, 240, 123197 CrossRef CAS PubMed.
  10. W. Shao, M. R. Shurin, S. E. Wheeler, X. He and A. Star, ACS Appl. Mater. Interfaces, 2021, 13, 10321–10327 CrossRef CAS PubMed.
  11. M. A. Zamzami, G. Rabbani, A. Ahmad, A. A. Basalah, W. H. Al-Sabban, S. Nate Ahn and H. Choudhry, Bioelectrochemistry, 2022, 143, 107982 CrossRef CAS PubMed.
  12. K. Ditte, T. A. Nguyen Le, O. Ditzer, D. I. Sandoval Bojorquez, S. Chae, M. Bachmann, L. Baraban and F. Lissel, ACS Biomater. Sci. Eng., 2021 DOI:10.1021/acsbiomaterials.1c00727.
  13. S. Mavrikou, G. Moschopoulou, V. Tsekouras and S. Kintzios, Sensors, 2020, 20(11), 3121 CrossRef CAS PubMed.
  14. T. Farrow, S. Laumier, I. Sandall and H. V. Zalinge, Biosensors, 2022, 12, 347 CrossRef CAS PubMed.
  15. L. Porte, P. Legarraga, V. Vollrath, X. Aguilera, J. M. Munita, R. Araos, G. Pizarro, P. Vial, M. Iruretagoyena, S. Dittrich and T. Weitzel, Int. J. Infect. Dis., 2020, 99, 328–333 CrossRef CAS PubMed.
  16. S. Mahari, A. Roberts, D. Shahdeo and S. Gandhi, bioRxiv, 2020,  DOI:10.1101/2020.04.24.059204.
  17. B. Mojsoska, S. Larsen, D. A. Olsen, J. S. Madsen, I. Brandslund and F. A. Alatraktchi, Sensors, 2021, 21(2), 390 CrossRef CAS PubMed.
  18. R. M. Torrente-Rodriguez, H. Lukas, J. Tu, J. Min, Y. Yang, C. Xu, H. B. Rossiter and W. Gao, Matter, 2020, 3, 1981–1998 CrossRef PubMed.
  19. Z. Rahmati, M. Roushani, H. Hosseini and H. Choobin, Mikrochim. Acta, 2021, 188, 105 CrossRef CAS PubMed.
  20. S. Eissa and M. Zourob, Anal. Chem., 2021, 93, 1826–1833 CrossRef CAS PubMed.
  21. D. Majak, J. X. Fan and M. Gupta, Sens. Actuators, B, 2019, 286, 111–118 CrossRef CAS.
  22. N. Wang, Y. Liu, Y. Fu and F. Yan, ACS Appl. Mater. Interfaces, 2018, 10, 25834–25840 CrossRef CAS PubMed.
  23. P. Lin, F. Yan and H. L. Chan, ACS Appl. Mater. Interfaces, 2010, 2, 1637–1641 CrossRef CAS PubMed.
  24. H. Tang, F. Yan, P. Lin, J. Xu and H. L. W. Chan, Adv. Funct. Mater., 2011, 21, 2264–2272 CrossRef CAS.
  25. D. Majak, J. Fan, S. Kang and M. Gupta, J. Mater. Chem. B, 2021, 9, 2107–2117 RSC.
  26. L. J. Currano, F. C. Sage, M. Hagedon, L. Hamilton, J. Patrone and K. Gerasopoulos, Sci. Rep., 2018, 8, 15890 CrossRef PubMed.
  27. W. Y. Tao, P. Lin, J. Hu, S. M. Ke, J. J. Song and X. R. Zeng, RSC Adv., 2017, 7, 52118–52124 RSC.
  28. E. Macchia, P. Romele, K. Manoli, M. Ghittorelli, M. Magliulo, Z. M. Kovaacs-Vajna, F. Torricelli and L. Torsi, Flexible Printed Electron., 2018, 3, 034002 CrossRef.
  29. B. Kavosi, A. Salimi, R. Hallaj and F. Moradi, Biosens. Bioelectron., 2015, 74, 915–923 CrossRef CAS PubMed.
  30. L. Chen, Y. Fu, N. Wang, A. Yang, Y. Li, J. Wu, H. Ju and F. Yan, ACS Appl. Mater. Interfaces, 2018, 10, 18470–18477 CrossRef CAS PubMed.
  31. S. Wustoni, S. Wang, J. R. Alvarez, T. C. Hidalgo, S. P. Nunes and S. Inal, Biosens. Bioelectron., 2019, 143, 111561 CrossRef CAS PubMed.
  32. D. Gentili, P. D'Angelo, F. Militano, R. Mazzei, T. Poerio, M. Brucale, G. Tarabella, S. Bonetti, S. L. Marasso, M. Cocuzza, L. Giorno, S. Iannotta and M. Cavallini, J. Mater. Chem. B, 2018, 6, 5400–5406 RSC.
  33. J. Yu, A. Yang, N. Wang, H. Ling, J. Song, X. Chen, Y. Lian, Z. Zhang, F. Yan and M. Gu, Nanoscale, 2021, 13, 2868–2874 RSC.
  34. S. Demuru, A. Marette, W. Kooli, P. Junier and D. Briand, presented in part at the 2019 20th International Conference on Solid-State Sensors, Actuators and Microsystems & Eurosensors XXXIII (TRANSDUCERS & EUROSENSORS XXXIII), 2019.
  35. E. Macchia, M. Ghittorelli, F. Torricelli and L. Torsi, Organic electrochemical transistor immuno-sensor operating at the femto-molar limit of detection, presented in part at the 2017 7th IEEE International Workshop on Advances in Sensors and Interfaces (IWASI), Vieste, Italy, 2017, pp. 68–72.
  36. K. Guo, S. Wustoni, A. Koklu, E. Diaz-Galicia, M. Moser, A. Hama, A. A. Alqahtani, A. N. Ahmad, F. S. Alhamlan, M. Shuaib, A. Pain, I. McCulloch, S. T. Arold, R. Grunberg and S. Inal, Nat. Biomed. Eng., 2021, 5, 666–677 CrossRef CAS PubMed.
  37. H. Liu, A. N. Yang, J. J. Song, N. X. Wang, P. Y. Lam, Y. L. Li, H. K. W. Law and F. Yan, Sci. Adv., 2021, 7, eabg8387 CrossRef CAS PubMed.
  38. M. Afonso, J. Morgado and L. Alcácer, J. Appl. Phys., 2016, 120, 165502 CrossRef.
  39. L. Basiricò, P. Cosseddu, A. Scidà, B. Fraboni, G. G. Malliaras and A. Bonfiglio, Org. Electron., 2012, 13, 244–248 CrossRef.
  40. I. Gualandi, M. Marzocchi, A. Achilli, D. Cavedale, A. Bonfiglio and B. Fraboni, Sci. Rep., 2016, 6, 33637 CrossRef CAS PubMed.
  41. P. C. Hutter, A. Fian, K. Gatterer and B. Stadlober, ACS Appl. Mater. Interfaces, 2016, 8, 14071–14076 CrossRef PubMed.
  42. J. X. Fan, C. Montemagno and M. Gupta, Org. Electron., 2019, 73, 122–129 CrossRef CAS.
  43. V. Bertana, G. Scordo, M. Parmeggiani, L. Scaltrito, S. Ferrero, M. G. Gomez, M. Cocuzza, D. Vurro, P. D'Angelo, S. Iannotta, C. F. Pirri and S. L. Marasso, Sci. Rep., 2020, 10, 13335 CrossRef CAS PubMed.
  44. G. Tarabella, D. Vurro, S. Lai, P. D'Angelo, L. Ascari and S. Iannotta, Flexible Printed Electron., 2020, 5, 014005 CrossRef CAS.
  45. J. X. Fan, A. A. F. Pico and M. Gupta, Mater. Adv., 2021, 2, 7445–7455 RSC.
  46. S. E. Doris, A. Pierre and R. A. Street, Adv. Mater., 2018, 30, e1706757 CrossRef PubMed.
  47. AlbertaHealthServices, Public Health Laboratory (ProvLab), https://www.albertahealthservices.ca/lab/Page14605.aspx.
  48. G. T. Hermanson, Bioconjugate techniques, Academic press, 2013 Search PubMed.
  49. H. Stevenson, A. Bacon, K. M. Joseph, W. R. W. Gwandaru, A. Bhide, D. Sankhala, V. N. Dhamu and S. Prasad, Sci. Rep., 2019, 9, 12701 CrossRef PubMed.
  50. J. Kong and S. Yu, Acta Biochim. Biophys. Sin., 2007, 39, 549–559 CrossRef CAS PubMed.
  51. K. A. Walsh, K. Jordan, B. Clyne, D. Rohde, L. Drummond, P. Byrne, S. Ahern, P. G. Carty, K. K. O'Brien, E. O'Murchu, M. O'Neill, S. M. Smith, M. Ryan and P. Harrington, J. Infect., 2020, 81, 357–371 CrossRef CAS PubMed.
  52. F. Yu, L. Yan, N. Wang, S. Yang, L. Wang, Y. Tang, G. Gao, S. Wang, C. Ma, R. Xie, F. Wang, C. Tan, L. Zhu, Y. Guo and F. Zhang, Clin. Infect. Dis, 2020, 71, 793–798 CrossRef CAS PubMed.
  53. J. Fajnzylber, J. Regan, K. Coxen, H. Corry, C. Wong, A. Rosenthal, D. Worrall, F. Giguel, A. Piechocka-Trocha, C. Atyeo, S. Fischinger, A. Chan, K. T. Flaherty, K. Hall, M. Dougan, E. T. Ryan, E. Gillespie, R. Chishti, Y. J. Li, N. Jilg, D. Hanidziar, R. M. Baron, L. Baden, A. M. Tsibris, K. A. Armstrong, D. R. Kuritzkes, G. Alter, B. D. Walker, X. Yu, J. Z. Li and M. C. Pathogen, Nat. Commun., 2020, 11, 1–9 CrossRef PubMed.
  54. Y. Pan, D. Zhang, P. Yang, L. L. M. Poon and Q. Wang, Lancet Infect. Dis., 2020, 20, 411–412 CrossRef CAS PubMed.
  55. M. Cascella, M. Rajnik, A. Aleem, S. C. Dulebohn and R. Di Napoli, Features, evaluation, and treatment of coronavirus (COVID-19), Statpearls [internet], 2022, https://www.ncbi.nlm.nih.gov/books/NBK554776/ Search PubMed.
  56. J. Cherusseri, C. M. Savio, M. Khalid, V. Chaudhary, A. Numan, S. J. Varma, A. Menon and A. Kaushik, Biosensors, 2022, 12, 890 CrossRef CAS PubMed.
  57. A. Kaushik and E. Mostafavi, The Innovation, 2022, 3, 100303 CrossRef CAS PubMed.
  58. Antibodies-online.com, SARS-CoV-2 Spike S1 antibody RBD, https://www.antibodies-online.com/antibody/6952547/anti-SARS-CoV-2+Spike+S1+RBD+antibody/, 2022.

Footnote

Electronic supplementary information (ESI) available. See DOI: https://doi.org/10.1039/d2nr06485e

This journal is © The Royal Society of Chemistry 2023