OWL2: a molecular beacon-based nanostructure for highly selective detection of single-nucleotide variations in folded nucleic acids

Brittany L. Mueller *a, Mark J. Liberman a and Dmitry M. Kolpashchikov *abc
aChemistry Department, University of Central Florida, 4000 Central Florida Blvd., Orlando, FL 32816, USA. E-mail: dmitry.kolpashchikov@ucf.edu
bBurnett School of Biomedical Sciences, University of Central Florida, Orlando, Florida, USA
cNational Center for Forensic Science, University of Central Florida, Orlando, FL, USA

Received 9th October 2022 , Accepted 25th February 2023

First published on 27th February 2023


Abstract

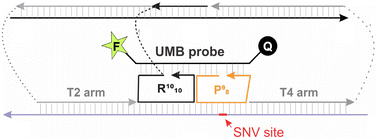
Hybridization probes have been used in the detection of specific nucleic acids for the last 50 years. Despite the extensive efforts and the great significance, the challenges of the commonly used probes include (1) low selectivity in detecting single nucleotide variations (SNV) at low (e.g. room or 37 °C) temperatures; (2) low affinity in binding folded nucleic acids, and (3) the cost of fluorescent probes. Here we introduce a multicomponent hybridization probe, called OWL2 sensor, which addresses all three issues. The OWL2 sensor uses two analyte binding arms to tightly bind and unwind folded analytes, and two sequence-specific strands that bind both the analyte and a universal molecular beacon (UMB) probe to form fluorescent ‘OWL’ structure. The OWL2 sensor was able to differentiate single base mismatches in folded analytes in the temperature range of 5–38 °C. The design is cost-efficient since the same UMB probe can be used for detecting any analyte sequence.

Introduction

Single nucleotide variations (SNVs) are the most common cause of genetic alterations in the human genome.1–3 The identification of specific SNVs aids in the management of human genetic disorders, and early SNV detection in clinically relevant microbes is crucial in treating infections caused by drug resistant pathogens.4–8 Traditional methods for SNV detection include DNA sequencing, polymerase chain reaction (PCR) with melting curve analysis,9 and hybridization assays. DNA sequencing, such as next-generation sequencing (NGS), requires expensive instrumentation and a significant amount of time for data processing.10 PCR has an astounding range of applications from probe-based real-time PCR to post-amplification product analysis but relies on expensive instrumentation with precise temperature control for SNV differentiation.11–14 Hybridization assays utilizing peptide nucleic acid and locked nucleic acid probes,15,16 cycling probe technology,17 TaqMan,18 and Molecular Beacon (MB)19 probes all suffer from the affinity/selectivity dilemma, which declares that tight binding of a probe to an analyte is associated with low selectivity.20,21 Recent advances in SNV detection include ratio sensing via depletion of wild-type (WT) target,22 programmable DNAzymes,23 the use of CRISPR/Cas systems in conjunction with hybridization chain reactions,24 and detection via lateral flow dipsticks after recombinase polymerase amplification with altered primers.25 The best studied hybridization probes, however, all share the challenges of inefficient hybridization with RNA and DNA analytes folded in stable secondary structures, difficulty differentiating between wild-type (WT) and SNV-containing DNA at ambient temperatures, and their high synthetic cost.20,21,26,27

Of the hybridization assays, the MB probe, a fluorophore- and quencher-labeled DNA harpin, has one of the most elegant designs (Fig. 1A).19,28 The GC rich stem enables the quencher and fluorophore to remain in proximity for more efficient quenching in the absence of the complementary analyte sequence. Upon hybridization to the complementary analyte, the MB probe opens into an elongated conformation, and fluorescence is observed.19,28 A typical MB probe achieves a limit of detection (LOD) of ∼1 nM,28 establishing it as a significant diagnostic tool capable of detecting specific nucleic acids after amplification.29–31


image file: d2nr05590b-f1.tif
Fig. 1 MB probe and Design of OWL1 Sensor. (A) MB probe (B) OWL1 sensor forms a 4-stranded fluorescent OWL structure only in the presence of the matched analyte. UMB (universal MB) probe is not dependent on the analyte's sequence and can be used universally.

Although the MB probes is able to differentiate SNVs in a broader temperature range than linear (hairpin-free) probes,26 they fail in differentiating SNV at ambient (0–40 °C) temperatures and, in practice, require costly instrumentation capable of measuring DNA-melting profiles.29–31 Moreover, the MB probe is unable to hybridize with analytes folded in stable secondary structures because it first needs to overcome unfolding of its own stem-loop before hybridizing with another nucleic acid sequence.19,32

To enable SNV differentiation at ambient temperatures, we previously took advantage of DNA nanotechnology and designed an MB probe-based sensor which forms a four-stranded complex in the presence of an analyte, dubbed OWL sensor (OWL1 sensor in Fig. 1B).33 In the OWL structure, strands P and R hybridize to the analyte adjacent to each other and cooperatively open the MB probe hairpin. While strand R forms a perfect 10-nucleotide (nt) hybrid with the analyte, strand P has only 9 nts complementary to the analyte and a single-base mismatch that readily destabilizes the complex. Indeed, OWL1 sensor differentiated SNVs in the entire range of 5–32 °C with single-base mismatched analytes producing only background fluorescence.33 Importantly, at least in part, this unprecedented SNV selectivity was attributed to the unique rigid OWL nanoscale structure: both strands P and R must fold in ‘circular’ forms with 3′- and 5′-terminal base pairs being in stacking interactions with each other, thus creating a structural lock (‘locked ends’ in Fig. 1). This feature of the nanoscale structure makes the OWL sensor structurally constrained and less tolerant to mismatches in comparison with other hybridization probes that possess ‘unlocked’ ends (e.g. MB probe in Fig. 1A).33 Adjusting the OWL1 sensor to each new analyte requires changing only unmodified DNA strands P and R, while the same MB probe can be used for the analysis of any nucleic acid sequence. This allows for an opportunity to optimize only one universal MB (UMB) probe, which reduces the optimization efforts and the assay cost in comparison with the MB probe approach if multiple sequences are to be detected.

However, the OWL1 structure was too ‘fragile’ to form a complex with RNA or ssDNA analytes folded in stable secondary structures. This left us with a question: how can we extend the application of the OWL sensor approach toward folded nucleic acids?

OWL2 design and performance

To overcome the limitations of the OWL1 sensor, we designed the OWL2 sensor (Fig. 2). It also uses the UMB probe and P strand, but the free R strand of OWL1 was replaced with an association of DNA strands T1, T2, T3, and T4. The R strand was attached via a trithymidine linker to a fragment complementary to T1. Strands T2 and T4 contained long analyte-binding arms, and T1 provided scaffolding for the complex formation. Together with R strand, the arms of T2 and T4 hybridized to the folded analyte and opened its secondary structure. The association of R, T2, and T4 with the analyte did not result in fluorescent signalling unless the P strand selectively hybridized with the SNV-containing site of the analyte and completed the OWL structure by allowing for the binding and subsequent opening of UMB.
image file: d2nr05590b-f2.tif
Fig. 2 Design of the OWL2 Sensor. OWL2 sensor consists of P strand, UMB probe, and an association of T1, T2, T3, and T4 strands (top). The strands form a fluorescent structure, even in the presence of folded analytes (bottom).

As a model analyte for initial optimization of the OWL2 sensor, we chose SNV ‘0C’ and ‘1A’ (Fig. 3A and Table S3) found in the tau gene. These SNVs can lead to an increase in alternative splicing of exon 10, skewing the ratios of tau protein isoforms and causing Alzheimer's Disease (AD).35,36 The secondary structures of synthetic fully matched analytes Tau60-WT and Tau18-WT are shown in Fig. 3A. The total energy of folded Tau60-WT is −11.34 kcal mol−1, with the SNV-containing stem contributing to much of the stabilization.36 It is important to note that the MB probe designed against Tau analyte failed in producing a fluorescent output.37 Tau18-WT was designed to be fully complementary to strands P and R, but lacked the T2 and T4 binding sites. This short oligonucleotide formed a weak stem-loop structure, thus resembling a linear analyte under experimental conditions (Fig. 3A) and was used to study the effect of T2 and T4 arms on the sensor's performance.


image file: d2nr05590b-f3.tif
Fig. 3 SNV differentiation in Tau analytes. (A) The secondary structures of Tau60-WT and Tau18-WT analytes predicted by NUPACK.34 The SNV sites are circled red, and the regions of OWL2 hybridization (P/R/T2 and T4 arms) are outlined around their structure. (B) OWL2 sensor (UMB, 25 nM; P98, 200 nM; T1/T2/T3/T4 association 100 nM, in the hybridization buffer 1: 50 mM Tris-HCl, 50 mM MgCl2, 0.1% Tween-20, pH 7.4) was incubated with 100 nM Tau60-WT (purple) or Tau18-WT (striped, purple) or corresponding single-base mismatched analytes (grey). The data is the average of three independent measurements. (C) Differentiation table for Tau60 (folded) analytes with formula for differentiation factor, Df, where ΔF represents the difference between the measured signal and the blank.

The binding site of the P strand was chosen such that the two SNV sites corresponded to the middle positions of the strand for best SNV differentiation.33 The analyte-binding site for the R strand, adjacent to the P strand binding site, formed a 10 base-pair (bp) duplex with the analyte and enabled both UMB-binding arms of the R strand to be positioned on the same side of the B DNA helix as needed for the formation of OWL structure.33 The T2- and T4-arms were chosen to have melting temperatures above the assay temperature (24 °C) and to have little or no secondary structures to ensure tight analyte association with the OWL nanostructure.

We optimized the concentration and sequences of the P strand to produce the highest signal-to-background ratio (S/B) and the greatest SNV differentiation (see details below). The optimal P strand had 9 nts and 8 nts complementary to the UMB probe and the analyte, respectively, and was, therefore, named P98. It was used at the concentration of 200 nM, which provided the highest S/B (Fig. S1). The optimized OWL2 sensor (Fig. S2C) produced a S/B of ∼18 and maintained excellent selectivity that the OWL1 sensor exhibited for unstructured analytes (Fig. 3B). It was able to differentiate Tau60-WT from single-base mismatched Tau60-1A and Tau60-0C in the temperature range of 5–38 °C (Fig. S3). This range is shifted toward low temperatures and almost 2 times broader than that for a typical MB probe that differentiates analytes with single base difference in the range of e.g. (53–70 °C).26 The LOD for the folded Tau60-WT using OWL2 sensor was ∼0.4 nM (Fig. S5), which was lower than that of the short Tau18-WT with OWL1 sensor (∼1.3 nM, Fig. S2B), and falls in the range of LODs demonstrated by the best MB probes in detecting unfolded analytes.28 To the best of our knowledge, this combination of high S/B and excellent selectivity in detecting folded analytes (Fig. 3B, 1st group of bars) is unprecedented.

Next, we demonstrated that each feature of the OWL2 sensor contributes to at least one of the following functions: (1) enabling detection of folded analytes and (2) accurate discrimination of SNVs, (3) maintaining detection efficiency and selectivity over a range of ambient and low temperatures, and (4) ensuring low reagent cost due to “universality” of the UMB probe.

T2 and T4 arms are necessary for the detection of the folded Tau60-WT analyte

The removal of the T2- and T4-arms resulted in a loss of the OWL2 ability to detect the folded Tau60-WT (Fig. 3B, bars grouped as “OWL2 no arms”), which mimicked the sensing capabilities of OWL1 (Fig. 3B, bars grouped as “OWL1”). The inclusion of arms decreases the energy barrier for hybridization to folded DNA sequences and allows for the opening of their secondary structures. Interestingly, OWL1 produced a lower signal with Tau18-WT than OWL2 in the presence of Tau60-WT (Fig. 3B). This suggests that an important function of T2 and T4 arms is not only to remove the structural constraint in the Tau60-WT structure, but also to position the analyte next to the R strand for tighter binding. Therefore, T2 and T4 arms are likely to participate in the stabilization of the OWL structure by increasing the local analyte concentration in proximity to the R strand.

On the other hand, OWL1 in complex with Tau18-WT produced a greater S/B than OWL2 lacking sensor T2 and T4 (“OWL2 no arms”) (Fig. 3B). This can be explained by the reduced attraction of Tau18-WT to the bulky OWL2 nanostructure due to electrostatic repulsion. At the same time, the OWL1 sensor expectedly failed in detecting the folded Tau60-WT analyte (Fig. 3B). Therefore, we were able to conclude that the T2- and T4-arms are necessary for the detection of analytes folded in stable secondary structures.

Flexible linkers between stand R and the DNA scaffold enable higher S/B

Positioning of the fragile OWL structure near a bulky DNA scaffold formed by T1, T2, T3 and T4 in the OWL2 sensor might be challenging due to steric hindrance, which is hard to predict without knowing the crystal structure of the OWL2 sensor. We varied the nature of the linker between the R strand and the scaffold-forming fragment of the T3 strand ranging from the least flexible regular phosphodiester (PDE) linkage to more flexible trithymidylate (ttt) and hexaethylene glycol (iSp18) linkers (Fig. S4 and S5). For the experiments with P99, we found that an increase in linker flexibility resulted in a mild increase in fluorescence for both mismatched and matched analytes (Fig. S4). In the case of P98, increased flexibility of a linker allowed for an increase in S/B for the fully matched analyte from ∼14 (PDE) to ∼18 (ttt) and to ∼25 (iSp18) without compromising the selectivity (Fig. S5). Therefore, the S/B reported above for the optimal sensor can be increased from 18 to 25 by replacing the ttt linker with the iSp18 linker. This indicates that a spatial separation of the R strand from the scaffold is important for the stability of the OWL structure. The increase in S/B did not, however, change the LOD of the sensor (Fig. S5C). In this work we, therefore, considered the increase of S/B for the iSp18 linker a minor advantage in comparison with the lower cost of the ttt linkers and conducted most of the experiments using the ttt linker equipped OWL2 sensor.

Structural constraint in the OWL structure promotes high selectivity of the OWL sensor

Following our previous results,33 we hypothesized that the unprecedented SNV differentiation, at least in part, is the consequence of the conformational strain ensured by the OWL structure and the locked ends of the P strand (Fig. 1B).

First, we redesigned the optimal P98 strand to have opened ends, named C98 strand (Fig. 4A and Table S2). Like all known probes, except the OWL sensor, C98 strand had 5′ and 3′ ends unlocked: they were free to acquire any position relative to each other. It was found that fluorescence of the C98-containing OWL2 was higher than that of the P98-equipped sensor. However, the sensor lost its selectivity (Fig. 4B and Table 1). Furthermore, substitution of P98 with P99 also diminished SNV differentiation and increased the overall fluorescent response (Fig. 4B). The observed increase in fluorescence can be explained by greater flexibility of the C98- or P99-equipped OWL2 sensor (see Discussion for more details).


image file: d2nr05590b-f4.tif
Fig. 4 OWL2 equipped with P98 strand was the most selective. (A) OWL2 design with changes in the highlighted region depicted below the OWL2 structure. P99 contains 9 nt complementary each to UMB and the analyte; P98 contains 9 nt complementary to UMB and 8 nt complementary to the analyte. C98 has the UMB- and analyte-binding arms of similar length as P98. (B) S/B of the OWL2 sensor containing different SNV-specific stands in the presence of 100 nM fully matched Tau60-WT or Tau18-WT (dark grey bars) or single-base mismatched analytes (light grey bars). The data is an average of three independent measurements.
Table 1 Signal to background ratio (S/B) and differentiation factor (Df) for the OWL2 sensors containing three variations of the P strand. Df = 1 − ΔFmmFm, where ΔF represents the signal of matched (m) or mismatched (mm) analyte with the signal of the blank (no analyte) subtracted32
Design S/B D f
Free stand WT 0C 1A 0C 1A
P98 17.7 1.2 1.2 0.99 0.99
P99 27.6 7.0 6.9 0.78 0.78
C98 25.1 15.0 16.4 0.40 0.33
R10, iSp18 19.1 1.6 1.7 0.96 0.96


We next tested if the flexibility of R-strand affects the selectivity and S/B. For this purpose, we introduced an iSp18 spacer between the UMB-hybridizing and analyte-hybridizing regions of R1010 near its 5′-end (Fig. S6A). We used this flexible R1010 strand with P98 and found that the S/B changed insignificantly with a noticeable reduction in SNV differentiation (Fig. S6B and Table 1). Indeed, the differentiation factor (Df,32Table 1) decreased from 0.99, which corresponds to a 100-fold higher fluorescent signal of the matched analyte being than that of the mismatch, to 0.96 (25-fold ration between the signals triggered by the matched and mismatched analytes). This data suggests that the structural constraint of the R strand has lower effect on the OWL2 sensor performance than the constraint contributed by the P strand.

Indeed, the constrained and rigid nature of the SNV-selective P-strand contributes the most to differentiation of WT from the mutants. By designing the P-strand with locked 5′- and 3′-ends in complex with UMB, we created a conformational strain that is unable to remain stable unless all 8 base pairs are complementary to the analyte. In the presence of a mismatch, the strain experienced by P98 is great enough to inhibit P-strand hybridization to the analyte, which decomposes the OWL complex. If there are no mismatches, the P-strand is stabilized by the 8 base pairs complementary to the analyte, the stress of the conformational strain is insufficient to cause dissociation of the P-strand, and the scaffolding for UMB hybridization is complete.

Gap effect and P-strand optimization

Previous studies have shown that the stability of multistranded DNA complexes are affected by the distance between adjacent DNA strands hybridized to a complementary nucleic acid.38–40 Therefore, we introduced a single nucleotide gap between the P-strand and T4-arm. The introduced gap did not significantly affect the S/B or DF of the optimal sensor containing P98 (Fig. S5 and S7). This indicates that the stability of the OWL structure does not depend on the staking interaction with the flanking T4 arm. However, we noticed a loss in the S/B or selectivity for the OWL2 sensor equipped with other P stands (Fig. S8 and Table S4). Some of these undesired effects were explained by interaction of the P strand with the gap-forming nucleotide of the analyte (see comments to Fig. S8). We, therefore, concluded that OWL2 without a gap between P and T4 arm is preferable.

Detection of WT analyte in the presence of mismatched analyte

It was interesting to investigate if excellent selectivity of the OWL2 sensor allows detecting the matched analyte in the presence of excess amounts of a mismatched analyte. This capability of the sensor would be useful for detecting small fractions of cancerous DNA in an excess amount of healthy DNA for early-stage cancer diagnosis.22 We measured the LOD of the fully matched Tau60-WT analyte with the optimal OWL2 sensor in the presence of 50 nM Tau60-0C as a buffer component (Fig. 5). The LOD was found to be 0.4 nM, the same as in the absence of the mismatched analyte. This result indicated that the OWL2 sensor can differentiate from single-base mismatches and detect the fully matched analyte even when it makes up only 0.8% of the total analyte, which is comparable with the state-of-the-art fluorescent sensors.22,41 An increase of the mismatched Tau60-0C analyte to 500 nM required an increase in the OWL2 (T1/T2/T3/T4) to 600 nM and a decrease in P98 to 50 nM in order to offset some of the background fluorescence. We found that the concentration of analytes should not exceed our OWL2 (T1/T2/T3/T4 association) sensor concentration, likely due to the hybridization of T2- and T4-arms to analyte, even when it contains a mismatch. Due to high OWL2 concentration, the background fluorescence was high, which resulted to high LOD of ∼8 nM (Fig. 5). Therefore, further sensor optimization is needed to improve the detection of low fractions of the true targets in the presence of single base mismatched analytes.
image file: d2nr05590b-f5.tif
Fig. 5 OWL2 sensor detects the fully matched analyte in ∼125 times excess of single-base mismatched analytes. The limit of detection of the Tau60-WT analyte in the presence of 50 nM Tau-60 0C (black line) is 0.4 nM, which is the same as the LOD in the absence of mismatch (red line) and corresponds to a detection in the presence of 125× mismatch; 100 nM OWL2 (T1/T2/T3/T4), 25 nM UMB15, 200 nM P98 in hybridization buffer 1 (50 nM and 0 nM Tau60-WT). The limit of detection of Tau60-WT analyte in the presence of 500 nM Tau60-0C (blue line) is 7.9 nM, corresponding to a detection in the presence of 60× mismatch with an increase in sensor concentrations; 600 nM OWL2 (T1/T2/T3/T4), 25 nM UMB15, 50 nM P98 strand.

G:T discrimination

G–T mismatches are known to be the least destabilizing of all base-mispairing scenarios and, therefore, the most challenging to discriminate.42,43 Here, we investigated if the OWL2 sensor is capable of differentiating an analyte that forms a single G–T mismatch with the sensor. We found that P98 has Df of 0.45 when tested against the Tau60-2G analyte, which has an A > G substitution (Fig. 6C and Fig. S9D for structure). We also tested the effect of two other G–T mismatches by changing the sequence of the P-strand: P98 A > G and P98 C > T (Fig. 6B and Table S2) had full complementarity to the Tau60-0C and Tau60-1A analytes, respectively. They were able to discriminate against G–T mismatches with a Df of 0.84 and 0.98. (Fig. 6).
image file: d2nr05590b-f6.tif
Fig. 6 Discrimination of G:T mismatches. (A) S/B response of the OWL2 sensor to the presence of 100 nM fully matched (M) or mismatched analytes (A:C and G:T) as indicated above the bars. The data is the average of three independent measurements. (B) Sequences of the P-strand and analytes with changes in the P-strand highlighted in black and the analytes shown below, complementary to the P strand. A:C mismatches are highlighted in green and G:T mismatches are highlighted in red. (C) Tabulated S/B and Df values for each analyte. Tau60-WT is denoted “WT” in the table, but it is only fully complementary to the normal (unsubstituted) P98.

Discrimination using the original P98 was expectedly poor since the G–T was situated between the two stable G–C base pars and shifted from the middle of the stand P-analyte hybrid. Mismatches on the ends of hybridization sites are known to be less destabilizing than those in the center.32,33 Expectedly, the mismatches closer to the center (P98 A > G and P98 C > T) were better discriminated. However, P98 C > T had a greater A/T content, which possibly led to the best discrimination of the three. We show that, through modification of the P-strand, we can differentiate even G–T mismatches, with the best discriminating ability of the sensors containing G–T mismatch in the middle position of stand P/analyte complex and when flanked by A–T base pairs (Fig. 6A, 3rd group of bars).

Detection of RNA analyte

Since the characteristics of RNA/DNA helical structure are somewhat different due to the difference in ribose and deoxyribose conformation,44 we investigated if the same OWL-2 sensor that performs well with DNA analytes is suitable for detecting an RNA analyte. We found that the OWL2 sensor equipped with P98 strand was able to detect Tau60-WT RNA at a LOD of 0.8 nM, which is comparable to the 0.4 nM LOD of Tau-60 DNA (Fig. S12). The ability of the OWL sensor to detect RNA may have practical significance since Tau-60 DNA is associated with the development of Alzheimer's disease.35,36

OWL2 sensor can be redesigned for another analyte in a cost-efficient manner

To ensure that OWL2 can be easily redesigned for other analytes, we applied it to a sequence from the Covid-19-causing SARS-CoV2 virus. By only changing the analyte-binding portions of T2, T3, T4, and P-strand (named CP-strand for Covid-19), we were able to show that both CP98 and CP99 allowed for differentiation of the fully matched CVD60-WT from the mismatched CVD60-1C and CVD60-0Ganalytes (Fig. 7). We found this to be juxtaposed with the Tau-specific OWL2 sensor, which was not specific when equipped with P99. This different sensor behaviour could be explained by the A/T-rich sequence complementary to CP99 in CVD60-WT. We speculate that if the P-strand binding region is A/T rich, the P99 may still provide selectivity. However, this statement should be verified with other sets of analytes.
image file: d2nr05590b-f7.tif
Fig. 7 OWL2 Sensor differentiates SNVs in Covid-19-related sequences. (A) OWL2 sensor adapted for detection of Covid-19 analyte; T1 and UMB remain unchanged. (B) S/B for the OWL2 sensor with 200 nM CP98 and CP99 in the presence of 100 nM analyte. (C) Secondary structure of Covid-19 WT used in this study. T > G and T > C mutations are indicated by red circles. (D) Values for S/B and Df for each analyte.

Overall, these results show that the OWL2 design can be easily adapted to detect another analyte without the need for costly changes. The cost of one nucleotide addition in IDT Inc. is $0.42 (minimum synthetic scale), which comes to 56.7 USD for adaptation of T2, T3, T4, and P-strand to each new analyte. At the same time, the cost of a new MB probe is ∼350 USD (minimum synthetic scale) due to the need for conjugation of the oligonucleotide with two dyes and double HPLC purification. Additionally, the design of an MB probe for each new analyte is known to be associated with many problems, such as stem invasion and loop interference, to the degree that it is impossible to design an efficient MB probe for some analytes.28,32 By designing the UMB-hybridizing regions of R- and P-strands to be independent of the analyte sequence, we allow the UMB technology to be applied for analytes of potentially any sequence. Furthermore, we showed that OWL2 design is applicable to both DNA and RNA analytes which contain an SNV in both the stem and the loop regions (Fig. S9 and S10).

Conclusion

The OWL2 sensor shines where most hybridization probes fall short. The remarkable characteristics of the sensor include a S/B of 18 and LOD in sub-nanomolar range both for DNA and RNA analytes. It has an extraordinary ability to differentiate mismatched analytes from the fully matched ones including the most challenging G–T mismatches in the temperature range of 5–38 °C. Despite looking complex, the sensor is cost efficient when applied for new analytes. The UMB reporter, the most expensive and hard to design component, is analyte independent, so that can be optimized once and then used for the analysis of any DNA or RNA sequences. These features make the OWL2 sensor a highly specific, selective, and versatile tool, which seeks to improve the field of hybridization assays.

Author contributions

B. L. M. and D. M. K. conceived the experiments. B. L. M. and M. J. L. conducted the experiments. B. L. M. and D. M. K. wrote the manuscript. All authors provided critical feedback and helped shape the research, analysis, and manuscript.

Conflicts of interest

There are no conflicts to declare.

Acknowledgements

The authors are grateful to Dr Yulia Gerasimova for discussion and corrections. This work was supported by the National Science Foundation through the CCF: Software and Hardware Foundations under cooperative agreement SHF-1907824 and CCF: SHF-2226021.

References

  1. J. C. e. a. Venter, Science, 2001, 291, 1304–1351 CrossRef CAS PubMed.
  2. R. Sachidanandam, D. Weissman, S. C. Schmidt, J. M. Kakol, L. D. Stein, G. Marth, S. Sherry, J. C. Mullikin, B. J. Mortimore and D. L. Willey, Nature, 2001, 409, 928–934 CrossRef CAS.
  3. J. Hanson, D. Brezavar, S. Hughes, S. Amudhavalli, E. Fleming, D. Zhou, J. T. Alaimo and P. E. Bonnen, Clin. Genet., 2022, 101, 214–220 CrossRef CAS PubMed.
  4. M. A. Field, Immunol. Cell Biol., 2021, 99, 146–156 CrossRef PubMed.
  5. P. D. Stenson, E. V. Ball, M. Mort, A. D. Phillips, J. A. Shiel, N. S. T. Thomas, S. Abeysinghe, M. Krawczak and D. N. Cooper, Hum. Mutat., 2003, 21, 577–581 CrossRef CAS PubMed.
  6. S. H. Jiang, V. Athanasopoulos, J. I. Ellyard, A. Chuah, J. Cappello, A. Cook, S. B. Prabhu, J. Cardenas, J. Gu, M. Stanley, J. A. Roco, I. Papa, M. Yabas, G. D. Walters, G. Burgio, K. McKeon, J. M. Byers, C. Burrin, A. Enders, L. A. Miosge, P. F. Canete, M. Jelusic, V. Tasic, A. C. Lungu, S. I. Alexander, A. R. Kitching, D. A. Fulcher, N. Shen, T. Arsov, P. A. Gatenby, J. J. Babon, D. F. Mallon, C. de Lucas Collantes, E. A. Stone, P. Wu, M. A. Field, T. D. Andrews, E. Cho, V. Pascual, M. C. Cook and C. G. Vinuesa, Nat. Commun., 2019, 10, 2201 CrossRef PubMed.
  7. G. Cao, Y. Qiu, K. Long, Y. Ma, H. Luo, M. Yang, J. Hou, D. Huo and C. Hou, Anal. Chem., 2022, 94, 17653–17661 CrossRef CAS PubMed.
  8. C. Graham, A. Eshaghi, A. Sarabia, S. Zittermann, P. Stapleton, J. V. Kus and S. N. Patel, Access Microbiol., 2020, 2, acmi000111 Search PubMed.
  9. T.-L. Li, M.-W. Wu, W.-C. Lin, C.-H. Lai, Y.-H. Chang, L.-J. Su and W.-Y. Chen, Anal. Bioanal. Chem., 2019, 411, 3871–3880 CrossRef CAS PubMed.
  10. C. P. Paweletz, A. G. Sacher, C. K. Raymond, R. S. Alden, A. O'Connell, S. L. Mach, Y. Kuang, L. Gandhi, P. Kirschmeier, J. M. English, L. P. Lim, P. A. Jänne and G. R. Oxnard, Clin. Cancer Res., 2016, 22, 915–922 CrossRef CAS PubMed.
  11. T. Li, H. Zou, J. Zhang, H. Ding, C. Li, X. Chen, Y. Li, W. Feng and K. Kageyama, Analyst, 2022, 147, 3993–3999 RSC.
  12. M. Azhar, R. Phutela, M. Kumar, A. H. Ansari, R. Rauthan, S. Gulati, N. Sharma, D. Sinha, S. Sharma, S. Singh, S. Acharya, S. Sarkar, D. Paul, P. Kathpalia, M. Aich, P. Sehgal, G. Ranjan, R. C. Bhoyar, K. Singhal, H. Lad, P. K. Patra, G. Makharia, G. R. Chandak, B. Pesala, D. Chakraborty and S. Maiti, Biosens. Bioelectron., 2021, 183, 113207 CrossRef CAS PubMed.
  13. V. Taly, D. Pekin, L. Benhaim, S. K. Kotsopoulos, D. Le Corre, X. Li, I. Atochin, D. R. Link, A. D. Griffiths, K. Pallier, H. Blons, O. Bouché, B. Landi, J. B. Hutchison and P. Laurent-Puig, Clin. Chem., 2013, 59, 1722–1731 CrossRef CAS PubMed.
  14. S. Bai, B. Xu, Y. Zhang, Y. Zhang, H. Dang, S. Yang, C. Zuo, L. Zhang, J. Li and G. Xie, Biosens. Bioelectron., 2020, 154, 112092 CrossRef CAS PubMed.
  15. N. Zhang and D. H. Appella, J. Infect. Dis., 2010, 201, S42–S45 CrossRef CAS.
  16. M. B. Thayer, J. M. Lade, D. Doherty, F. Xie, B. Basiri, O. S. Barnaby, N. S. Bala and B. M. Rock, Sci. Rep., 2019, 9, 3566 CrossRef.
  17. F. Bekkaoui, I. Poisson, W. Crosby, L. Cloney and P. Duck, BioTechniques, 1996, 20, 240–248 CrossRef CAS PubMed.
  18. Q. Huang, Z. Liu, Y. Liao, X. Chen, Y. Zhang and Q. Li, PLoS One, 2011, 6, e19206 CrossRef CAS PubMed.
  19. S. Tyagi and F. R. Kramer, Nat. Biotechnol., 1996, 14, 303–308 CrossRef CAS PubMed.
  20. V. V. Demidov and M. D. Frank-Kamenetskii, Trends Biochem. Sci, 2004, 29, 62–71 CrossRef CAS PubMed.
  21. D. M. Kolpashchikov, Chem. Rev., 2010, 110, 4709–4723 CrossRef CAS.
  22. R. Van Hoof, M. Szymonik, S. K. Nomidis, K. Hollanders, A. Jacobs, I. Nelissen, P. Wagner and J. Hooyberghs, Sens. Actuators, B, 2022, 368, 132175 CrossRef CAS.
  23. L. Chen, H. Huang, Z. Wang, K. Deng and H. Huang, Talanta, 2022, 243, 123352 CrossRef CAS PubMed.
  24. X. Ke, Y. Ou, Y. Lin and T. Hu, Biosens. Bioelectron., 2022, 212, 114428 CrossRef CAS PubMed.
  25. M. Ahmed, N. M. Pollak, G. J. Devine and J. Macdonald, Sens. Actuators, B, 2022, 367, 132085 CrossRef CAS.
  26. M. Stancescu, T. A. Fedotova, J. Hooyberghs, A. Balaeff and D. M. Kolpashchikov, J. Am. Chem. Soc., 2016, 138, 13465–13468 CrossRef CAS PubMed.
  27. P. Hardinge and J. A. H. Murray, BMC Biotechnol., 2019, 19, 55 CrossRef PubMed.
  28. D. M. Kolpashchikov, Scientifica, 2012, 2012 Search PubMed.
  29. E. Navarro, G. Serrano-Heras, M. J. Castaño and J. Solera, Clin. Chim. Acta, 2015, 439, 231–250 CrossRef CAS.
  30. S. A. E. Marras, S. Tyagi and F. R. Kramer, Clin. Chim. Acta, 2006, 363, 48–60 CrossRef CAS PubMed.
  31. M. W. McCarthy and T. J. Walsh, Expert Rev. Mol. Diagn., 2016, 16, 1025–1036 CrossRef CAS PubMed.
  32. C. Nguyen, J. Grimes, Y. V. Gerasimova and D. M. Kolpashchikov, Chemistry, 2011, 17, 13052–13058 CrossRef CAS PubMed.
  33. R. J. Karadeema, M. Stancescu, T. P. Steidl, S. C. Bertot and D. M. Kolpashchikov, Nanoscale, 2018, 10, 10116–10122 RSC.
  34. J. N. Zadeh, C. D. Steenberg, J. S. Bois, B. R. Wolfe, M. B. Pierce, A. R. Khan, R. M. Dirks and N. A. Pierce, J. Comput. Chem., 2011, 32, 170–173 CrossRef CAS PubMed.
  35. M. Goedert and R. Jakes, Biochim. Biophys. Acta, 2005, 1739, 240–250 CrossRef CAS PubMed.
  36. M. Hasegawa, M. J. Smith, M. Iijima, T. Tabira and M. Goedert, FEBS Lett., 1999, 443, 93–96 CrossRef CAS PubMed.
  37. J. Grimes, Y. V. Gerasimova and D. M. Kolpashchikov, Angew. Chem., Int. Ed., 2010, 49, 8950–8953 CrossRef CAS PubMed.
  38. S. Cai, C. Lau and J. Lu, Anal. Chem., 2010, 82, 7178–7184 CrossRef CAS PubMed.
  39. P. Yakovchuk, E. Protozanova and M. D. Frank-Kamenetskii, Nucleic Acids Res., 2006, 34, 564–574 CrossRef CAS PubMed.
  40. D. V. Pyshnyi, S. G. Lokhov, M. A. Podyminogin, E. M. Ivanova and V. F. Zarytova, Nucleosides, Nucleotides Nucleic Acids, 2000, 19, 1931–1941 CrossRef CAS PubMed.
  41. D. M. Kolpashchikov, J. Am. Chem. Soc., 2006, 128, 10625–10628 CrossRef CAS PubMed.
  42. F. Aboul-Ela, D. Koh, I. Tinoco Jr. and F. H. Martin, Nucleic Acids Res., 1985, 13, 4811–4824 CrossRef CAS PubMed.
  43. X. Piao, L. Sun, T. Zhang, Y. Gan and Y. Guan, Acta Biochim. Pol., 2008, 55, 713–720 CrossRef CAS PubMed.
  44. J. I. Gyi, A. N. Lane, G. L. Conn and T. Brown, Biochemistry, 1998, 37, 73–80 CrossRef CAS PubMed.

Footnote

Electronic supplementary information (ESI) available. See DOI: https://doi.org/10.1039/d2nr05590b

This journal is © The Royal Society of Chemistry 2023