
Correlation between oxygen evolution reaction activity and surface compositional evolution in epitaxial La0.5Sr0.5Ni1−xFexO3−δ thin films†
Prajwal
Adiga
a,
Le
Wang
 *b,
Cindy
Wong
a,
Bethany E.
Matthews
c,
Mark E.
Bowden
d,
Steven R.
Spurgeon
ce,
George E.
Sterbinsky
f,
Monika
Blum
gh,
Min-Ju
Choi
b,
Jinhui
Tao
b,
Tiffany C.
Kaspar
b,
Scott A.
Chambers
b,
Kelsey A.
Stoerzinger
*ab and
Yingge
Du
b
*b,
Cindy
Wong
a,
Bethany E.
Matthews
c,
Mark E.
Bowden
d,
Steven R.
Spurgeon
ce,
George E.
Sterbinsky
f,
Monika
Blum
gh,
Min-Ju
Choi
b,
Jinhui
Tao
b,
Tiffany C.
Kaspar
b,
Scott A.
Chambers
b,
Kelsey A.
Stoerzinger
*ab and
Yingge
Du
b
aSchool of Chemical, Biological and Environmental Engineering, Oregon State University, Corvallis, Oregon 97331, USA. E-mail: kelsey.stoerzinger@oregonstate.edu
bPhysical and Computational Sciences Directorate, Pacific Northwest National Laboratory, Richland, Washington 99354, USA. E-mail: le.wang@pnnl.gov
cEnergy and Environment Directorate, Pacific Northwest National Laboratory, Richland, Washington 99352, USA
dEnvironmental Molecular Sciences Laboratory, Pacific Northwest National Laboratory, Richland, Washington 99352, USA
eDepartment of Physics, University of Washington, Seattle, Washington 98195, USA
fAdvanced Photon Source, Argonne National Laboratory, Lemont, Illinois 60439, USA
gAdvanced Light Source, Lawrence Berkeley National Laboratory, Berkeley, California 94720, USA
hChemical Sciences Division, Lawrence Berkeley National Laboratory, Berkeley, California 94720, USA
First published on 14th December 2022
Abstract
Water electrolysis can use renewable electricity to produce green hydrogen, a portable fuel and sustainable chemical precursor. Improving electrolyzer efficiency hinges on the activity of the oxygen evolution reaction (OER) catalyst. Earth-abundant, ABO3-type perovskite oxides offer great compositional, structural, and electronic tunability, with previous studies showing compositional substitution can increase the OER activity drastically. However, the relationship between the tailored bulk composition and that of the surface, where OER occurs, remains unclear. Here, we study the effects of electrochemical cycling on the OER activity of La0.5Sr0.5Ni1−xFexO3−δ (x = 0–0.5) epitaxial films grown by oxide molecular beam epitaxy as a model Sr-containing perovskite oxide. Electrochemical testing and surface-sensitive spectroscopic analyses show Ni segregation, which is affected by electrochemical history, along with surface amorphization, coupled with changes in OER activity. Our findings highlight the importance of surface composition and electrochemical cycling conditions in understanding OER performance, suggesting common motifs of the active surface with high surface area systems.
 Kelsey A. Stoerzinger | Dr Kelsey Stoerzinger is an Assistant Professor in the School of Chemical, Biological and Environmental Engineering at Oregon State University. She holds a joint appointment at Pacific Northwest National Laboratory, where she was a Linus Pauling Distinguished Postdoctoral Fellow. Dr Stoerzinger completed her doctoral studies in Materials Science and Engineering from the Massachusetts Institute of Technology, received an M.Phil. in Physics from the University of Cambridge as a Churchill Scholar, and a B.S. from Northwestern University. Her research group focuses on designing and understanding materials that are selective and efficient in the conversion and storage of renewable energy. |
Introduction
Water electrolysis is central to the development of sustainable energy storage and a pathway towards a hydrogen-based economy.1 Electrolyzer efficiency is limited by the high overpotentials required for the anodic oxygen evolution reaction (OER).2 ABO3-type perovskite oxides have gained traction as promising OER catalysts in alkaline electrolytes owing to their low cost, environmental friendliness, and structural and electronic tunability.3–9Perovskite LaNiO3 (LNO) has been extensively studied as Ni3+ offers moderate binding of reaction intermediates and high Ni–O covalency, leading to high OER activity. The incorporation of heteroatoms into the LNO structure has been regarded as one of the most facile and effective strategies to optimize catalytic performance.10–15 For example, A-site substitution of La3+ with Sr2+ in LNO improves OER activity by inducing an upward shift of the O 2p bands relative to the Fermi level, strengthening Ni 3d–O 2p hybridization, and decreasing charge transfer energy.12 On the other hand, B-site doping with non-noble transition metals (e.g. Fe, Co) can strongly tune the 3d-orbital states near the Fermi level, showing a notable influence on OER activity as well.14,15 In addition, dual-site doping in La1−xSrxNi1−xFexO3 has been found by Fu et al. to yield holes mainly characteristic of Fe (vs. Ni), with claims that the Fe4+ state is crucial for enhancing OER activity by six times compared to pure LNO.16 While these studies focus on transition metal cation active sites, recent studies have shown that the lattice oxygen of LNO participates in the formation of reaction intermediates as well, enabling higher OER activity via the lattice oxygen mechanism (LOM).17,18
It has been reported that the surface of some perovskites, especially those containing Sr,19 can lose their crystalline structure after OER. This can yield a local coordination environment resembling oxyhydroxides that are known to form on simple Ni and Fe oxides. In these oxyhydroxides, changes in Ni redox features induced by Fe-incorporation, coupled with changes in OER activity, are known to occur with cycling.20–22 For Sr-containing perovskites, it is likely that some degree of Sr-leaching in an alkaline electrolyte might also lead to a transition-metal rich surface phase under OER conditions; the properties and resultant performance of the surface might change with cycling like in Ni–Fe oxyhydroxide materials.23–25
Herein, we report the cycling- and potential-scan-window-dependent OER activity of La0.5Sr0.5Ni1−xFexO3−δ (LSNFO with x = 0, 0.125, 0.25, 0.375, and 0.5) solid solution epitaxial films. The surface Ni redox behavior is used to understand the change of surface composition along with atomic force microscopy (AFM), X-ray photoelectron spectroscopy (XPS) and transmission electron microscopy (TEM) on pristine and post-cycled films. We find that activity generally increases with cycling, as does the integrated charge of the Ni redox feature. OER activity is maximum for x = 0.25, which is lower in Fe content compared to that with the highest OER activity for LaNi1−xFexO3−δ (x = 0.375),14 and the surface forms an amorphous layer depleted in Sr after cycling. These results emphasize that “intrinsic” OER activity for Ni- and Fe-containing perovskite oxides must consider possible changes at the surface in order to clearly understand the descriptors of catalytic activity.
Results and discussion
Structural and electronic characterization
LSNFO epitaxial thin films of 20 unit cells thickness were grown on (001)-oriented (LaAlO3)0.3(Sr2AlTaO6)0.7 (LSAT) substrates using oxygen-plasma-assisted molecular beam epitaxy (OPA-MBE).14 The X-ray diffraction (XRD) θ–2θ scans near the (002) peak for various Fe compositions (x) shown in Fig. 1a exhibit well-defined Kiessig fringes, confirming their high structural quality. Extended XRD θ–2θ scans of LSNFO samples are shown in Fig. S1a.† Representative reciprocal space maps (RSMs, Fig. S1c†) reveal that these films are coherently strained. Fig. S1c† shows the out-of-plane lattice parameter (c) for LSNFO as a function of x. Compared with the pseudo-cubic lattice constants for bulk LNO and SrNiO3,26,27 the larger value of c for x = 0 suggests that these solid solution samples may contain non-negligible amounts of oxygen vacancies.28 In-plane transport measurements (Fig. S1d†) shows metallic behavior for x ≤ 0.375, but semiconducting behavior for x = 0.5. X-ray photoelectron spectroscopy (XPS) analysis (Fig. 1b) on pristine samples indicate that the surface composition is comparable to that expected from target stoichiometry. To determine the B-site cation valences in LSNFO, Ni K-edge and Fe K-edge X-ray absorption near-edge structure (XANES) spectra were measured (shown in Fig. 1c and d). According to previous studies on Co-based materials,29–31 the energy corresponding to normalized absorption of ≈0.8 can be used to determine the transition metal valence state. As shown in the inset of Fig. 1c, the energy position of Ni–K XANES spectra for the x = 0 sample locates between Ni2+ (NiO) and Ni3+ (LaNiO3) references,14 demonstrating the existence of mixed Ni2+/3+. With increasing x from 0 to 0.5, the Ni–K XANES spectra gradually shift to higher energy and approach that of Ni3+ reference, indicating the increase of Ni valence state with x. This is in contrast to LNFO (without Sr), in which average Ni valence state decreased with increasing Fe content.14 In contrast, films of all Fe content show nominally greater Fe oxidation state than a LaFeO3 (Fe3+) reference (see inset of Fig. 1d), indicating that Sr-substitution in the mixed Ni–Fe perovskite oxides primarily increases the nominal Fe oxidation state.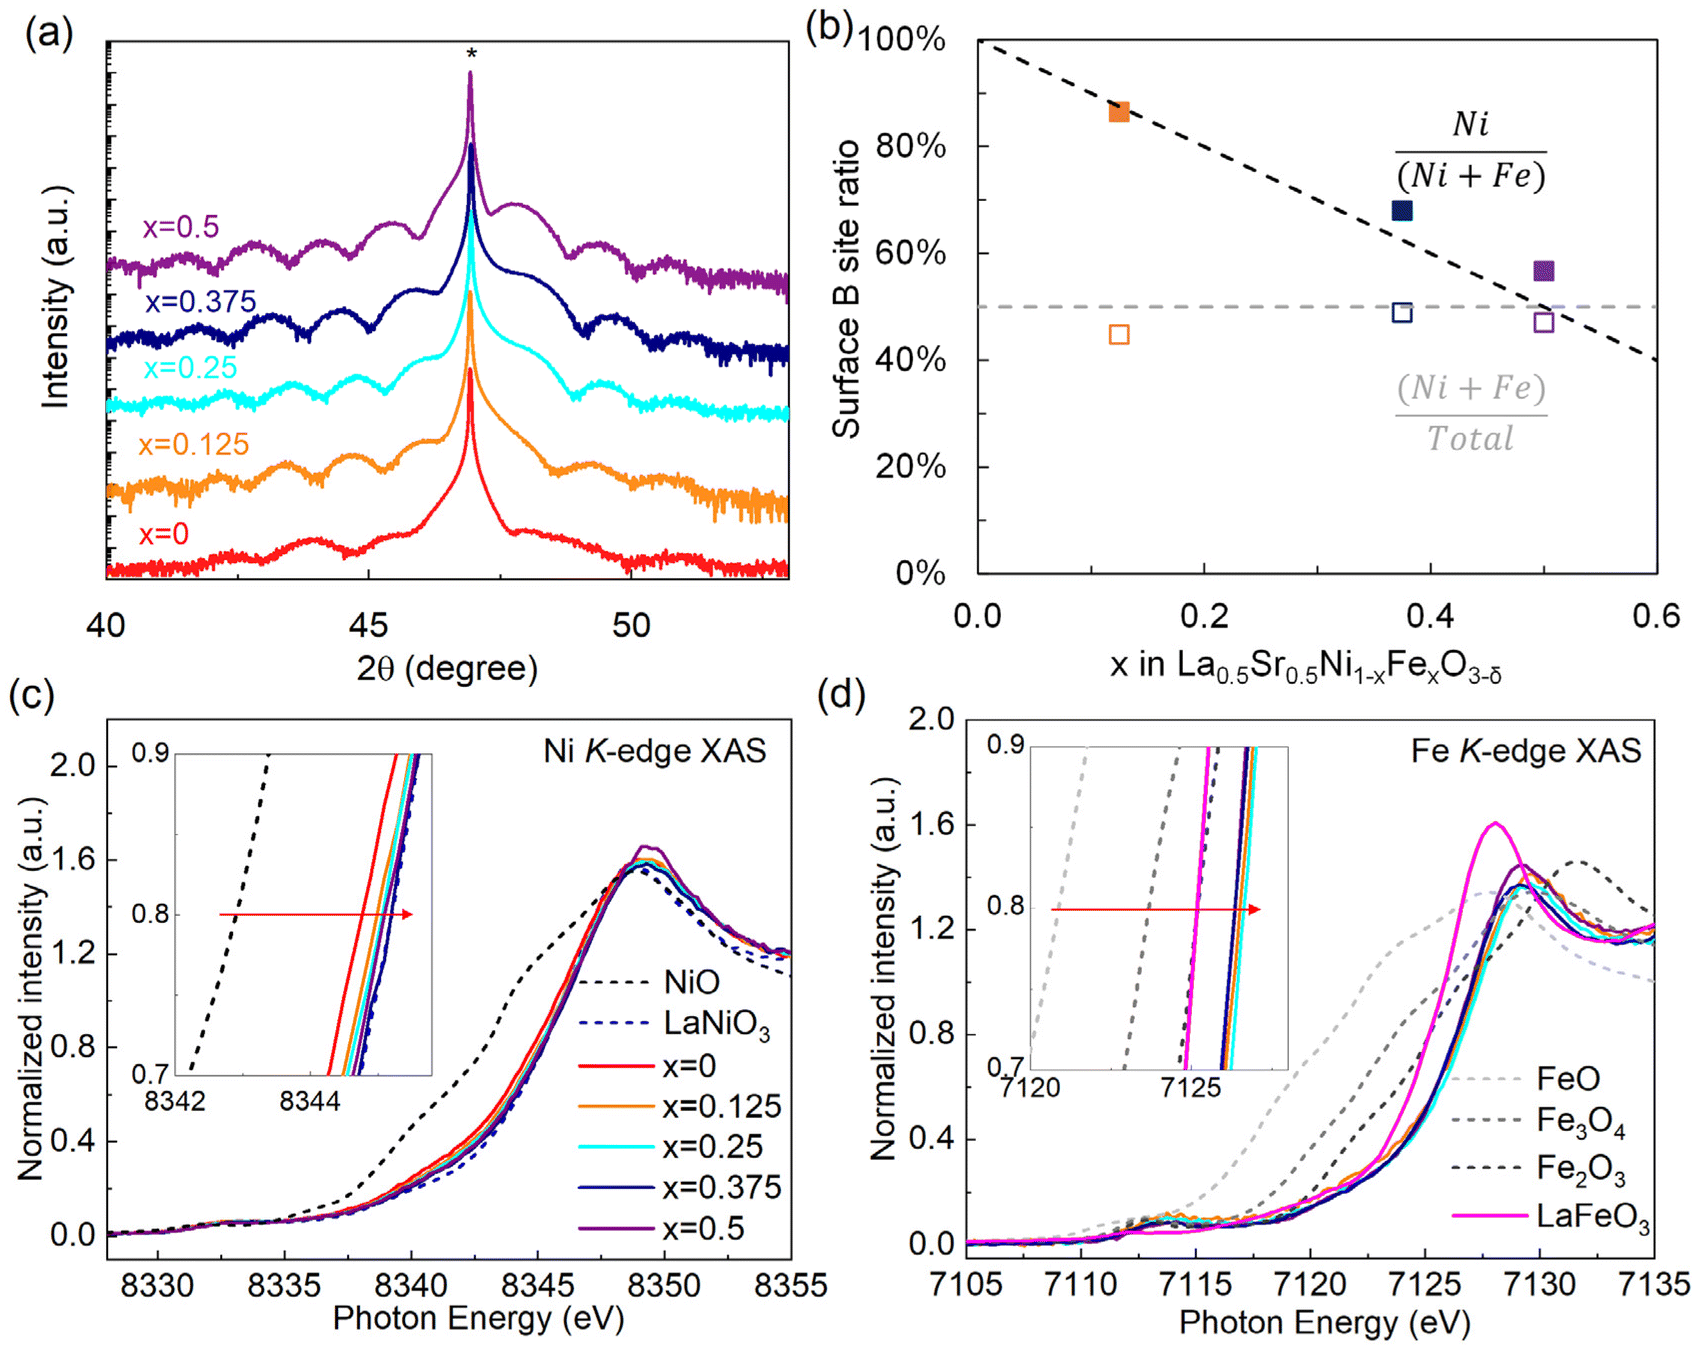 | ||
| Fig. 1 Structural characterization and XANES spectra at the K-edge for LSNFO epitaxial thin films. (a) High-resolution XRD θ–2θ scans show high film quality. (b) XPS composition ratios of Ni to total B (Fe + Ni) sites (solid markers) and total B sites to total metal (La + Sr + Fe + Ni) sites (hollow markers) show the decrease in surface Ni sites as expected (dashed black trendline) with increasing x and comparable B sites to total elemental sites (dashed grey trendline) across x. (c) Ni K-edge XAS. (d) Fe K-edge XAS. | ||
OER activity assessment
We next investigate the impact of dual-site doping of LSNFO electrocatalysts on the OER activities in 0.1 M KOH solution by cyclic voltammetry (CV, Fig. 2 and Fig. S2†). Similar to LSNO with 50% Sr content,12 the OER activity of LSNFO increases with cycling. To better understand the link between electrochemical potential and time in driving these changes, we compare the OER activity measured by CVs across the potential profile shown schematically in Fig. 2a. Fig. 2b shows the Ni redox features for x = 0.375 under CV-1, CV-2 and CV-3 cycling conditions, where Ni redox generally shifts to higher potentials or remains similar but increasing in total charge. For CV-3, comparing electrodes with different Fe compositions (Fig. 2c), we see distinct differences in the Ni redox features, especially for x = 0.375 and x = 0.5 where a second Ni reduction feature at ∼1.37 V vs. RHE is observed.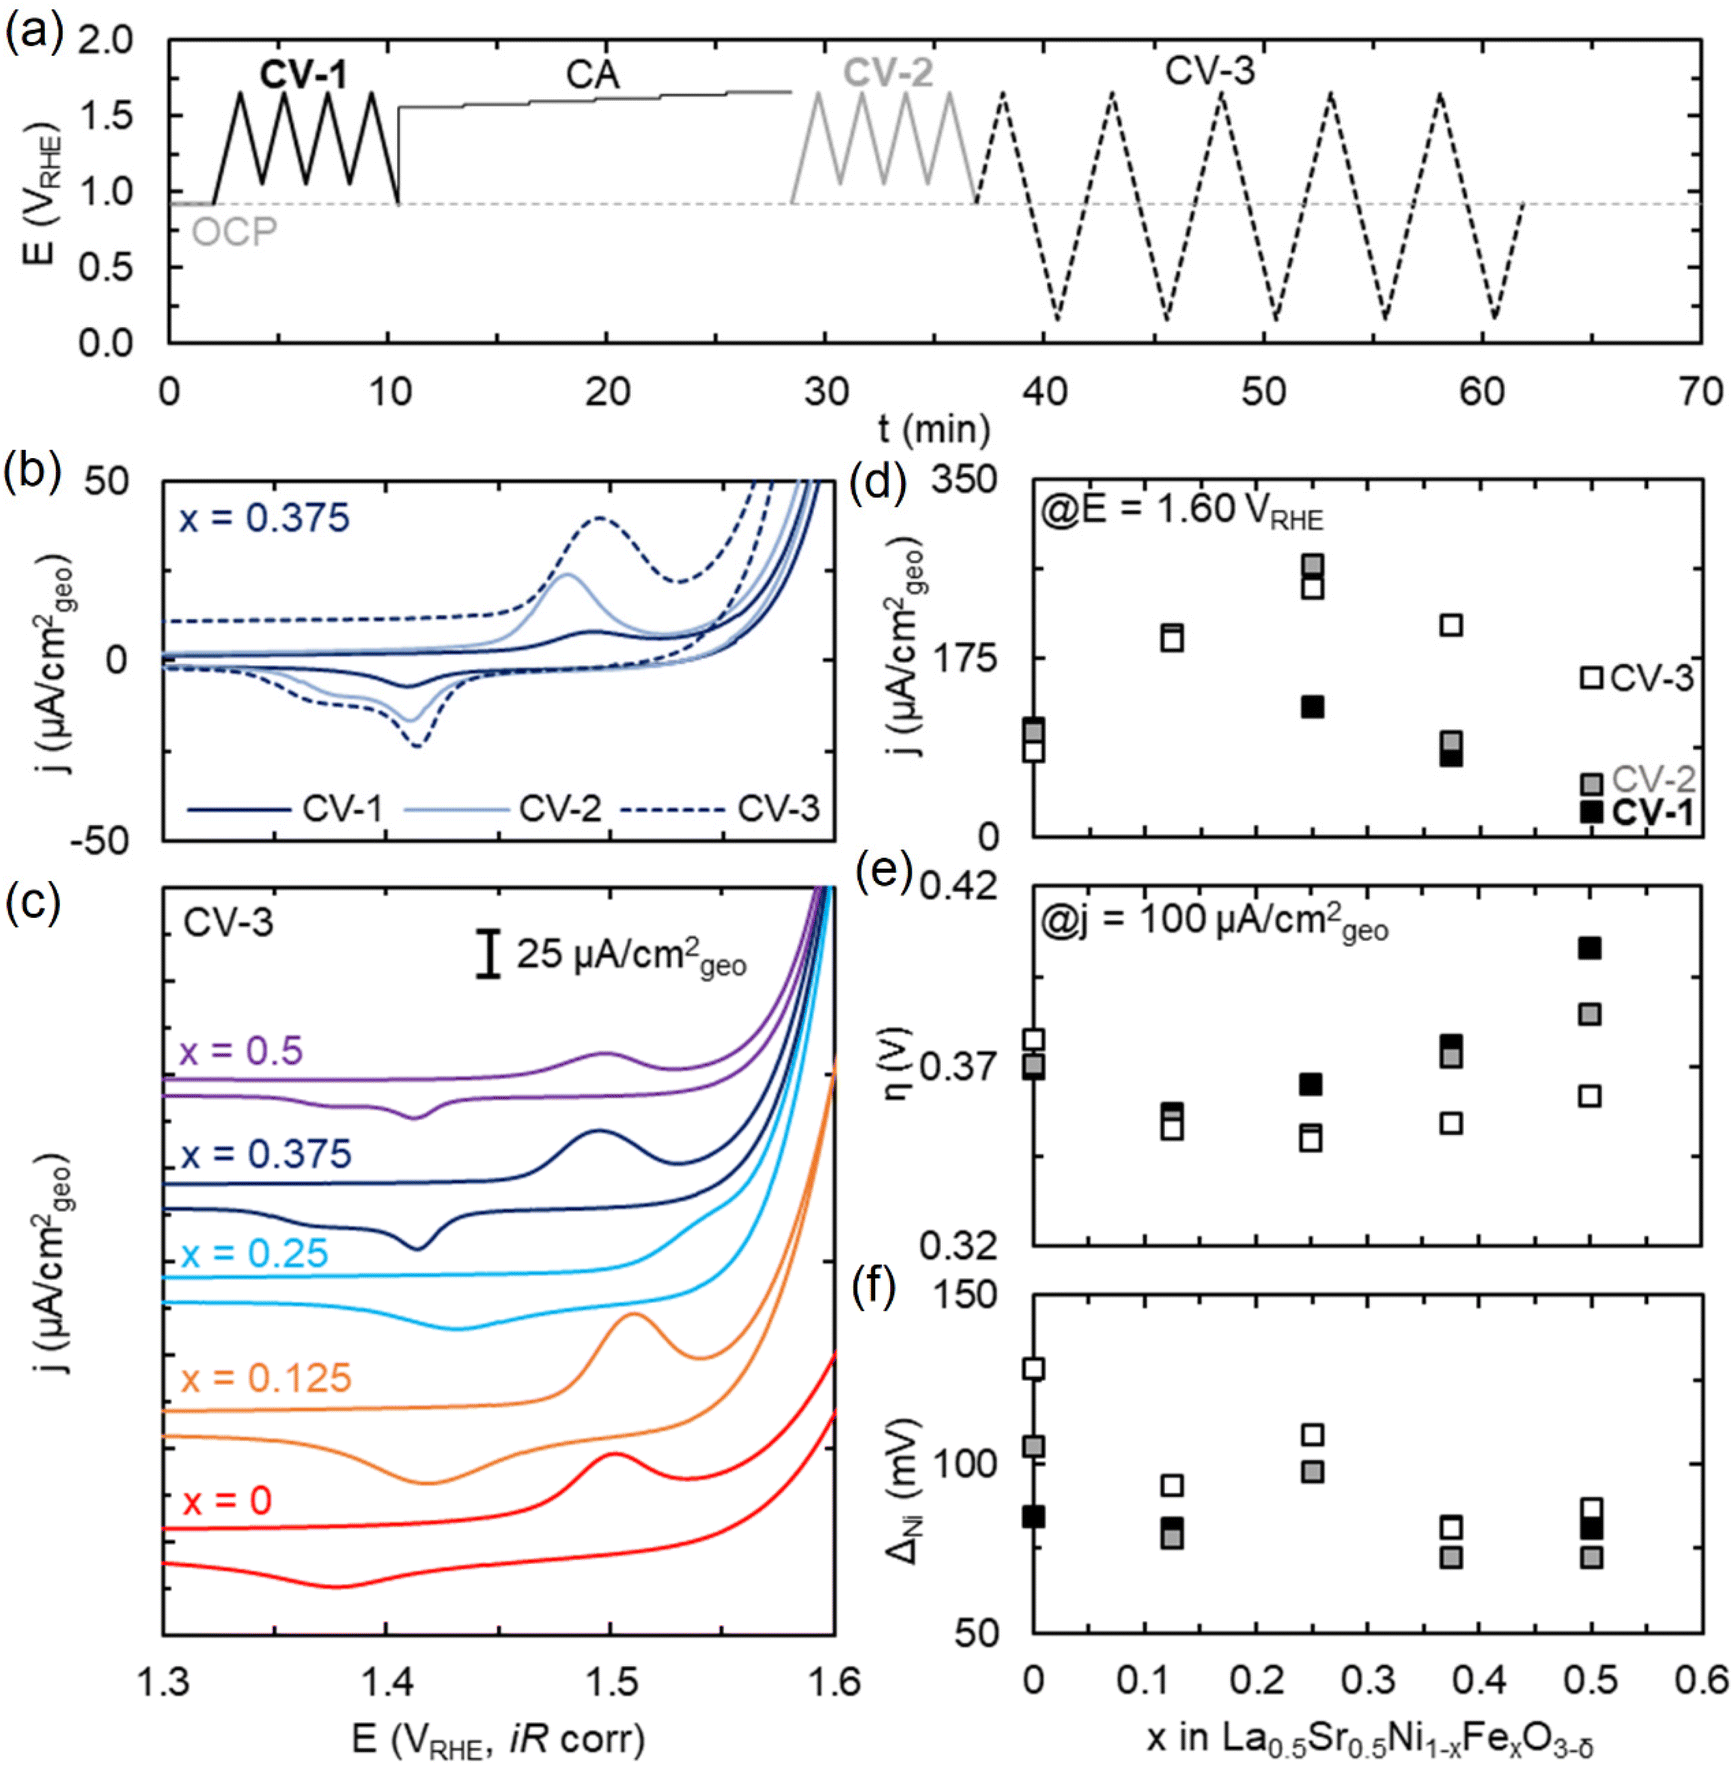 | ||
| Fig. 2 Electrochemical measurements of LSNFO epitaxial films. (a) Experimental protocol showing working electrode potential on the RHE scale as a function of time (t). (b) Cyclic voltammetry (CV) at 10 mV s−1 as a function of electrochemical cycling window (CV-1, 2, 3) for x = 0.375 shows differences in Ni redox position and an evolving secondary Ni reduction peak. (c) CV-3 for the 2nd cycle across Fe compositions from 0 to 0.5 shows changing Ni redox feature and position. (d) Ni redox peak separation (ΔNi), (e) OER overpotential (η) and (f) current density at 1.60 VRHE for the 2nd cycle of the three CV scans (color coding as per (a)) as a function of Fe content (x) in LSNFO. | ||
Upon initial cycling (CV-1), OER activity is maximum for x = 0.125, quantified by either the highest current density (j) at 1.6 V vs. RHE (Fig. 2d) or the lowest overpotential (η) to achieve a current density of 100 μA cm−2 (Fig. 2e). The current density at 1.6 V vs. RHE for x = 0.125 is five times higher than that of LaNi1−xFexO3 (LNFO) without Sr. We also find that incorporating Sr in LNFO shifts the maximum in OER activity to lower x (maximum at x = 0.375 for LNFO).14 Ni redox features shift to higher anodic potential with increasing x, consistent with the LNFO system and previous reports of Ni–Fe oxide catalysts.14,32,33 In such systems, this shift arises from charge transfer from Fe to Ni, making Ni more difficult to oxidize with increasing Fe content. In addition, the separation between Ni reduction and oxidation is comparable for all films during CV-1 (Fig. 2f), about 82 mV, similar to literature for other Ni–Fe oxides and somewhat larger than the 60 mV typically reported for reversible processes.34,35
Following an initial set of CVs (CV-1) and chronoamperometry (CA), we then repeat a series of CVs over the same potential range (CV-2) to quantify activity and Ni redox. For CV-2, OER activity increases significantly for x = 0.25 while slightly for x = 0.375 and x = 0.5, using either j or η as metrics. Similar trends in OER activity are observed for the preceding CA, with Tafel slopes ranging from ∼78 mV per decade (x = 0) to 49 mV per decade (x = 0.25) (Fig. S3†). For x = 0.25, this is commensurate with the appearance on Ni redox at surprisingly high applied potentials given the small amount of Fe incorporation but at peak spacing comparable to that of x = 0 (and greater than that of CV-1). We note, however, that similarly high Ni redox features have been observed for Ni0.75Fe0.25(OH)2 films.33
To better understand the role of Fe on the surface in OER, we then cycle to potentials low enough to undergo Fe redox (CV-3). As expected, the integrated charge associated with Fe reduction increases with x (Fig. S4†). Cycling to such low potentials results in large increases in activity for films with high Fe content (x = 0.375, 0.5). This is generally accompanied by an increase in Ni redox peak separation, suggesting changes in surface composition/structure and resultant properties. Furthermore, for films of x = 0.375 and greater, the Ni-reduction transforms from one to two distinct features starting in CV-2. This further suggests surface changes resultant from cycling, and surface changes are likely linked to the observed increase in OER activity. Similar split-reduction peaks have been observed in Fe-NiOxHy catalysts34 and attributed to inhomogeneous distribution of Fe, particularly around the ∼25% solubility limit of Fe in NiOOH.36
Assessing changes to the electrode surface
Electrochemical cycling may impact (i) available surface area (film roughness), (ii) surface composition, and/or (iii) surface structure, all of which would be expected to impact OER activity. To assess possible changes in surface roughness, we estimated the double layer capacitance (normalized to the electrode geometric area)37 across the three CV windows (Fig. 3a). We observed a marginal increase in the double layer capacitance between CV-1 and CV-2. Upon sweeping the potentials into the Fe redox potentials (CV-3), a significant increase by ∼two times in the double layer capacitance is observed across all Fe compositions.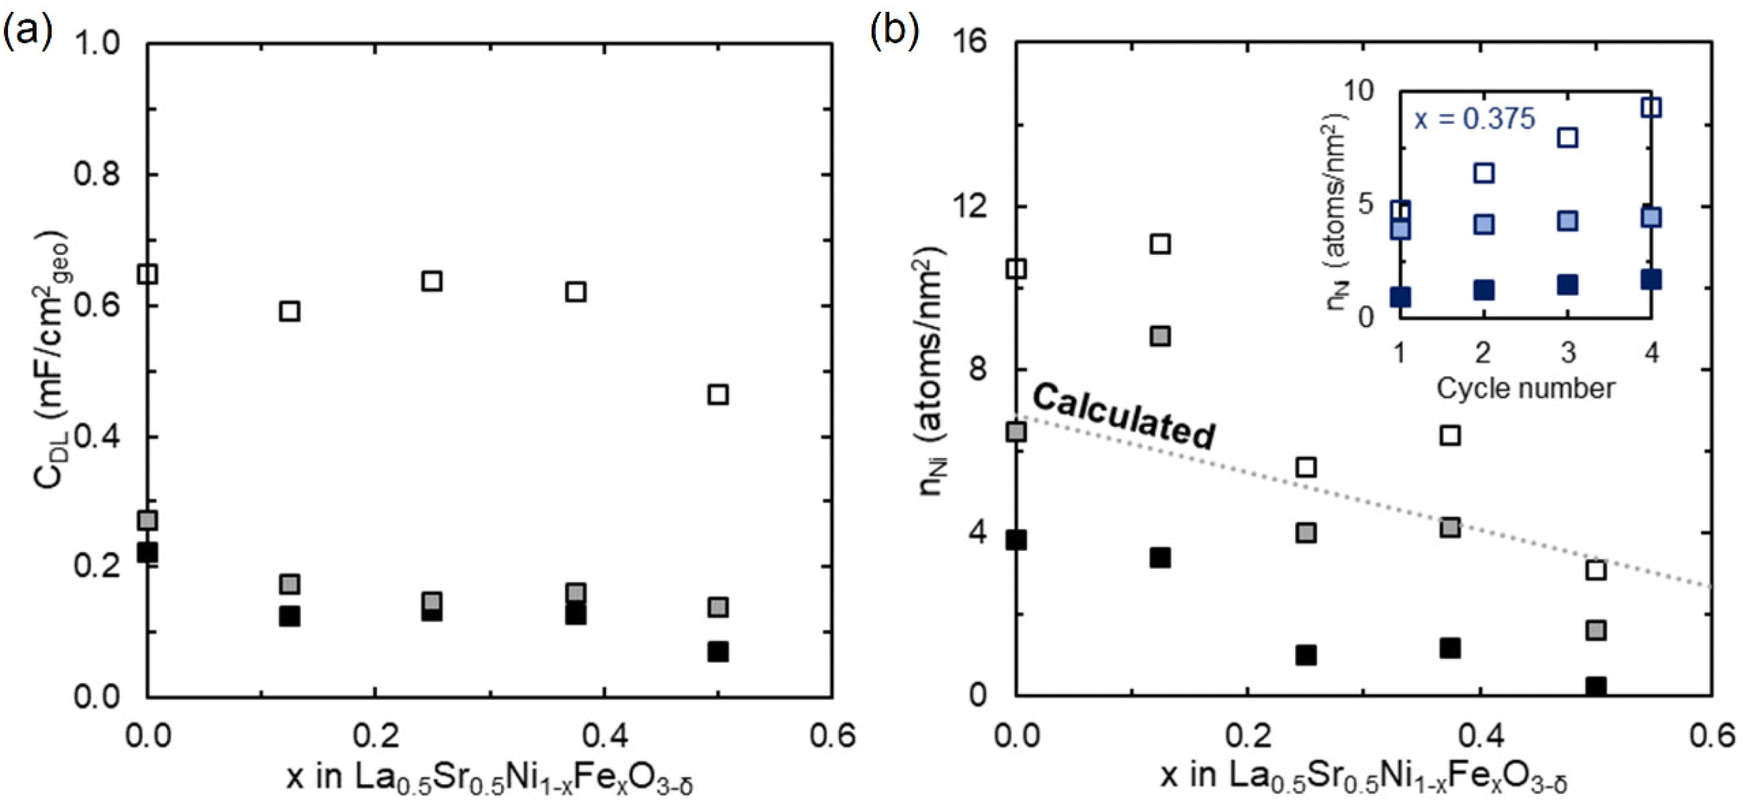 | ||
| Fig. 3 Changes in LSNFO double layer capacitance and surface Ni composition with cycling. (a) Double layer capacitance (CDL) normalized by the geometric area as a function of x in La0.5Sr0.5Ni1−xFexO3−δ. (b) Surface Ni atoms (nNi) per geometric nm2 (obtained from Ni redox charge, see ESI†) as a function of x in La0.5Sr0.5Ni1−xFexO3−δ. The inset shows surface Ni atoms per geometric nm2 for x = 0.375 as a function of cycle number, where shade decreases from CV-1 to CV-3. | ||
To assess whether this increase in capacitance is also commensurate with exposure of more OER active sites, we next consider the integrated charge of Ni redox (Fig. 3b), converted to an exposed number of Ni atoms per nm2, n, using the perovskite unit cell and assuming redox corresponds to 1e− transfer.33 We note others have classified this redox process as involving up to 1.6e−,38 which would result in our numbers overestimating the atomic density of Ni atoms on the surface. In CV-1, Ni surface content trends as expected with Fe incorporation, but is ∼1/2 that expected from the unit cell size (assuming complete BO2 termination of the (001) orientation) and target stoichiometry. This thus may originate from some persistence of AO termination at the surface. In CV-2, surface Ni content increases to approximately that expected based on stoichiometry for complete BO2-layer termination, consistent with AO terminations dissolving during OER in highly alkaline media. Despite this ∼2 fold increase in Ni redox current between CV-1 and CV-2, there is substantial change in OER current only for x = 0.25, suggesting the local arrangement of active sites, or number of exposed Fe sites, is most critical in driving activity. Upon sweeping into the Fe redox region (CV-3), surface Ni content further increases (Fig. 3b). For films with low Fe contents, the surface Ni content increases beyond that expected for a smooth film (assuming 1e−/Ni during redox), indicating an increase in surface roughness or electrolyte permeability, commensurate with AFM and the large increase in capacitance. As a function of cycle number in CV-3 (inset in Fig. 3b), Ni redox increases while Fe redox decreases (Fig. S4†), suggesting an evolution of surface composition during CV-3 cycling as well. A slight enhancement in OER activity is also observed as a function of cycle number in CV-3.
In order to directly assess changes in surface structure and composition, we characterized the x = 0.375 sample before (pristine) and after electrochemical cycling. XRD θ–2θ scans (Fig. 4a) show the diffraction peak of the LSNFO film shifts from the right side to the left side of the substrate's diffraction peak after cycling, indicating a larger lattice parameter. The disappearance of the thickness fringes suggests that the lattice structure becomes non-uniform after cycling. Atomic force microscopy (AFM) scans (Fig. S5†) indicate that surface morphology changes from relatively flat to uneven and the arithmetic mean roughness (Ra) increases from 0.2 to ∼1.1 nm after cycling. Cross-sectional scanning transmission electron microscopy (STEM) images (Fig. 4b) reveal that the surface is smooth for the pristine sample, while top 2 u.c. layer of the x = 0.375 sample becomes structurally amorphous after cycling. Energy dispersive X-ray spectroscopy (EDS) maps show that the pristine sample is mostly uniform in composition, but some regions of Ni segregation are also observed. After OER testing, more regions of Ni segregation are apparent, which may be related to the multiple Ni reduction peaks evident in later OER cycling. Fig. 4c shows the comparison of O 1s, Sr 3d, La 4d and Ni 3p & Fe 3p XPS core level spectra before and after cycling. To compare the spectra quantitively, we multiply all core level spectral intensities of the sample after cycling by 2.15 times to achieve a good overlap of Fe 2p spectra with that of the pristine sample. After cycling, the Ni 3p region is relatively more intense compared to the Fe 3p, suggesting that the Ni content on the surface increases after OER in agreement with electrochemical measurements. In addition, a distinct high binding energy shoulder is also observed on the Ni 3p spectrum after cycling, and shift of spectral weight to higher binding energies. Such changes in XPS could be due to Ni segregation at the surface region (Fig. 4b), and others have calculated a Ni oxyhydroxide-like surface on LNO after cycling, observing similar Ni 3p lineshapes.25 Moreover, the decrease in Sr/La area ratio by XPS after cycling indicates Sr-leaching occurs during OER, which is common in Sr-based perovskite oxides,23 and the width change of the La 4d spectrum after cycling suggests appreciable hydroxide character at the surface.39 The O 1s shows a greater presence of adsorbed surface species after cycling, such as hydroxide, carbonate, and water.40–42
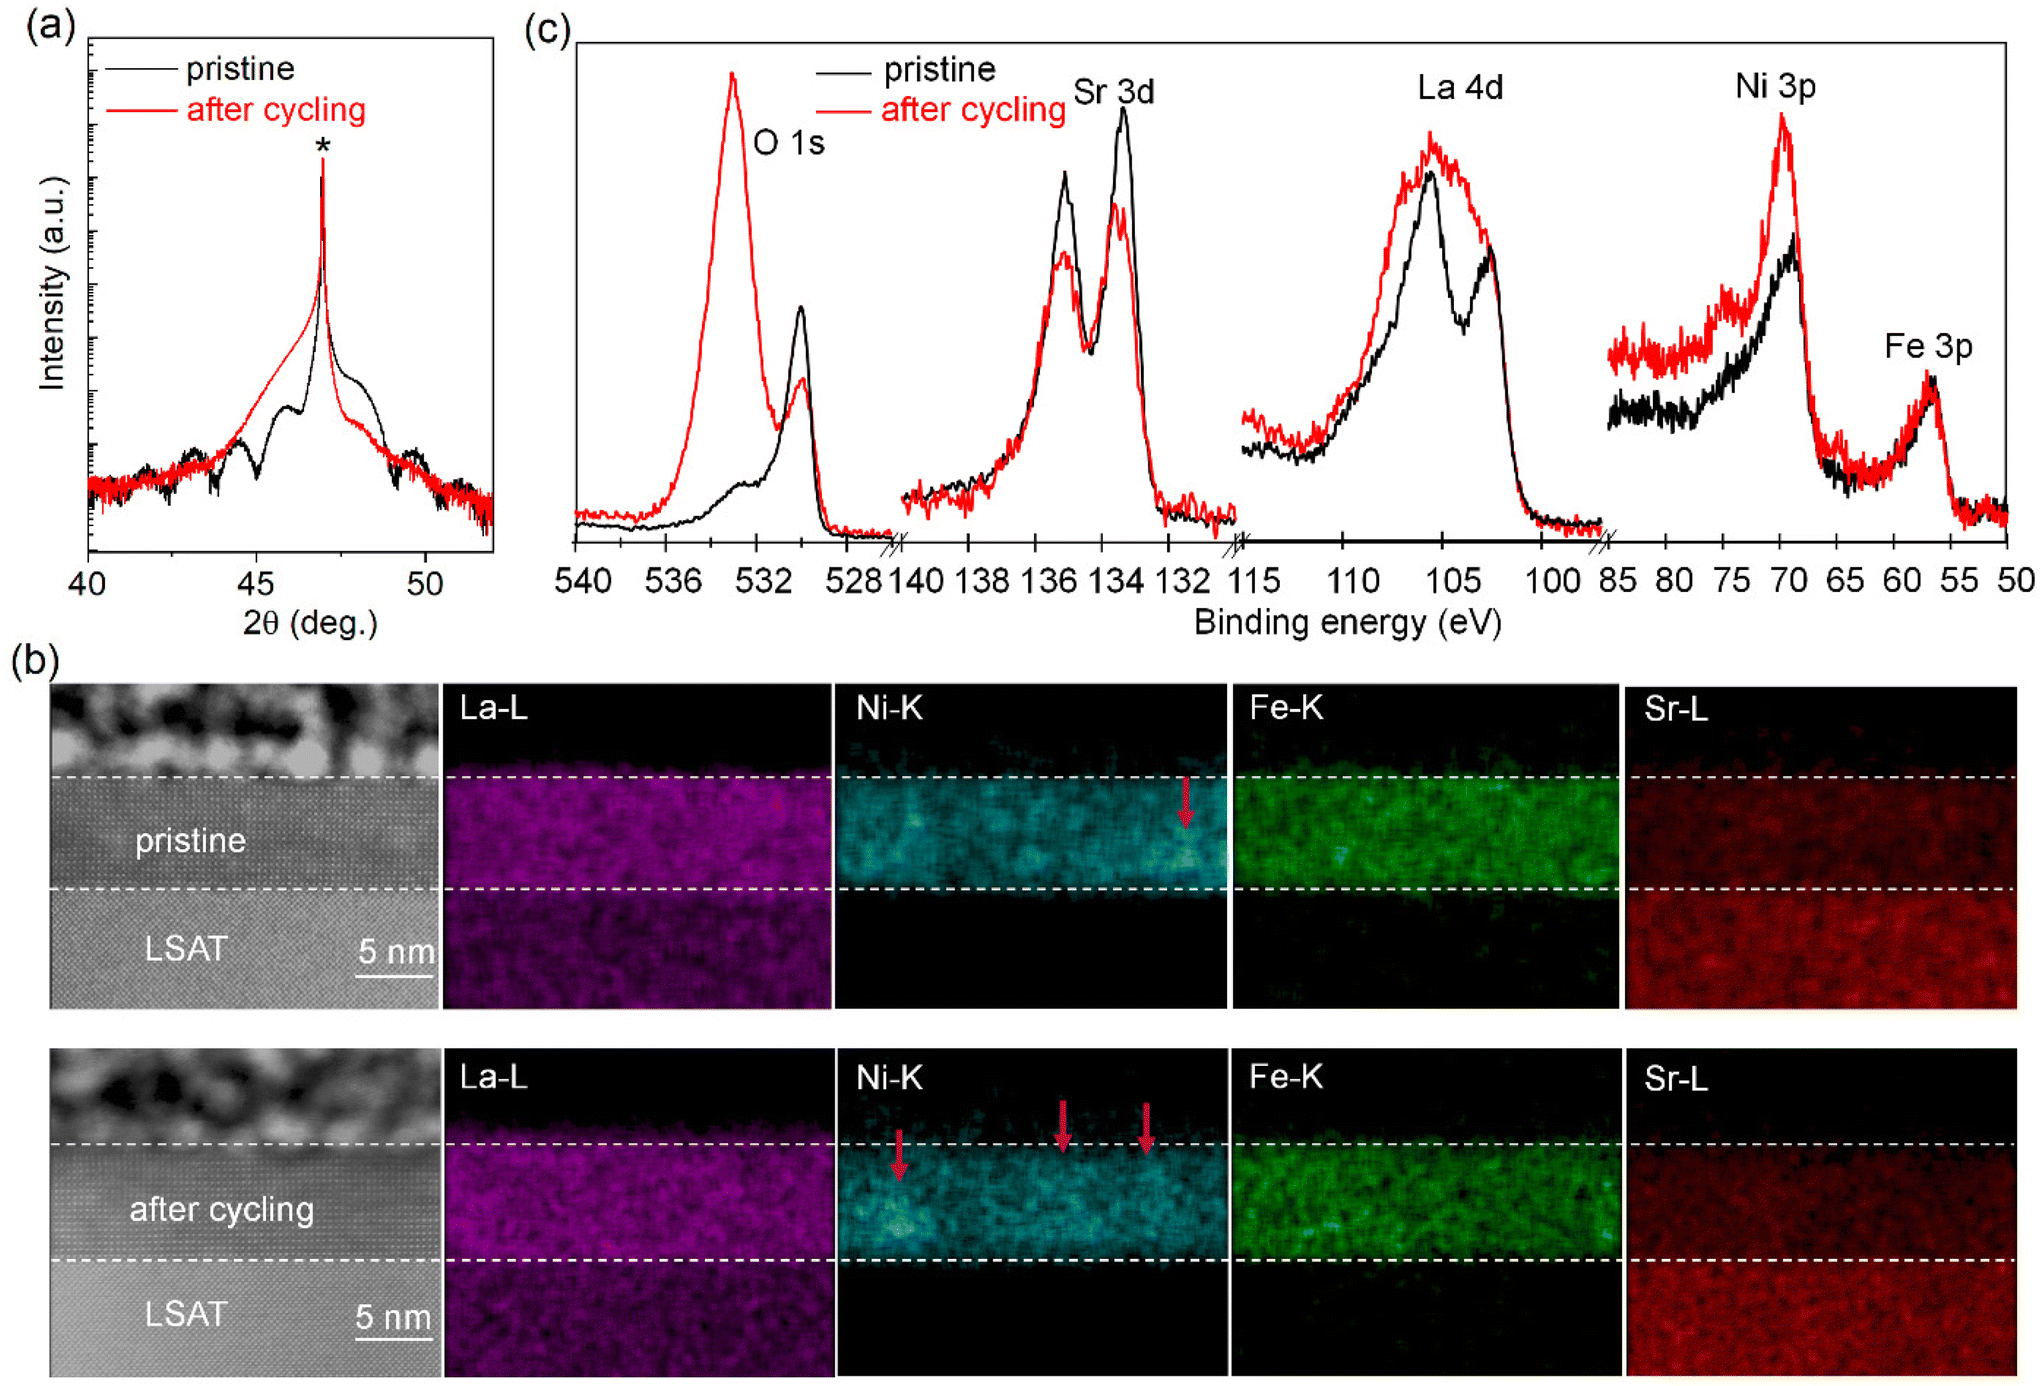 | ||
| Fig. 4 XRD, STEM, EDS mapping, and XPS. (a) XRD θ–2θ scans around the (002) diffraction peak, (b) cross-sectional STEM images and EDS maps, and (c) comparison of O 1s, Sr 3d, La 4d, and Ni 3p & Fe 3p XPS core level spectra for the LSNFO (x = 0.375) film before (pristine) and after cycling. For comparison, all core level spectra intensity of the sample after cycling are multiplied by 2.15 times. The LSAT substrate peaks are marked with “*” in (a). White dashed lines and red arrows in (b) denote the interfaces of the pristine samples and the Ni segregation regions, respectively. | ||
Implications on design of OER catalysts
Sr2+ substitution for La3+ in La-based perovskite oxides has broadly been reported to enhance transition metal 3d – O 2p covalency,12,42,43 boosting OER activity.14 With substitution in a mixed Ni–Fe perovskite film, we observe that only Fe is oxidized (Fig. 1c and d), although the shift in Ni redox with Fe incorporation suggests that Ni at the surface indeed becomes harder to oxidize with Fe incorporation, similar to the case of LNFO14 and other Ni–Fe oxides.32,33 Compared to LNFO,14 Sr-substitution in LNFO shifts the maximum OER activity to lower Fe contents (x = 0.25 vs. x = 0.375 for LNFO) but with similar maximum current density (∼0.21 mA cm−2 at 1.6 V vs. RHE) for each optimum composition.Considering changes in Ni redox with cycling, the incorporation of Sr appears to promote surface restructuring with cycling, evident by the decrease in Sr/La ratio by XPS and depletion of Sr at the surface in STEM EDS after cycling. Roughness in AFM after cycling is consistent with such restructuring, commensurate with the appearance of split Ni reduction features for x = 0.375 and greater, suggesting local composition variation for Fe contents exceeding the solubility limit in a possible NiOOH surface phase. Similar split-reduction peaks have been observed in Fe-NiOxHy catalysts34 and attributed to inhomogeneous distribution of Fe, particularly around the ∼25% solubility limit of Fe in NiOOH.36 Here we observe a ∼2 u.c. amorphous layer for an LSNFO film after 15 cycles in addition to chronoamperometry. This suggests that the surface of LSNFO films may in time draw many parallels to the Ni–Fe hydroxide films broadly studied for OER as well, which similarly show maximum activity for ∼25% Fe.36 Our findings also indicate that covalency of Fe–O sites are critical to enhancing OER activity—as bulk trends in Ni oxidation state or surface assessment of available Ni sites are not reflected in activity. The local environment of these active Fe sites may change notably during measurement, in particular when bulk Fe is present in the material and may redistribute/deposit with cycling. This study illustrates that although the underlying bulk materials template does impact OER activity, designing and controlling the active phase requires detailed understanding of surface restructuring during OER conditions, here borne out through systematic study of epitaxial thin films.
Conclusion
In this study, we report the electrocatalytic OER activity of La0.5Sr0.5Ni1−xFexO3−δ epitaxial thin films (x = 0–0.5) and show activity depends not only on bulk Fe content but also on the extent and window of electrochemical cycling. In comparison to previous work on LaNi1−xFexO3, where Fe was oxidized at the expense of Ni reduction, Sr-incorporation results in Fe oxidation and generally maintains nominal Ni3+ character. Despite these trends in bulk chemistry, electrochemical potentials of Ni oxidation are still influenced by the local presence of Fe, suggesting a dynamic interplay at the surface under OER conditions. Sr incorporation promotes surface restructuring (confirmed using STEM), leading to an amorphous surface layer depleted of Sr. Electrochemical cycling suggests rearrangement at the surface via increasing Ni redox charge, however this is not directly mirrored in OER activity. Instead, excursion to Fe reduction potentials leads to the largest increase in activity for select compositions, suggesting Fe–O covalency is more likely the origin of increased activity for x = 0.25. These findings suggest that although bulk composition can provide a template for understanding activity trends, the intrinsic activity of covalent perovskites with alkaline-earth A-sites is highly dependent on electrochemical cycling conditions due to the dynamic nature of surface composition.Experimental methods
Sample growth and characterization
All epitaxial thin films of La0.5Sr0.5Ni1−xFexO3−δ (LSNFO) solid solutions (x = 0, 0.125, 0.25, 0.375, 0.5) were grown on (001)-oriented LSAT substrates by OPA-MBE. Experimental setup and growth conditions can be found in ref. 14. In situ XPS was performed on all pristine samples to measures the elemental composition.Additional XPS at ambient pressure (AP-XPS) was performed at the advanced light source beamline 9.3.2 using an incident photon energy that was calibrated to Au 4f reference. The film surface was cleaned by heating to 300 °C in 100 mTorr O2, and the surface was deemed clean with the disappearance of C 1s feature. Ni 3p and Fe 3p along with La 4d and Sr 3d spectra were collected at 300 °C in 100 mTorr O2 background at an incident photon energy of 350 eV, corresponding to a shallow inelastic mean free path (IMFP ∼0.87 nm). The peaks were fitted with a Shirley background and a Gaussian/Lorentzian (GL30) function except for Ni 3p which was fitted with GL30 modified by an exponential blend (T0.85).
Atomic force microscopy (AFM) was used to examine film surface morphology. The lattice structure was characterized by a high-resolution X-ray diffractometer (Rigaku SmartLab). Cross-sectional STEM samples were prepared using a FEI Helios NanoLab dual-beam focused ion beam (FIB) microscope and a standard lift out procedure along the [100] zone axis of the LSAT substrates. STEM high-angle annular dark-field (STEM-HAADF) images were collected on a probe-corrected JEOL GrandARM-300F microscope operating at 300 kV, with a convergence semi-angle of 29.7 mrad. Simultaneous energy-dispersive X-ray spectroscopy (STEM-EDS) mapping was performed to collect composition information from all alloying elements.
Ni K-edge and Fe K-edge X-ray absorption near-edge structure (XANES) spectra were measured at beamline 9-BM of the advanced photon source at Argonne National Laboratory. X-ray energy was varied by a Si(111) double crystal monochromator and fluorescent X-rays were collected by a four element silicon drift detector. A rhodium coated toroidal mirror was used to focus the X-rays to roughly 0.5 mm in diameter, and a rhodium coated flat mirror was used for harmonic rejection.
After cycling, samples were ultrasonicated in acetone, IPA, and finally DI water for 5 min each to remove dust particles and any remaining salt from the electrolyte. Samples were dried using nitrogen gas, and characterized first by XPS, then AFM.
Electrochemical methods
Electrochemical measurements in a 50 mL Teflon® cell were conducted with a VSP-300 Biologic® potentiostat and Pine® modulated speed rotator (MSR) at room temperature and ambient pressure. A standard three-electrode setup comprised of an assortment of LSNFO working electrodes (where x = 0, 0.125, 0.25, 0.375, 0.50), a Pt counter, and an Ag/AgCl reference electrode. The Ag/AgCl reference was calibrated to the RHE in 0.1 M KOH, with all potentials provided in the text reported on the RHE scale. The working electrode was loaded onto a glassy carbon, electrically contacted with a double-sided copper tape, and covered with Kapton tape, exposing a known cross-sectional area of the electrode to the electrolyte.44 The electrolyte solution of 0.1 M KOH was prepared in bulk using semiconductor grade KOH (Sigma-Aldrich) and 18.2 MΩ Millipore water. Electrochemical measurements were performed in O2 saturated conditions, with scan rates for all CVs being 10 mV s−1. The double layer capacitance (CDL) was measured in a non-faradaic region averaging across the three cycles, extracting the capacitance through the linear relation between current and scan rate.Author contributions
P. A. investigation, writing – original draft, writing – review & editing, L. W. investigation, writing – original draft, writing – review & editing, conceptualization, C. W. investigation, B. E. M. investigation, M. E. B. investigation, S. R. S. investigation, G. E. S. investigation, M. B. investigation, M.-J. C. investigation, J. T. supervision, T. C. K. investigation, S. A. C. supervision, funding acquisition, K. A. S. supervision, writing – review & editing, conceptualization, funding acquisition, Y. D. supervision, writing – review & editing, funding acquisition.Conflicts of interest
There are no conflicts to declare.Acknowledgements
Synthesis of epitaxial thin films, X-ray diffraction, XPS, XAS, AFM, and STEM were supported by US DOE BES Materials Science and Engineering Division under award no. 10122. OER studies, additional AFM, and AP-XPS were supported by the National Science Foundation under grant no. 2041153. P. A. acknowledges support from the Link Foundation Energy Fellowship. K. A. S. acknowledges support from Oregon State University as a Callahan Faculty Scholar. Part of this research (AFM) was conducted at Oregon Process Innovation Center, part of the Northwest Nanotechnology Infrastructure, a National Nanotechnology Coordinated Infrastructure site at Oregon State University which is supported in part by the National Science Foundation (grant NNCI-2025489) and Oregon State University. This research used resources of the Advanced Light Source, a US DOE Office of Science User Facility under contract no. DE-AC02-05CH11231. We acknowledge facility support from W. R. Wiley Environmental Molecular Sciences Laboratory, a DOE User Facility sponsored by the Office of Biological and Environmental Research. Ni K-edge and Fe K-edge XAS measurements were carried out at beamline 9-BM of the Advanced Photon Source, a US DOE Office of Science User Facility operated by Argonne National Laboratory under contract DE-AC02-06CH11357. The microscopy work was performed in the Radiological Microscopy Suite (RMS), located in the Radiochemical Processing Laboratory (RPL) at PNNL.References
- E. Fabbri, A. Habereder, K. Waltar, R. Kötz and T. J. Schmidt, Catal. Sci. Technol., 2014, 4, 3800–3821 RSC.
- J. Song, C. Wei, Z.-F. Huang, C. Liu, L. Zeng, X. Wang and Z. J. Xu, Chem. Soc. Rev., 2020, 49, 2196–2214 RSC.
- J. Suntivich, K. J. May, H. A. Gasteiger, J. B. Goodenough and Y. Shao-Horn, Science, 2011, 334, 1383–1385 CrossRef PubMed.
- X. Cheng, E. Fabbri, Y. Yamashita, I. E. Castelli, B. Kim, M. Uchida, R. Haumont, I. Puente-Orench and T. J. Schmidt, ACS Catal., 2018, 8, 9567–9578 CrossRef.
- J. Hwang, R. R. Rao, L. Giordano, Y. Katayama, Y. Yu and Y. Shao-Horn, Science, 2017, 358, 751–756 CrossRef.
- D. Liu, P. Zhou, H. Bai, H. Ai, X. Du, M. Chen, D. Liu, W. F. Ip, K. H. Lo, C. T. Kwok, S. Chen, S. Wang, G. Xing, X. Wang and H. Pan, Small, 2021, 17, 2101605 CrossRef.
- F. Dionigi, T. Reier, Z. Pawolek, M. Gliech and P. Strasser, ChemSusChem, 2016, 9, 962–972 CrossRef PubMed.
- B.-J. Kim, E. Fabbri, M. Borlaf, D. F. Abbott, I. E. Castelli, M. Nachtegaal, T. Graule and T. J. Schmidt, Mater. Adv., 2021, 2, 345–355 RSC.
- Q. Guo, X. Li, H. Wei, Y. Liu, L. Li, X. Yang, X. Zhang, H. Liu and Z. Lu, Front. Chem., 2019, 7, 224 CrossRef PubMed.
- R. Sankannavar, K. C. Sandeep, S. Kamath, A. K. Suresh and A. Sarkar, J. Electrochem. Soc., 2018, 165, J3236–J3245 CrossRef.
- L. Wang, K. A. Stoerzinger, L. Chang, J. Zhao, Y. Li, C. S. Tang, X. Yin, M. E. Bowden, Z. Yang, H. Guo, L. You, R. Guo, J. Wang, K. Ibrahim, J. Chen, A. Rusydi, J. Wang, S. A. Chambers and Y. Du, Adv. Funct. Mater., 2018, 28, 1803712 CrossRef.
- J. Liu, E. Jia, L. Wang, K. A. Stoerzinger, H. Zhou, C. S. Tang, X. Yin, X. He, E. Bousquet, M. E. Bowden, A. T. S. Wee, S. A. Chambers and Y. Du, Adv. Sci., 2019, 6, 1901073 CrossRef.
- J. Bak, H. Bin Bae and S.-Y. Chung, Nat. Commun., 2019, 10, 2713 CrossRef.
- L. Wang, P. Adiga, J. Zhao, W. S. Samarakoon, K. A. Stoerzinger, S. R. Spurgeon, B. E. Matthews, M. E. Bowden, P. V. Sushko, T. C. Kaspar, G. E. Sterbinsky, S. M. Heald, H. Wang, L. W. Wangoh, J. Wu, E.-J. Guo, H. Qian, J. Wang, T. Varga, S. Thevuthasan, Z. Feng, W. Yang, Y. Du and S. A. Chambers, Nano Lett., 2021, 21, 8324–8331 CrossRef PubMed.
- T. G. Yun, Y. Heo, H. Bin Bae and S.-Y. Chung, Nat. Commun., 2021, 12, 824 CrossRef.
- G. Fu, W. Li, J.-Y. Zhang, M. Li, C. Li, N. Li, Q. He, S. Xi, D. Qi, J. L. MacManus-Driscoll, J. Cheng and K. H. Zhang, Small, 2021, 17, 2006930 CrossRef.
- J. S. Yoo, X. Rong, Y. Liu and A. M. Kolpak, ACS Catal., 2018, 8, 4628–4636 CrossRef.
- J. Liu, E. Jia, K. A. Stoerzinger, L. Wang, Y. Wang, Z. Yang, D. Shen, M. H. Engelhard, M. E. Bowden, Z. Zhu, S. A. Chambers and Y. Du, J. Phys. Chem. C, 2020, 124, 15386–15390 CrossRef CAS.
- K. J. May, C. E. Carlton, K. A. Stoerzinger, M. Risch, J. Suntivich, Y.-L. Lee, A. Grimaud and Y. Shao-Horn, J. Phys. Chem. Lett., 2012, 3, 3264–3270 CrossRef.
- S. Klaus, Y. Cai, M. W. Louie, L. Trotochaud and A. T. Bell, J. Phys. Chem. C, 2015, 119, 7243–7254 CrossRef.
- I. Spanos, J. Masa, A. Zeradjanin and R. Schlögl, Catal. Lett., 2021, 151, 1843–1856 CrossRef.
- S. Anantharaj, S. Kundu and S. Noda, Nano Energy, 2021, 80, 105514 CrossRef.
- S. Samira, J. Hong, J. C. A. Camayang, K. Sun, A. S. Hoffman, S. R. Bare and E. Nikolla, JACS Au, 2021, 1, 2224–2241 CrossRef.
- E. Fabbri, M. Nachtegaal, T. Binninger, X. Cheng, B.-J. Kim, J. Durst, F. Bozza, T. Graule, R. Schäublin, L. Wiles, M. Pertoso, N. Danilovic, K. E. Ayers and T. J. Schmidt, Nat. Mater., 2017, 16, 925–931 CrossRef.
- C. Baeumer, J. Li, Q. Lu, A. Y.-L. Liang, L. Jin, H. P. Martins, T. Duchoň, M. Glöβ, S. M. Gericke, M. A. Wohlgemuth, M. Giesen, E. E. Penn, R. Dittmann, F. Gunkel, R. Waser, M. Bajdich, S. Nemšák, J. T. Mefford and W. C. Chueh, Nat. Mater., 2021, 20, 674–682 CrossRef CAS PubMed.
- A. S. Disa, D. P. Kumah, J. H. Ngai, E. D. Specht, D. A. Arena, F. J. Walker and C. H. Ahn, APL Mater., 2013, 1, 032110 CrossRef.
- L. Wang, Z. Yang, M. E. Bowden, J. W. Freeland, P. V. Sushko, S. R. Spurgeon, B. Matthews, W. S. Samarakoon, H. Zhou, Z. Feng, M. H. Engelhard, Y. Du and S. A. Chambers, Adv. Mater., 2020, 32, 2005003 CrossRef CAS.
- L. Wang, L. Chang, X. Yin, L. You, J.-L. Zhao, H. Guo, K. Jin, K. Ibrahim, J. Wang, A. Rusydi and J. Wang, Appl. Phys. Lett., 2017, 110, 043504 CrossRef.
- D. Guan, K. Zhang, Z. Hu, X. Wu, J.-L. Chen, C.-W. Pao, Y. Guo, W. Zhou and Z. Shao, Adv. Mater., 2021, 33, 2103392 CrossRef CAS PubMed.
- D. Guan, J. Zhong, H. Xu, Y.-C. Huang, Z. Hu, B. Chen, Y. Zhang, M. Ni, X. Xu, W. Zhou and Z. Shao, Appl. Phys. Rev., 2022, 9, 011422 CAS.
- H. Zhang, Y. Gao, H. Xu, D. Guan, Z. Hu, C. Jing, Y. Sha, Y. Gu, Y.-C. Huang, Y.-C. Chang, C.-W. Pao, X. Xu, J.-F. Lee, Y.-Y. Chin, H.-J. Lin, C.-T. Chen, Y. Chen, Y. Guo, M. Ni, W. Zhou and Z. Shao, Adv. Funct. Mater., 2022, 32, 2207618 CrossRef CAS.
- M. W. Louie and A. T. Bell, J. Am. Chem. Soc., 2013, 135, 12329–12337 CrossRef CAS PubMed.
- L. Trotochaud, S. L. Young, J. K. Ranney and S. W. Boettcher, J. Am. Chem. Soc., 2014, 136, 6744–6753 CrossRef CAS PubMed.
- M. B. Stevens, C. D. M. Trang, L. J. Enman, J. Deng and S. W. Boettcher, J. Am. Chem. Soc., 2017, 139, 11361–11364 CrossRef CAS.
- M. Lyons, L. Russell, M. O'Brien, R. Doyle, I. Godwin and M. Brandon, Int. J. Electrochem. Sci., 2012, 7, 2710–2763 CAS.
- D. Friebel, M. W. Louie, M. Bajdich, K. E. Sanwald, Y. Cai, A. M. Wise, M.-J. Cheng, D. Sokaras, T.-C. Weng, R. Alonso-Mori, R. C. Davis, J. R. Bargar, J. K. Nørskov, A. Nilsson and A. T. Bell, J. Am. Chem. Soc., 2015, 137, 1305–1313 CrossRef CAS.
- C. C. L. McCrory, S. Jung, J. C. Peters and T. F. Jaramillo, J. Am. Chem. Soc., 2013, 135, 16977–16987 CrossRef CAS.
- D. K. Bediako, B. Lassalle-Kaiser, Y. Surendranath, J. Yano, V. K. Yachandra and D. G. Nocera, J. Am. Chem. Soc., 2012, 134, 6801–6809 CrossRef CAS.
- M. L. Weber, G. Lole, A. Kormanyos, A. Schwiers, L. Heymann, F. D. Speck, T. Meyer, R. Dittmann, S. Cherevko, C. Jooss, C. Baeumer and F. Gunkel, J. Am. Chem. Soc., 2022, 144, 17966–17979 CrossRef CAS.
- O. Q. Carvalho, P. Adiga, L. Wang, J. Liu, E. Jia, Y. Du, S. Nemšák and K. A. Stoerzinger, J. Phys. D: Appl. Phys., 2021, 54, 274003 CrossRef CAS.
- K. A. Stoerzinger, R. Comes, S. R. Spurgeon, S. Thevuthasan, K. Ihm, E. J. Crumlin and S. A. Chambers, J. Phys. Chem. Lett., 2017, 8, 1038–1043 CrossRef PubMed.
- K. A. Stoerzinger, L. Wang, Y. Ye, M. Bowden, E. J. Crumlin, Y. Du and S. A. Chambers, J. Mater. Chem. A, 2018, 6, 22170–22178 RSC.
- J. T. Mefford, X. Rong, A. M. Abakumov, W. G. Hardin, S. Dai, A. M. Kolpak, K. P. Johnston and K. J. Stevenson, Nat. Commun., 2016, 7, 11053 CrossRef PubMed.
- P. Adiga and K. A. Stoerzinger, J. Vac. Sci. Technol., A, 2022, 40, 010801 CrossRef.
Footnote |
| † Electronic supplementary information (ESI) available. See DOI: https://doi.org/10.1039/d2nr05373j |
| This journal is © The Royal Society of Chemistry 2023 |