
The impacts of dopants on the small polaron mobility and conductivity in hematite – the role of disorder†
Mingpeng
Chen‡
a,
Andrew C.
Grieder‡
a,
Tyler J.
Smart
bc,
Kiley
Mayford
b,
Samuel
McNair
b,
Anica
Pinongcos
a,
Samuel
Eisenberg
a,
Frank
Bridges
b,
Yat
Li
 a and
Yuan
Ping
*a
a and
Yuan
Ping
*a
aDepartment of Chemistry and Biochemistry, University of California, Santa Cruz, CA 95064, USA. E-mail: yuanping@ucsc.edu
bDepartment of Physics, University of California, Santa Cruz, CA 95064, USA
cLawrence Livermore National Laboratory, Livermore, California 94551, USA
First published on 15th December 2022
Abstract
Hematite (α-Fe2O3) is a promising transition metal oxide for various energy conversion and storage applications due to its advantages of low cost, high abundance, and good chemical stability. However, its low carrier mobility and electrical conductivity have hindered the wide application of hematite-based devices. Fundamentally, this is mainly caused by the formation of small polarons, which show conduction through thermally activated hopping. Atomic doping is one of the most promising approaches for improving the electrical conductivity in hematite. However, its impact on the carrier mobility and electrical conductivity of hematite at the atomic level remains to be illusive. In this work, through a kinetic Monte-Carlo sampling approach for diffusion coefficients combined with carrier concentrations computed under charge neutrality conditions, we obtained the electrical conductivity of the doped hematite. We considered the contributions from individual Fe–O layers, given that the in-plane carrier transport dominates. We then studied how different dopants impact the carrier mobility in hematite using Sn, Ti, and Nb as prototypical examples. We found that the carrier mobility change is closely correlated with the local distortion of Fe–Fe pairs, i.e. the more stretched the Fe–Fe pairs are compared to the pristine systems, the lower the carrier mobility will be. Therefore, elements which limit the distortion of Fe–Fe pair distances from pristine are more desired for higher carrier mobility in hematite. The calculated local structure and pair distribution functions of the doped systems have remarkable agreement with the experimental EXAFS measurements on hematite nanowires, which further validates our first-principles predictions. Our work revealed how dopants impact the carrier mobility and electrical conductivity of hematite and provided practical guidelines to experimentalists on the choice of dopants for the optimal electrical conductivity of hematite and the performance of hematite-based devices.
 Yuan Ping | Yuan Ping received her B.Sc. degree from the University of Science and Technology of China in 2007, Ph.D. from UC Davis in 2013, and materials postdoctoral fellowship at Caltech in 2016. Since then, she had been an assistant professor in chemistry and affiliated professor in physics at UC Santa Cruz and promoted to be an associate professor in 2022. Her research group focuses on developing and employing first-principles many-body theory and open quantum dynamics for materials applications. Ping is a recipient of the Alfred Sloan Research Fellowship and NSF CAREER Award in 2022 and the Air Force YIP award and ACS COMP OpenEye Award in 2021. |
1. Introduction
Hematite (α-Fe2O3) is a promising transition metal oxide in energy conversion and storage applications because of its advantages such as low cost, high abundance, and good chemical stability. Its bandgap of around 2.2 eV also makes it an ideal material for visible light absorption; therefore, it is also widely used for photoelectrochemical (PEC) applications. Theoretically, hematite's solar-to-hydrogen conversion efficiency could possibly reach 12.9%.1 However, the experimentally measured efficiency is far below the theoretical value.2–6 One of the main reasons is its low electrical conductivity due to the formation of small electron polarons (EPs).7 Low EP mobility and concentration lead to low electrical conductivity. Since EP transports through thermally activated hopping, the low mobility is caused by overcoming the energy barrier over 0.1 eV, significantly larger than the thermal energy at room temperature kBT (0.0259 eV). The carrier concentration may be increased by atomic doping as investigated in detail earlier;8 however, the way polaron mobility is affected by doping remains illusive, despite previous studies.9–12 Therefore, understanding how atomic doping changes the carrier mobility and in turn the electrical conductivity is essential and highly desired to boost the performance of hematite-based devices.Several experimental and theoretical studies have been performed on the effect of atomic doping on the carrier mobility and electrical conductivity of hematite.9–12 Experimentally, Tian et al. synthesized Sn-doped hematite and suggested that Sn doping could decrease the energy barrier of EP hopping significantly.9 However, the referenced pristine hematite hopping barrier (0.52–0.70 eV) is much higher than previously reported experimental and theoretical values (0.11–0.20 eV), and using the latter reference values would lead to the opposite conclusion.13–17 Past theoretical studies have made significant progress in understanding doping effects on the hopping mobility; however, technical challenges remain. For example, Liao et al. studied Ti, Si, Zr, and Ge doping effects on polaron hopping in hematite from first-principles but mainly considered the first EP hop without considering the subsequent EP hoppings with different barriers. This could not provide statistically averaged macroscopic properties for experimental comparison.10 On the other hand, Kerisit et al. employed a kinetic Monte-Carlo sampling method for macroscopically-averaged EP transport properties in doped hematite (Ti, Ca, and Al); however, the empirical potential was employed for dopant–polaron and polaron–polaron interactions, where the quantitative accuracy is difficult to evaluate.11
Recent works by Zhou et al. used ab initio molecular dynamics to study the EP hopping in Si-doped hematite which in principle captures more accurately the dopant–polaron interactions at the adiabatic limit. However, macroscopic properties such as carrier mobility and carrier concentrations were not reported. Conclusions are still difficult to draw when compared with experiments. Besides methodology challenges in past theoretical studies, there is still critical controversy on how atomic doping impacts the carrier mobility and electrical conductivity in hematite. As we will show later, our findings agree with Liao et al. and Kerisit et al. on Ti acting as an EP trap and decreasing the carrier mobility;10,11 while other works found that certain atomic doping can increase the carrier mobility.9,12
Herein, to resolve the previous controversy, we carefully evaluated all possible nearest-neighbor EP hopping barriers in the supercells from first principles followed by using the kinetic Monte-Carlo sampling method for the statistically-averaged polaron mobility in doped systems. Multiplied by the carrier concentration predicted from the method we recently implemented based on charge neutrality conditions,18 the electrical conductivity can be calculated and compared with experimental values. In addition, we studied several different atomic dopants, including both group IV and group V elements, and revealed the trend of how atomic doping impacts the carrier mobility and electrical conductivity in hematite. This knowledge is highly desired because it can provide practical guidelines to experimentalists on the choice of dopants for optimal electrical conductivity and performance of hematite-based devices.
The rest of the paper is organized as follows. First, we calculate the energies of different EP configurations located at different Fe sites. With the Boltzmann distribution, the probability of EP forming in each layer is obtained. Second, we compute and compare the EP hopping mobility of pristine and doped hematite. The EP hopping in pristine hematite is studied first as a reference. The dopants Sn, Ti, and Nb are picked as prototypical examples for detailed discussions of doping effects. All possible nearest-neighbor EP hopping barriers in each layer are computed and used as inputs for kinetic Monte Carlo calculations of the in-plane mobility. Then, the effective bulk carrier mobility is obtained by summing up the in-plane mobility with the probability of EP forming at each layer, given the out-of-plane hopping is several orders of magnitude slower than the in-plane one.
The overall electrical conductivity of the whole system can be calculated by multiplying the carrier concentration with the effective bulk carrier mobility and then compared with experimental values. At the end, we use the three dopants to deduce the trend of how different dopants impact the carrier mobility and electrical conductivity in hematite. We found that the carrier mobility of hematite decreases after atomic doping regardless of specific elements.
The effect of dopants on carrier mobility is related to the Fe sub-lattice disorder induced by dopants, i.e. the number of distorted Fe–Fe pairs compared to the pristine systems. More distortion introduced to the sub-lattice leads to a lower carrier mobility.
Therefore, dopants introducing minimal disruption to the Fe sub-lattice are more desired for optimal carrier mobility.
2. Methodologies
2.1. First-principles calculations
We employed the plane-wave density functional theory (DFT) code QUANTUM ESPRESSO19 for total energy and geometry optimization calculations. We used the Perdew–Burke–Ernzerhof (PBE) exchange–correlation functional20 and an effective Hubbard U value of 4.3 eV21 for Fe 3d orbitals.15,16 We used plane-wave cutoffs of 40 Ry and 240 Ry for wavefunction and charge density, respectively, and GBRV ultrasoft pseudopotentials.22–24 Atomic structures were fully relaxed with an energy threshold of 10−4 Ry Å−1. We employed a hexagonal 2 × 2 × 1 supercell and a k-point mesh of 2 × 2 × 2 to integrate over the Brillouin zone. We compared the EP energy distribution among different Fe sites between the 2 × 2 × 1 supercell and the 3 × 3 × 1 supercell and found that the energy difference at the corresponding configuration is less than 0.02 eV (Fig. S6†). Considering the high computational cost for calculating the 3 × 3 × 1 supercell and relatively small errors between 2 × 2 × 1 and 3 × 3 × 1 supercells, we employed the 2 × 2 × 1 supercell for all other calculations of dopants at the dilute limit. The details of defect formation energy and concentration calculations are consistent with our previous work.18 The technical details of the carrier mobility methodology by combining the Landau–Zener theory and kinetic Monte-Carlo sampling can be found in ref. 25.2.2. Doped hematite supercells and kinetic Monte Carlo sampling
In doped hematite supercells, the degeneracy among different Fe sites is broken. To distinguish non-equivalent Fe sites, we labeled different Fe sites on each plane with numbers according to their distance to the dopant (Fig. 1). We also labeled different planes, given that carrier transport mainly happened in-plane, and the out-of-plane transport is spin forbidden with orders of magnitude lower mobility.26 We used the linear interpolation method to calculate the energy barrier of each nearest-neighbor EP hopping, as employed in the previous studies.15,16 The atom positions are interpolated between the reactant and product configurations, followed by relaxing the approximate saddle-point geometry (the highest energy point in the interpolation pathway). The energy difference between the saddle point and the initial state is 0.11 eV for pristine hematite, consistent with previous literature reports.15,16 Considering that out-of-plane EP hopping is orders of magnitude slower than in the a–b plane,26 all possible nearest-neighbor in-plane hopping barriers in Sn-, Ti-, and Nb-doped hematite were calculated and are listed in Tables S1, S2, and S3,† respectively. Not all Fe sites can form stable polarons and thus hopping barriers involving those sites were not calculated. The mobility was calculated using kinetic Monte Carlo (kMC) sampling.25 Numerical details of kMC sampling calculations can be found in the ESI† along with its convergence tests. | ||
| Fig. 1 The atomic structure of the doped hematite supercell. The balls with numbers denote Fe atoms, the red bar denotes O atoms, and the large gray ball without a number denotes the dopant atom. Dopant substitutes an Fe site in layer 3, as distinguished by the larger ball in the figure. The supercell is divided into different layers (representing the a–b plane), and for each layer, the Fe sites are labeled with different numbers increasing with their distance to the dopant. The spin direction is also labeled with arrows on the right side of the figure. Spin flips between two nearest planes, which leads to the difficulty of out-of-plane polaron transport. | ||
2.3. Electrical conductivity ensemble method
Since doping breaks the atomic-site degeneracy and out-of-plane transport is orders of magnitude lower compared to in-plane transport, we propose to obtain an effective carrier mobility (μeff) in the doped hematite by multiplying the carrier mobility of each layer with the EP formation probability, | (1) |
 | (2) |
 | (3) |
| Sample | n (cm−3) | E a (eV) | μ (cm2 V−1 s−1) | σ (S cm−1) |
|---|---|---|---|---|
| Pristine[Exp,13] | NR | 0.110 | NR | NR |
| Pristine[ours] | 1.5 × 10¹³ | 0.110 | 0.0560 | 1.34 × 10⁻⁷ |
| Sn 3.0%[Exp,9] | 1.6 × 10¹⁹ | 0.140 | 0.0430 | 0.11 |
| Sn 3.0%[ours] | 4.5 × 10¹⁹ | 0.137–0.185 | 0.0060 | 0.04 |
| Ti 3.0%[Exp,32] | 8.8 × 10¹⁹ | 0.118 | 0.0405 | 0.57 |
| Ti 3.0%[ours] | 2.7 × 10²⁰ | 0.133–0.177 | 0.0063 | 0.27 |
| Nb 3.0%[Exp,31] | 5.0 × 10¹⁹ | NR | NR | NR |
| Nb 3.0%[ours] | 3.0 × 10²⁰ | 0.146–0.219 | 0.0019 | 0.09 |
Here D is the diffusion coefficient obtained from calculating all possible EP hopping in the same layer, with kMC sampling which provides the statistically averaged value. We note that the ES equation is justified under our current conditions, i.e. low electric field and room temperature, as discussed in ref. 27. The effect of dopants on polaron transport depends on the attractive or repulsive interactions between the dopant and polarons, as explained in ref. 25. Experimentally, previous studies show that low-concentration doping or defects still have a non-negligible effect on polaron mobility.28,29 The computational details can be found in the ESI.† Then, the electrical conductivity (σ) in hematite can be calculated by using the following equation,
| σ = enμeff | (4) |
3. Results and discussion
3.1. Energy and associated probability distribution of EP located at different Fe sites
Three prototypical dopants, Sn, Ti and Nb, were selected to study how dopants impact the carrier mobility and electrical conductivity of hematite. They were chosen because they are the most well-studied group IV and V dopants, with many available experimental results for comparison.2,5,6,30,31 We have shown the density of states (DOS) and polaron spin density of three dopant systems in ESI Fig. S16,† where Sn and Ti dopants are in their neutral state, but Nb is in its +1 charged state that leaves only one polaron in the system for fair comparison. We can see that the electron polaron state is well localized as a sharp peak in the DOS plot and the polaron spin density appears like a hybridized Fe d–O p orbital. In order to compute the probability of EP formation in each layer, we calculated the formation energy of EP at different Fe sites, as shown in Fig. 2(a) and Fig. S7(a), (c).† The EP energy distribution overall follows the trend of the Coulomb interaction (i.e. ∼−1/r) as a function of dopant–polaron distance (r), where the zero is referenced to the energy of the most stable polaron configuration. Since Sn and Ti (group IV elements) only generate one EP and Nb (group V elements) generates two EPs, for a fair comparison among the three dopants, one EP was removed from Nb-doped hematite by adding one positive charge. Afterward, the probability of EP formation at different Fe sites was derived from the energy distribution based on the Boltzmann distribution, as shown in Fig. 2(b). In addition, the total probability is normalized to one, with the formation probability at each Fe site listed in Table S5.† It can be noted that the EPs distribution is dopant–polaron distance-dependent and EPs are easier to form at Fe sites closer to the dopant (Fig. 2(b) and S7(b), (d)†), consistent with Fig. 2(a). | ||
| Fig. 2 EP energy (a) and probability distribution (b) for Sn-doped hematite. (a) Energy distribution of EP locating at different Fe sites as a function of Sn–polaron distance. The Coulomb interaction trend is highlighted by the wide purple strip. The zero energy is referenced to the energy of the most stable polaron configuration. (b) Probability distribution of EP locating at different sites as a function of Sn–polaron distance. An inverse relationship between the probability and the Sn–polaron distance is shown, highlighted in a wide purple stripe. Dopant substitutes the central Fe site in layer 3 as shown in Fig. 1. | ||
3.2. kMC and carrier mobility calculations
As a reference, EP transport in pristine hematite was studied first, whose carrier mobility was calculated to be 0.056 cm2 V−1 s−1 as listed in Table 1. The calculated hopping barrier is 0.11 eV (Fig. S8†), in good agreement with experiments.13 We then studied EP transport in doped hematite using kMC sampling. All possible nearest-neighbor in-plane EP hopping barriers were computed (tabulated in Tables S1–S3†), as inputs for kMC diffusion coefficient calculations. The mean square displacement (MSD) was plotted over time as shown in Fig. 3, with its slope corresponding to diffusion coefficient D, and then the carrier mobility can be obtained using eqn (3). The MSD of the pristine system was plotted as a reference with a dashed black line in Fig. 3, and the MSD in each layer of the Sn-doped system was plotted with colored lines. The latter lines all have a smaller slope than the pristine one, indicating reduced diffusion coefficients in the presence of dopants. The carrier mobility of each layer for the three dopants was calculated and is listed in Table S5.† Afterward, the effective bulk carrier mobility was calculated by multiplying the probability of EP formation at each layer with its corresponding in-plane carrier mobility, i.e.eqn (1). The effective bulk carrier mobility order for the three dopants is Ti > Sn > Nb, with details in Table 1. Finally, the overall electrical conductivity was obtained by multiplying the carrier concentration with the corresponding system's carrier mobility, which is in good agreement with the experimentally measured values, as detailed in Table 1. | ||
| Fig. 3 The mean square displacement (MSD) over time for different layers in Sn-doped hematite from the kMC simulations averaging over 16 kMC simulations. Dopant substitutes the central Fe site in layer 3. After the dashed line for pristine, the legend of “layer 3, layer 4…” is in the order of increasing distance to the dopant. | ||
One note is that our calculated carrier mobility of doped hematite is mostly underestimated compared to the experimental values (less than an order of magnitude). The reason could be that the layers far from dopants are difficult to be included completely due to the supercell size limit; however, the mobility in these layers is closer to pristine and generally larger than the layers closer to dopants. Specifically, we plot the probability of EP formation and the carrier mobility over each layer in Fig. S9,† where we find a very strong layer dependence for both quantities. Namely, the carrier mobility increases with the distance of polarons away from the dopant. An opposite trend was found for the polaron formation probability. The calculated electrical conductivity, on the other hand, has a smaller difference between theory and experiments (less than 3 times) and gives the same ordering among dopants between theory and experiments, as shown in Table 1. This illustrates the reliability of our computational method and calculations.
3.3. Effect of dopant charge states and induced strain
The calculated results above are informative for answering the key questions: how dopants impact the carrier mobility and electrical conductivity in hematite and what makes a dopant effective in improving the carrier mobility and electrical conductivity? To answer these two questions, we started by examining two potentially important factors: one is the charge state of dopants and the other is strain induced by atomic doping. In order to study the former, we changed the charge state of dopants by adding positive or negative charges into the supercell calculations. We picked Sn and Nb as examples as follows. For Sn, we simulated a neutral (Q0) system (generating one EP in the supercell) and a negatively-charged (Q − 1) system (one negative charge added, two EPs in the supercell) in order to compare EP hopping barriers between Sn4+- and Sn3+-doped systems. For Nb, we simulated a Q0 system (two EPs in the supercell) and Q + 1 system (one positive charge added, only one EP left in the supercell) to compare EP hopping barriers between Nb4+- and Nb5+-doped systems. We directly calculated and compared energy barriers for the different charged systems mentioned above in Fig. S10.† Interestingly, the difference in the energy barriers between differently charged systems was relatively small, mostly below 0.02 eV. This may indicate that the magnitude of charges in the Coulomb interaction among the dopant and EP may not be a dominant factor for energy barriers.The strain effect was then examined by calculating the strain energy of EP located at different Fe sites, in Fig. 4 for Sn doping and Fig. S11(a) and (b)† for Ti and Nb doping, respectively. It is computed as the total energy difference of pristine Fe2O3 between its equilibrium geometry and the geometry relaxed with dopants (first relax with dopants, then substitute back with Fe atoms to keep the same composition as pristine Fe2O3).8 As shown in Fig. 4, the strain energy of all data points can be divided into two regions by taking the dopant–polaron distance at 4.5 Å as a threshold (distinguished by different background colors). Beyond this threshold, strain energies are relatively stable and fluctuate within an energy range of 0.1 eV. Therefore, considering that the strain effect is usually local, we proposed that there is a weaker interaction between the dopant and EP when their distance is beyond 4.5 Å. To verify this hypothesis, we calculated the strain energies independently introduced by the dopant only and EP only, then summed the two parts up, which is shown as the dashed horizontal line in Fig. 4 as the non-interacting limit. Specifically, we calculated the strain energy of the isolated dopant without EP (such as the Sn Q + 1 system with one positive charge, no polaron left in the supercell), and strain energy due to an isolated EP in pristine Fe2O3.
 | ||
| Fig. 4 Strain energy of EP located at different Fe sites for Sn-doped hematite as a function of Sn–polaron distance. The dashed horizontal line is the summation of strain energy from an isolated Sn dopant and an EP. Dopant substitutes the central Fe site in layer 3. | ||
It can be noted that there is some discrepancy between the plateau of the calculated strain energy of doped systems with EPs and the dashed line (non-interacting limit), which is due to the supercell's finite sizes, as verified by the smaller discrepancy in the 3 × 3 × 1 supercell in Fig. S12.† When the dopant–polaron distance is short, i.e., below the threshold of 4.5 Å, they are squeezed into a compact space and the strong interaction between them decreases the strain energy to some extent. Similar conclusions can be drawn from other doped systems in Fig. S11(a) and (b).† To further understand the strain energy's relationship with the hopping barriers, we next discuss the local structural distortion induced by different dopants in detail.
3.4. Fe sub-lattice distortion and the potential energy surface
We then examine the local structure of doped Fe2O3. For atomic structural details, we have labeled the Fe–Fe pair distances in pristine and doped Fe2O3 (close to dopants) in ESI Fig. S17 and Table S6.† We then looked at the Fe–Fe pair distribution function (PDF) averaging over all possible EP configurations (where dopant–EP distances vary as shown in Fig. 2 and 4). Fig. 5(a) shows the PDF of Fe–Fe pair distances for the three dopants, while Fig. 5(b) shows the integrated PDF for the three dopants. The black lines in both panels refer to the values of pristine Fe2O3 without distortion as the reference. Compared with the pristine value, Ti has the smallest Fe–Fe pair distance disorder, while Nb has the largest, as indicated by the spread of the peak. We found that this trend is consistent with that of carrier mobility for three dopants (Ti > Sn > Nb). Furthermore, these Fe–Fe pair distances were divided into three regions for more quantitative analysis (Table 2): the “Closer” region (the Fe–Fe pair distance is shorter than the pristine one by at least 0.01 Å), the “Same” region (the Fe–Fe pair distance falls within an error bar of ±0.01 Å compared to the pristine one), and the “Farther” region (the Fe–Fe pair distance is longer than the pristine one by at least 0.01 Å). Among the three dopants, Nb has the greatest percentage of the “Farther” region, which means that it has the most stretched Fe–Fe pair distances compared to Ti and Sn. In the Fig. 6 schematic plot for polaron hopping in a Marcus-theory-like picture, the scenario (1) shows that a longer Fe–Fe pair distance shifts the potential energy surfaces (PES) of the initial state and the final state horizontally away from each other, which leads to a larger hopping energy barrier. On the other hand, the smallest percentage of the “Farther” region in Ti doping suggests the least number of stretched Fe–Fe pair distances. The data in Table 2 are consistent with the calculated carrier mobility trend earlier (Ti > Sn > Nb) in Table 1. | ||
Fig. 5 Fe–Fe pair distances for all EP configurations for the three dopants. (a) Pair distribution function (PDF) of Fe–Fe pair distances for all EP configurations for the three doped systems. The black line represents the Fe–Fe pair distance in pristine hematite, used as a reference. (b) Integrated pair distribution function  of the Fe–Fe pair distance for all EP configurations. The grey band indicates the region considered as the “Same” region in Table 2. Ti doping has the least Fe sub-lattice disorder compared to Sn and Nb doping (closest to the pristine lines). of the Fe–Fe pair distance for all EP configurations. The grey band indicates the region considered as the “Same” region in Table 2. Ti doping has the least Fe sub-lattice disorder compared to Sn and Nb doping (closest to the pristine lines). | ||
 | ||
| Fig. 6 Schematic diagram showing the correlation between the Fe–Fe pair distance/reaction energy and the energy barrier in a Marcus-theory-like picture. (a) Fe–Fe pair distance change leads to a horizontal shift of the potential energy surface (PES). The increasing Fe–Fe distance results in a higher hopping barrier. (b) Reaction energy (EFS − EIS) change leads to a vertical shift of the PES. The increasing final state energy (shifting up its potential energy surface) results in a higher barrier from the initial state (IS) to the final state (FS). | ||
| Dopant | Closer (%) | Same (%) | Farther (%) |
|---|---|---|---|
| Ti | 6.13 | 88.65 | 5.22 |
| Sn | 15.77 | 75.45 | 8.78 |
| Nb | 21.26 | 68.86 | 9.87 |
To find a direct correlation between Fe PDF and the hopping energy barrier, we plot Fig. 7. In Fig. 7(a), most Fe–Fe pair distance longer than the pristine value exists in the supercell configurations of Sn–polaron distance <4.5 Å (the blue line). This suggests that the major portion of Fe sub-lattice distortion happens within a threshold of 4.5 Å, correlated well with Fig. 7(b), where the overall much higher EP hopping barrier exists within the Sn–EP distance <4.5 Å. This correlation proves that the Fe sub-lattice distortion is the underlying cause for the change of the energy barrier/carrier mobility after doping. The previously observed layer dependency of carrier mobility can also be explained by the result here. Specifically, layers closer to dopants have greater Fe sub-lattice distortion, which results in a larger EP hopping barrier, unfavorable for carrier mobility. Additionally, the Fe sub-lattice distortion breaks the potential energy surface (PES) symmetry between the initial state (IS) and the final state (FS) along one hopping path, as illustrated in schematic Fig. 6 scenario (2), which indirectly changes the EP hopping barrier. For example, in Fig. S15,† considering that the Fe–Fe pair distance is similar between Ti (left panel) and Nb (right panel) doped systems in one particular EP hopping, the much smaller energy barrier in the Ti-doped case on the left is due to the vertical downshift of the PES of the FS. This part of contribution mostly originated from the reaction energy (EFS − EIS) change as a function of dopant–polaron distance, by an ättractive” or “repulsive” interaction between the dopant and EP, as discussed in ref. 25.
 | ||
| Fig. 7 Fe–Fe pair distribution function (PDF) and energy barrier for Sn-doped hematite. (a) PDF of the Fe–Fe pair distribution in Sn-doped hematite for the Sn–EP distance less than 4.5 Å (<4.5 Å, blue line) or more than 4.5 Å (>4.5 Å, green line). (b) EP hopping barriers in Sn-doped hematite as a function of Sn–EP distance. The horizontal dashed line in the plot is the EP hopping barrier in pristine hematite. The vertical dashed line is at 4.5 Å to guide the eye. | ||
3.5. Experimental comparison of the local structure of doped Fe2O3
Since Fe sub-lattice distortion is difficult to be directly compared with experimental data, other relevant parameters are the dopant–O and dopant–Fe distances, which differ from the Fe–O and Fe–Fe distances in pristine hematite. Fortunately, this allows a direct comparison of the calculated pair distances about a dopant atom, with the corresponding measured pair distances from EXAFS. The details of EXAFS measurements and sample synthesis can be found in the ESI.†The EXAFS results are part of a larger study and are summarized briefly in the ESI – see Fig. S4.† The Sn–O, Ti–O, and Nb–O bond lengths for the first oxygen shell, and the Sn–Fe, Ti–Fe, and Nb–Fe pair distances for the first main Fe shell near 3 Å, were extracted from the fits of the EXAFS data and plotted as vertical dashed lines in Fig. 8. In these fits, the first oxygen shells about Ti and Nb remain split into two peaks as is also the case for the Fe–O peaks in hematite, but for the Sn dopant, the Sn–O peaks move together and can no longer be resolved. (The limit for resolving a split peak is about 0.12 Å for Sn.) There is an overall scale factor (by 1.01) difference between calculations and measured distances, and in Fig. 8, the theoretical distances have been divided by 1.01. The agreement is remarkable; only Sn–O pairs move together in both theory and experiment and the order of the dopant–Fe distances is the same in both theory and experiment.
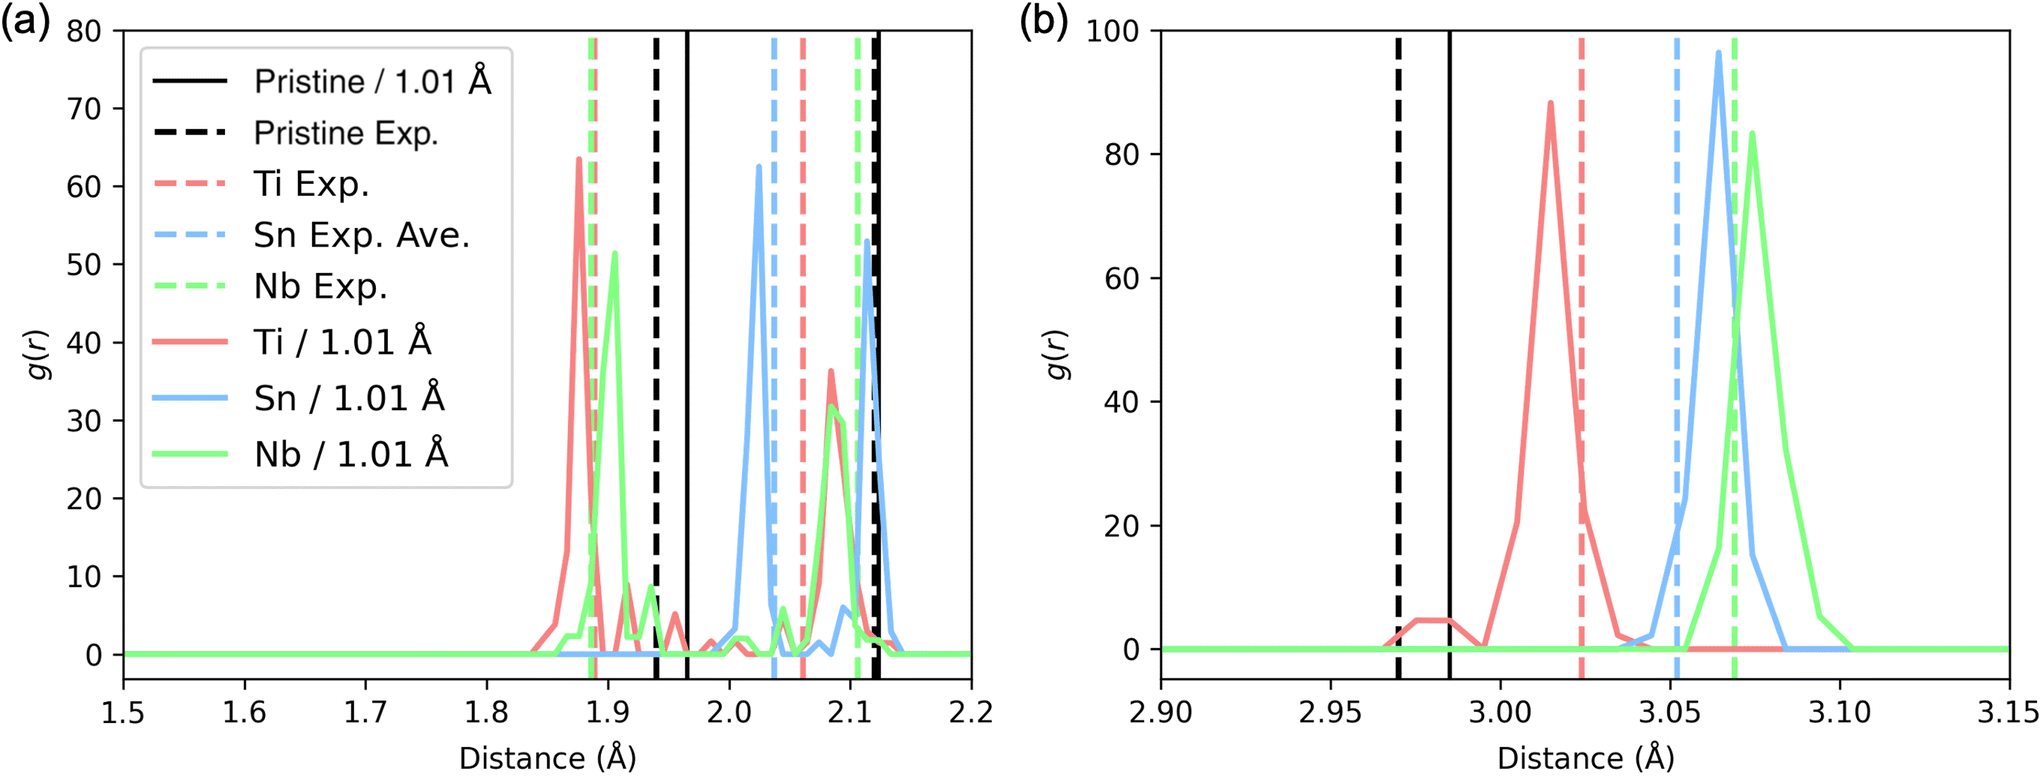 | ||
| Fig. 8 PDFs for all EP configurations for the three doped systems. (a) Dopant–O pair distribution function. (b) Dopant–Fe pair distribution function. For comparison with experiments, all PDFs were divided by a factor of 1.01. Vertical dashed lines labeled with Exp. are bond lengths fit from EXAFS; see the ESI† for details. For Sn–O, the bond lengths of the 2 oxygen neighbors were unresolved and the average was plotted. | ||
Additionally, to further characterize the system we obtained X-ray diffraction (XRD) spectra from pristine hematite and 0.1% Sn-doped hematite samples. As shown in Fig. S3,† the two samples have identical diffraction peaks, which match well with the reported profile for hematite. The results also confirm that there is no observable signal due to impurities. XRD provides the averaged structure which shows that the host hematite was not changed by dopants macroscopically.
4. Conclusion
In conclusion, we systematically investigated how dopants affect the carrier mobility and electrical conductivity in hematite. Instead of only focusing on the first EP hopping away from the dopant, we studied all possible EP hopping in each layer, followed by using kMC sampling for the statistically averaged carrier mobility. Combined with our previous work on ab initio carrier concentration calculation under charge neutrality conditions, the overall electrical conductivity is obtained from the product of the carrier concentration and carrier mobility. The good agreement between our calculated results and experimentally measured values demonstrates the robustness of our computational methods. From our calculated results, we found that doping does not improve the carrier mobility in hematite, and the improved electrical conductivity is owing to the enhanced carrier concentration. The Fe sub-lattice distortion is the main underlying reason for the change of carrier mobility. The longer the Fe–Fe pair distance is, the larger the hopping barrier is. Among the three dopants studied, Ti shows the highest carrier mobility because Ti has the least Fe sub-lattice distortion (with the lowest percentage of longer Fe–Fe pair distance than pristine). Our work dives deep into understanding how dopants impact the carrier mobility and electrical conductivity of hematite. Additionally, it provides practical guidance to experimentalists about which dopants to choose for optimizing the electrical conductivity of hematite and the performance of hematite-based devices.Conflicts of interest
There are no conflicts to declare.Acknowledgements
This work is mainly supported by the National Science Foundation under grant no. DMR-2003563. Ping also acknowledges the financial support from the National Science Foundation under grant No. CHE-2203633 for the theoretical part of the work. T.S. acknowledges the LLNL Graduate Research Scholar Program and funding support from LLNL LDRD 20-S1-004. Part of his work was performed under the auspices of the U.S. Department of Energy by Lawrence Livermore National Laboratory under Contract DE-AC52-07NA27344. This research used the resources of the Scientific Data and Computing center, a component of the Computational Science Initiative, at Brookhaven National Laboratory under Contract No. DE-SC0012704, the lux supercomputer at UC Santa Cruz, funded by NSF MRI grant AST 1828315, and the Extreme Science and Engineering Discovery Environment (XSEDE) which is supported by the National Science Foundation Grant No. ACI-1548562.33References
- A. Murphy, P. Barnes, L. Randeniya, I. Plumb, I. Grey, M. Horne and J. Glasscock, Efficiency of solar water splitting using semiconductor electrodes, Int. J. Hydrogen Energy, 2006, 31, 1999–2017 CrossRef CAS.
- Y. Ling, G. Wang, D. A. Wheeler, J. Z. Zhang and Y. Li, Sn-doped hematite nanostructures for photoelectrochemical water splitting, Nano Lett., 2011, 11, 2119–2125 CrossRef CAS PubMed.
- G. Wang, Y. Ling, D. A. Wheeler, K. E. George, K. Horsley, C. Heske, J. Z. Zhang and Y. Li, Facile synthesis of highly photoactive α-Fe2O3-based films for water oxidation, Nano Lett., 2011, 11, 3503–3509 CrossRef CAS PubMed.
- Y. Ling, G. Wang, J. Reddy, C. Wang, J. Z. Zhang and Y. Li, The influence of oxygen content on the thermal activation of hematite nanowires, Angew. Chem., 2012, 124, 4150–4155 CrossRef.
- M. Li, Y. Yang, Y. Ling, W. Qiu, F. Wang, T. Liu, Y. Song, X. Liu, P. Fang and Y. Tong, et al., Morphology and doping engineering of Sn-doped hematite nanowire photoanodes, Nano Lett., 2017, 17, 2490–2495 CrossRef CAS PubMed.
- Y. Yang, M. Forster, Y. Ling, G. Wang, T. Zhai, Y. Tong, A. J. Cowan and Y. Li, Acid treatment enables suppression of electron–hole recombination in hematite for photoelectrochemical water splitting, Angew. Chem., Int. Ed., 2016, 55, 3403–3407 CrossRef CAS.
- C. Franchini, M. Reticcioli, M. Setvin and U. Diebold, Polarons in materials, Nat. Rev. Mater., 2021, 6, 560–586 CrossRef CAS.
- T. J. Smart, V. U. Baltazar, M. Chen, B. Yao, K. Mayford, F. Bridges, Y. Li and Y. Ping, Doping bottleneck in hematite: Multipole clustering by small polarons, Chem. Mater., 2021, 33, 4390–4398 CrossRef CAS.
- C. M. Tian, W.-W. Li, Y. Lin, Z. Yang, L. Wang, Y. Du, H. Y. Xiao, L. Qiao, J.-Y. Zhang and L. Chen, et al., Electronic structure, optical properties, and photoelectrochemical activity of sn-doped fe2o3 thin films, J. Phys. Chem. C, 2020, 124, 12548–12558 CrossRef CAS.
- P. Liao, M. C. Toroker and E. A. Carter, Electron transport in pure and doped hematite, Nano Lett., 2011, 11, 1775–1781 CrossRef CAS.
- S. Kerisit and K. M. Rosso, Kinetic Monte Carlo model of charge transport in hematite (α-Fe2O3), J. Chem. Phys., 2007, 127, 124706 CrossRef PubMed.
- Z. Zhou, R. Long and O. V. Prezhdo, Why silicon doping accelerates electron polaron diffusion in hematite, J. Am. Chem. Soc., 2019, 141, 20222–20233 CrossRef CAS.
- J. B. Goodenough, Metallic oxides, Prog. Solid State Chem., 1971, 5, 145–399 CrossRef CAS.
- T. Nakau, Electrical conductivity of α-Fe2O3, J. Phys. Soc. Jpn., 1960, 15, 727–727 CrossRef CAS.
- T. J. Smart and Y. Ping, Effect of defects on the small polaron formation and transport properties of hematite from first-principles calculations, J. Phys.: Condens. Matter, 2017, 29, 394006 CrossRef PubMed.
- N. Adelstein, J. B. Neaton, M. Asta and L. C. De Jonghe, Density, functional theory based calculation of small-polaron mobility in hematite, Phys. Rev. B: Condens. Matter Mater. Phys., 2014, 89, 245115 CrossRef.
- K. M. Rosso, D. M. Smith and M. Dupuis, An ab initio model of electron transport in hematite (α-Fe 2 O 3) basal planes, J. Chem. Phys., 2003, 118, 6455–6466 CrossRef CAS.
- T. J. Smart, M. Chen, A. C. Grieder, V. Urena Baltazar, F. Bridges, Y. Li and Y. Ping, The critical role of synthesis conditions on small polaron carrier concentrations in hematite—A first-principles study, J. Appl. Phys., 2021, 130, 245705 CrossRef CAS.
- P. Giannozzi, S. Baroni, N. Bonini, M. Calandra, R. Car, C. Cavazzoni, D. Ceresoli, G. L. Chiarotti, M. Cococcioni and I. Dabo, et al., QUANTUM ESPRESSO: a modular and open-source software project for quantum simulations of materials, J. Phys.: Condens. Matter, 2009, 21, 395502 CrossRef.
- J. P. Perdew, K. Burke and Y. Wang, Generalized gradient approximation for the exchange-correlation hole of a many-electron system, Phys. Rev. B: Condens. Matter Mater. Phys., 1996, 54, 16533 CrossRef CAS.
- S. L. Dudarev, G. A. Botton, S. Y. Savrasov, C. Humphreys and A. P. Sutton, Electron-energy-loss spectra and the structural stability of nickel oxide: An LSDA + U study, Phys. Rev. B: Condens. Matter Mater. Phys., 1998, 57, 1505 CrossRef CAS.
- K. F. Garrity, J. W. Bennett, K. M. Rabe and D. Vanderbilt, Pseudopotentials for high-throughput DFT calculations, Comput. Mater. Sci., 2014, 81, 446–452 CrossRef CAS.
- T. Kou, M. Chen, F. Wu, T. J. Smart, S. Wang, Y. Wu, Y. Zhang, S. Li, S. Lall and Z. Zhang, et al., Carbon doping switching on the hydrogen adsorption activity of NiO for hydrogen evolution reaction, Nat. Commun., 2020, 11, 1–10 CrossRef PubMed.
- M. Chen, Y. Ping, Y. Li and T. Cheng, Insights into the pH-dependent Behavior of N-Doped Carbons for the Oxygen Reduction Reaction by First-Principles Calculations, J. Phys. Chem. C, 2021, 125, 26429–26436 CrossRef CAS.
- F. Wu and Y. Ping, Combining Landau–Zener theory and kinetic Monte Carlo sampling for small polaron mobility of doped BiVO4 from first-principles, J. Mater. Chem. A, 2018, 6, 20025–20036 RSC.
- N. Iordanova, M. Dupuis and K. M. Rosso, Charge transport in metal oxides: a theoretical study of hematite α-Fe 2 O 3, J. Chem. Phys., 2005, 122, 144305 CrossRef CAS.
- H. Oberhofer, K. Reuter and J. Blumberger, Charge Transport in Molecular Materials: An Assessment of Computational Methods, Chem. Rev., 2017, 117, 10319–10357 CrossRef CAS . PMID: 28644623.
- W. Zhang, F. Wu, J. Li, D. Yan, J. Tao, Y. Ping and M. Liu, Unconventional Relation between Charge Transport and Photocurrent via Boosting Small Polaron Hopping for Photoelectrochemical Water Splitting, ACS Energy Lett., 2018, 3, 2232–2239 CrossRef CAS.
- T. W. Kim, Y. Ping, G. A. Galli and K.-S. Choi, Simultaneous enhancements in photon absorption and charge transport of bismuth vanadate photoanodes for solar water splitting, Nat. Commun., 2015, 6, 8769 CrossRef CAS PubMed.
- Z. Fu, T. Jiang, Z. Liu, D. Wang, L. Wang and T. Xie, Highly photoactive Ti-doped α-Fe2O3 nanorod arrays photoanode prepared by a hydrothermal method for photoelectrochemical water splitting, Electrochim. Acta, 2014, 129, 358–363 CrossRef CAS.
- C. Sanchez, K. Sieber and G. Somorjai, The photoelectrochemistry of niobium doped α-Fe2O3, J. Electroanal. Chem. Interfacial Electrochem., 1988, 252, 269–290 CrossRef CAS.
- B. Zhao, T. Kaspar, T. Droubay, J. McCloy, M. Bowden, V. Shutthanandan, S. Heald and S. Chambers, Electrical transport properties of Ti-doped Fe2O3 (0001) epitaxial films, Phys. Rev. B: Condens. Matter Mater. Phys., 2011, 84, 245325 CrossRef.
- J. Towns, T. Cockerill, M. Dahan, I. Foster, K. Gaither, A. Grimshaw, V. Hazlewood, S. Lathrop, D. Lifka, G. D. Peterson, R. Roskies, J. R. Scott and N. Wilkins-Diehr, Comput. Sci. Eng., 2014, 16, 62 Search PubMed.
Footnotes |
| † Electronic supplementary information (ESI) available. See DOI: https://doi.org/10.1039/d2nr04807h |
| ‡ Contributed equally to this work. |
| This journal is © The Royal Society of Chemistry 2023 |