
 Open Access Article
 This Open Access Article is licensed under a Creative Commons Attribution-Non Commercial 3.0 Unported Licence
Hollow sphere manganese–ceria solid solution enhances photocatalytic activity in tetracycline degradation†
Huiming
Shi
a,
Quanquan
Shi
*ac,
Jinmei
Li
a and
Gao
Li
 *bd
*bd
aCollege of Science & College of Material Science and Art Design, Inner Mongolia Agricultural University, Hohhot 010018, China. E-mail: qqshi@imau.edu.cn
bState Key Laboratory of Catalysis, Dalian Institute of Chemical Physics, Chinese Academy of Sciences, Dalian 116023, China. E-mail: gaoli@dicp.ac.cn
cInner Mongolia Key Laboratory of Soil Quality and Nutrient Resource & Key Laboratory of Agricultural Ecological Security and Green Development at Universities of Inner Mongolia Autonomous, Hohhot 010018, China
dUniversity of Chinese Academy of Sciences, Beijing, China
First published on 30th October 2023
Abstract
As a typical representative of antibiotics, tetracycline is widely used in medicine and aquaculture due to its low cost and strong antibacterial ability. However, it is difficult for humans or animals to metabolize completely, resulting in the aggravation of water pollution in aquatic environments. Therefore, it is urgent to explore advanced photocatalysts for the degradation of antibiotics. In this work, we prepared a spherical manganese dioxide-ceria (MnCeOx) solid solution by a simple one-step hydrothermal method and evaluated its photocatalytic degradation activity towards tetracycline using a Xe lamp. The study of the structure and optical properties showed that doping of Mn cations into a ceria lattice can introduce defect energy levels to narrow the band gap, which can then increase the number of surface oxygen vacancies, so as to improve the adsorption of tetracycline and promote the separation and transfer of photogenerated electrons and holes. MnCeOx-10 with the highest oxygen defect showed the best photocatalytic performance (the promising degradation efficiency was 65% in 90 minutes), which was about 2.3 times and 1.3 times higher than those of the original CeO2 and MnOx/CeO2 catalysts, respectively. In addition, the capture experiment verified that ˙O2− and h+ should be the reasons for enhancing the degradation process. This study provides guidance and a practical basis for the development of an efficient rare-earth photocatalyst system.
Introduction
Since the discovery of penicillin in 1929, various types of antibiotics have played a significant role in treating bacterial infections.1,2 However, antibiotics are difficult to metabolize by humans or animals fully and exist extensively in the aquatic environment, which causes serious water pollution and environmental deterioration.3,4 Tetracycline residues in the aquatic environment inhibit the production of enzymes in aquatic animals and plants, resulting in the inhibition of growth in animals and plants. Tetracycline (TC), an important and a typical representative of antibiotics, is widely used in medicine, aquaculture, and stockbreeding due to its low cost and outstanding antimicrobial ability.5 TC is consumed in hundreds of thousands of tons every year, which has been assessed as one of the greatest threats to human health in the 21st century by the World Health Organization (WHO).6 So far, a number of water pollution treatment methods have been documented, such as wastewater adsorption,7 advanced oxidation,8 microwave catalysis,9–12 and so on. Photocatalysis is considered to be the most environmentally friendly method for degrading organic pollutants in aqueous solutions because it does not pollute the environment, the energy used is environmentally friendly, and photocatalysts are in effective contact with the potential pollutants in the aqueous solution.13,14As one of the minerals developed in recent years, rare earth elements, such as cerium and samarium, are widely used in photocatalytic degradation reactions. Ceria-based catalysts as dazzling rare earth oxides of lanthanide series have gained significant attention in photocatalytic degradation due to the specific 4f electron structure, abundant oxygen defects, and high oxygen storage–release capacity through the fast redox coupling of Ce3+–Ce4+.15–19 However, bare CeO2 has a wider bandgap and poor photo-absorption capability, and involves fast recombination of photoexcited electron–hole (e−–h+) pairs, which largely restricts its practical applications.20–22 Many attempts have been proposed to efficiently improve optical absorption and charge carrier separation, such as elemental doping, morphological modification, heterojunction construction, etc.21 Doping CeO2 with transition or alkaline earth metals is a reliable means for endowing sunlight harvesting and promoting the separation of photoinduced electron–hole pairs.13,23–25 Doping of low valence metal atoms into CeO2 can cause lattice distortion and then generate abundant oxygen vacancies, which could act as TC adsorption/activation sites and promote TC photodegradation.26 For example, Yang et al.27 demonstrated that transition metal (e.g. Fe, Cr, and Co) doped CeO2 is conductive to reducing the band gap and achieving improved photocatalytic activity using first-principles calculations. Habib et al.23 prepared a series of Cr doped CeO2 nanostructures via a simple deposition precipitation method and found that the improved photocatalytic degradation of methylene blue was attributed to the narrow CeO2 band gap created with Cr doping, as well as Cr species acting as electron trapping centers to slow down the recombination of the charge carriers. Recently, doping ceria by incorporating Mn cations, forming a solid solution, has been shown to achieve excellent catalytic activity in various oxidation reactions due to the multiple valences of Mn and the redox couples associated with Ce.28 However, the photocatalytic potential for TC degradation using MnCeOx solid solutions has rarely been investigated, which prompts us to examine their photocatalytic behavior in this work.
Herein, we successfully fabricate well-defined manganese-ceria solid solutions with hollow sphere structures. The potential of MnCeOx was explored for photocatalytic activity in TC degradation. It was found that the catalytic behavior of manganese-ceria solid solutions is largely improved by the insertion of manganese cations into the ceria lattice compared to pristine CeO2 and supported MnOx/CeO2 catalysts. MnCeOx-10 solid solutions exhibited enhanced chemisorption and activation of O2 due to their highest oxygen defects, which showed their great potential for removing organic pollutants such as TC.
Experimental section
Chemicals
All chemicals were supplied by Aladdin: cerium nitric acid hexahydrate (Ce(NO3)3·6H2O, 99.9%), manganese nitrate tetrahydrate (Mn(NO3)2·4H2O, 98%), and tetracycline (TC, C22H24N2O8, 98%). All glassware was cleaned using aqua regia and deionized water.Catalyst synthesis
A series of MnCeOx solid solutions with different Mn/Ce molar ratios were prepared by a simple thermal hydrothermal process, which is depicted in Scheme 1. Typically, certain quantities of Ce(NO3)3·6H2O and Mn(NO3)2·4H2O were added to 30 mL of ethylene glycol, followed by adding 5 mL of deionized water dropwise. After agitating vigorously for 30 minutes, the slurry was transferred into a 50 mL autoclave and reacted at 155 °C for 15 hours. After cooling to room temperature, the solids were collected by centrifugation (10![[thin space (1/6-em)]](https://www.rsc.org/images/entities/char_2009.gif) 000 rpm, 5 min), washed with water and ethanol, and then dried under vacuum at 80 °C for 12 h. Finally, the samples were annealed at 500 °C at a rate of 5 °C min−1 (for 2 h in air). The resulting catalyst was named MnCeOx-n, where n (%) is the actual mass ratio of Mn to Ce in the formulation. The CeO2 sample was fabricated using the same process except that without Mn(NO3)2·4H2O.
000 rpm, 5 min), washed with water and ethanol, and then dried under vacuum at 80 °C for 12 h. Finally, the samples were annealed at 500 °C at a rate of 5 °C min−1 (for 2 h in air). The resulting catalyst was named MnCeOx-n, where n (%) is the actual mass ratio of Mn to Ce in the formulation. The CeO2 sample was fabricated using the same process except that without Mn(NO3)2·4H2O.
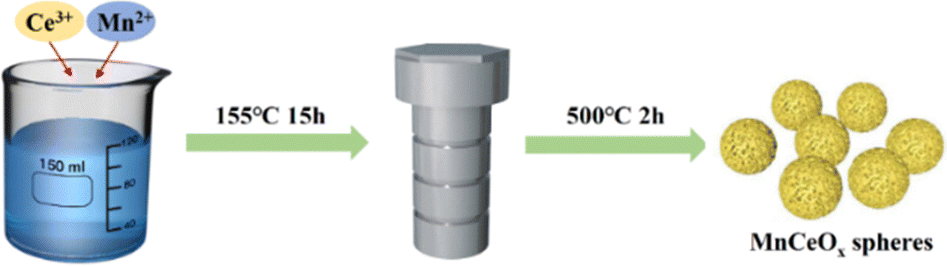 | ||
| Scheme 1 Schematic diagram of the synthetic route for ceria-based samples. | ||
The MnOx/CeO2 catalyst with a nominal loading of 10 wt% was manufactured by a precipitation method. 0.5 g of the CeO2 sample and 0.073 g of Mn(NO3)2·4H2O were mixed in 50 mL of deionized water. After ultrasonication (at 40 KHz) for 15 minutes, sodium carbonate was added while stirring to adjust the pH to 10. After further mixing and stirring for 3 hours, the sample was washed and dried at 80 °C. The obtained sample was calcined at 500 °C for 2 h.
Characterization
Powder X-ray diffraction (XRD) patterns were recorded using a TD-3700 high-resolution X-ray diffractometer in the range of 5°–80°, with test conditions of 40 kW and 200 mA. An FEI Tecnai F20 microscope was used to obtain transmission electron microscopy (TEM) images. XPS was performed using an ESCALAB MK-II spectrometer (VG Scientific Ltd, UK). UV-visible diffuse reflectance spectra were recorded using a spectrophotometer (PE Lambda 850). Photoelectrochemical tests were carried out in a 0.5 mol L−1 Na2SO4 solution and recorded using a CHI760E workstation (Shanghai) using Ag/AgCl, Pt and FTO-supported sample electrodes as the reference, counter, and working electrodes, respectively.Photocatalytic degradation
Typically, 100 mL of TC solution (20 mg L−1) was added to the cold trap of the photochemical reactor under a 300 W Xe lamp equipped with a filter up to 420 nm (Fig. S1, ESI†), and 20 mg of samples was added to the reactor. The Xe lamp was suspended ∼5 cm above the reactor. The quartz tube was first stirred in the dark for 30 min. At 10 minute intervals, 3 mL of the suspension was removed and filtered through a 1 mL cellulose acetate syringe membrane. The absorbance of the filtrate was measured using a UV-vis absorption spectrometer at 357 nm to determine the concentration of TC after photocatalysis. In the cyclic reaction experiments, the catalysts were collected by centrifugation after the reaction, washed with water and ethanol, and dried under vacuum at 80 °C.Results and discussion
Synthesis and characterization of MnCeOx solid solutions
The preparation process of MnCeOx solid solutions is displayed in Scheme 1. The phase and compositions of these as-obtained ceria-based samples were determined as depicted in Fig. 1a. The characteristic peaks of CeO2 (JCPDS card No. 34-0394) were found at 28.7° (CeO2(111)), 33.2° (CeO2(200)), 47.6° (CeO2(220)) and 56.5° (CeO2(311)).29 In addition, compared with the reference CeO2, all the MnCeOx composites show relatively wide diffraction peaks corresponding to the cubic CeO2 phase. No detectable Mn-containing phases or obvious peak shifts, indicating that manganese oxides may exist in the form of highly dispersive and/or amorphous species, thus decreasing the crystallinity of CeO2. The good distribution of Mn dopants can enhance the synergistic effects of Mn and Ce, further improving the catalytic activity of the MnCeOx catalyst (vide infra).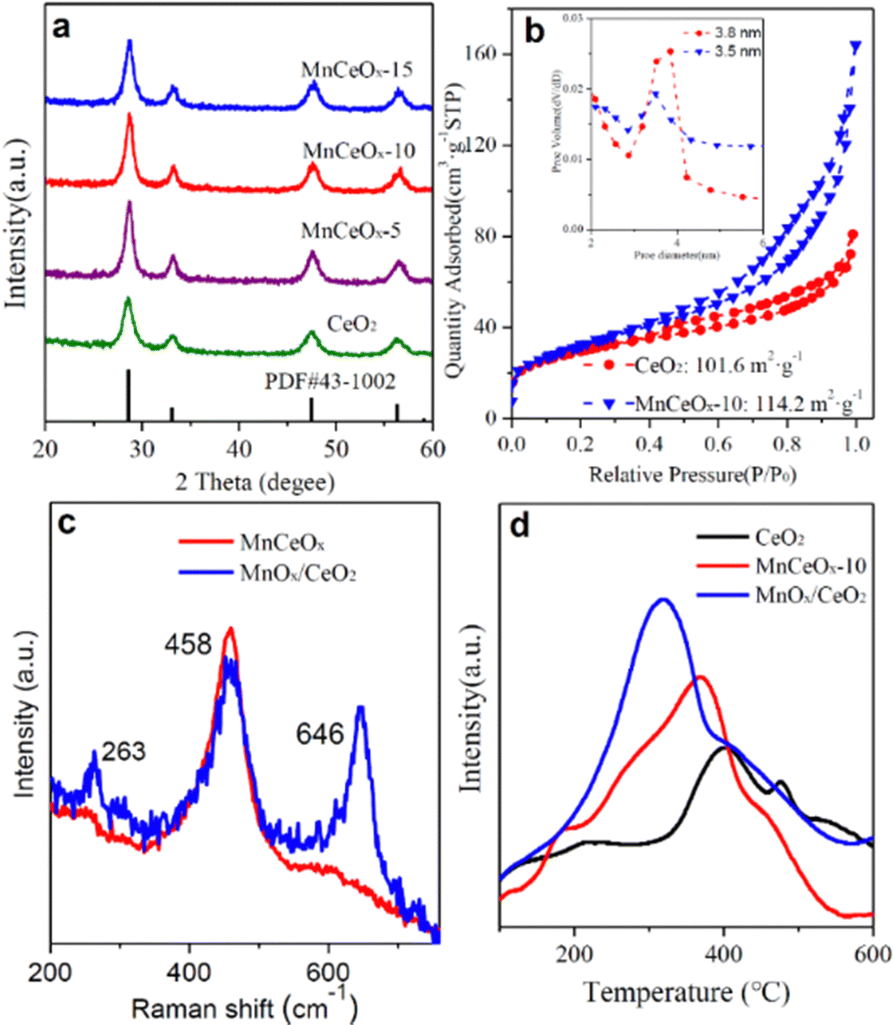 | ||
| Fig. 1 (a) XRD patterns and (b) N2-adsorption–desorption isotherms of pristine CeO2 and MnCeOx composites. The inset in (b) shows the pore size distributions determined by the BJH method. (c) Raman spectra and (d) H2-TPR profiles of MnCeOx-10 and MnOx/CeO2 reference samples. | ||
The pore structure of MnCeOx-10 samples was analyzed by N2 adsorption, and the result is shown in Fig. 1b. The MnCeOx-10 sample has a significant hysteresis loop in the P/P0 > 0.4 region, which is classified as type IV according to the IUPAC classification. It indicates the formation of mesopores that would provide channels for the reactant to enter into the inner surface of the catalyst to improve the catalytic activity.30–32 In addition, both the BET surface area and the pore volume of the MnCeOx-10 catalyst (114.2 m2 g−1, nm) were much higher than those of CeO2 (101.6 m2 g−1, nm), which should be conducive to the improvement of catalytic activity.
Fig. 1c displays the Raman spectra of the MnCeOx-10 and MnOx/CeO2 catalysts. MnOx/CeO2 exhibited a strong Raman peak appearing at 646 cm−1, which is attributed to the Mn–O–Mn stretching mode of the supported MnOx particles. For the MnCeOx-10 catalyst, the υMn–O–Mn band with very weak intensity indicates that the manganese species were highly dispersed in the ceria's lattice in the form of “Ce–O–Mn–O” species. The characteristic F2g of the fluorite-like structure of ceria appears at ∼458 cm−1 (for MnOx/CeO2) and 464 cm−1 (MnCeOx-10), also corroborating the incorporation of the Mn dopant into the ceria lattice.33Fig. 1d compares the H2-TPR profiles of the CeO2, MnCeOx-10 solid solutions, and MnOx/CeO2 catalysts. The TPR peak for pristine CeO2 appeared at ∼400 °C. Two TPR peaks for MnOx/CeO2 were observed at ∼320 °C (sharp one) and 400 °C (shoulder one), which were assigned to the reduction of MnOx and CeO2, respectively.30,34 Meanwhile, the TPR peak for MnCeOx-10 was found at ∼370 °C, which is lower than that for pristine CeO2. This suggests that MnCeOx-10 should exhibit better redox capacity, which in turn would be in favor of catalytic oxidation.
The morphology and structure of the MnCeOx-10 composites were observed by TEM. As shown in Fig. 2a, MnCeOx-10 exhibited a hollow nanosphere structure and had large space from each other, meaning that MnCeOx-10 should have no special core–shell structure. Fig. 2b shows a distinct lattice fringe of 0.31 nm, which matches well with the CeO2(111) crystal plane.35Fig. 2d–f indicate that both the Ce and Mn species are homogeneously distributed in the MnCeOx-10 composite. In all, these results clearly indicated that the Mn cations were well-doped into the lattice of ceria.
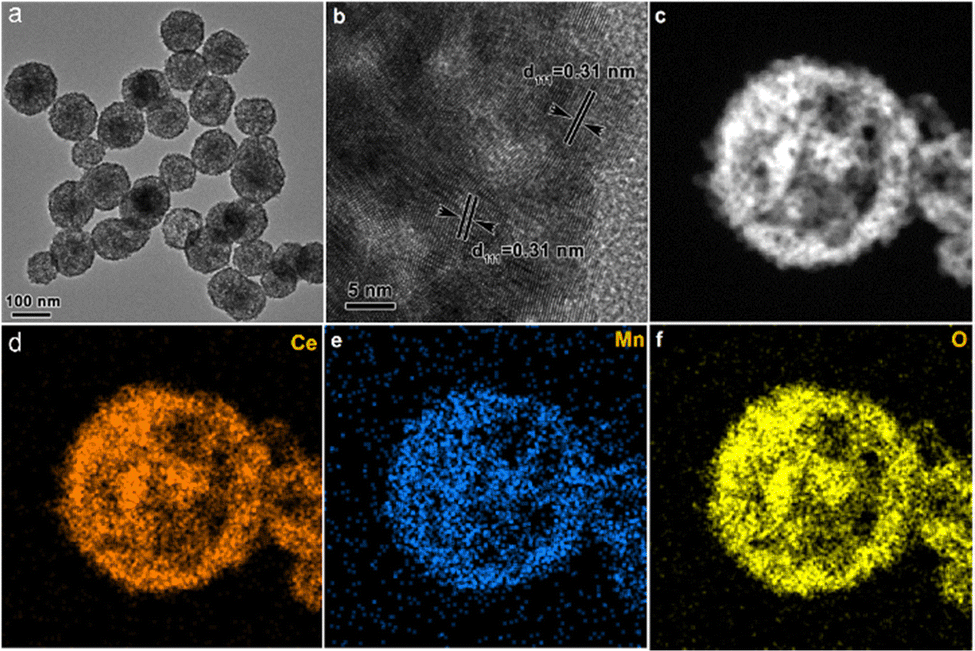 | ||
| Fig. 2 Low-magnification TEM image (a), high-magnification TEM image (b and c), and the elemental mappings of cerium (d), manganese (e), and oxygen (f) in manganese-cerium-oxide composites. | ||
Fig. 3 shows the Ce 3d, O 1s, and Mn 2p XPS spectra of MnCeOx-10 composites and CeO2. The Ce 3d spectra exhibit eight characteristic peaks labeled as v (v3, v2, v1, and v0) and u (u3, u2, u1, and u0) groups.36–38 The u1 and v1 peaks are assigned to Ce3+ species, and the u3, u2, u0, v3, v2, and v0 peaks are attributed to Ce4+ species (Fig. 3a).39,40 The O 1s XP spectra of MnCeOx-10 and CeO2 can be deconvoluted into three components after Gaussian fitting, as shown in Fig. 3b, which can be ascribed to lattice oxygen (Oα, 529.3 eV) and adsorbed oxygen (Oβ, 530.9 eV), respectively. Moreover, another oxygen species corresponds to hydroxyl groups (Oγ, 532.8 eV) on the oxide surface.41–43 The calculated relative percentages of oxygen defects based on the area ratio of AOβ/AOtotal (AOtotal = AOα + AOβ + AOλ) are listed in Table 1. The ratio of oxygen defects in MnCeOx-10 is higher than those of CeO2 and MnOx/CeO2, and the MnCeOx-10 samples showed the highest oxygen defects. It is worth noting that the Ce3+ species and oxygen defects would be generated simultaneously due to a charge compensation mechanism (Ce4+ + Oα → Ce3+ + Oβ).44 In Fig. 3c, Mn 2p3/2 spectra can be divided into two characteristic peaks that correspond to Mn3+ at 640.9 eV and Mn4+ at 642.8 eV, respectively.45,46
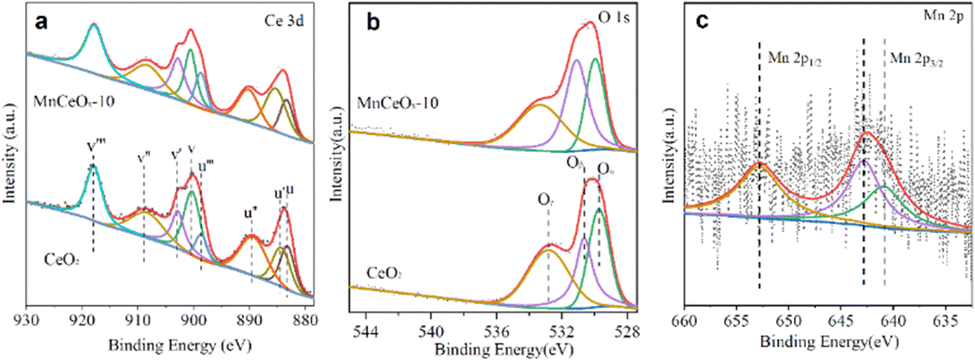 | ||
| Fig. 3 XPS spectra of CeO2 and MnCeOx-10 catalysts over the spectral regions of (a) Ce 3d, (b) O 1s, and (c) Mn 2p. | ||
| Sample | BET (m2 g−1) | Oβ% | Mn3+% | Ce3+% |
|---|---|---|---|---|
| MnCeOx-10 | 114.2 | 38.9 | 26.7 | 28.7 |
| CeO2 | 101.6 | 28.3 | — | 21.4 |
Optical properties
The optical absorption properties of CeO2 and MnCeOx composites were evaluated by UV-vis diffuse reflectance spectroscopy, as shown in Fig. 4a. It was observed that the MnCeOx composites exhibited excellent absorption in the UV region and enhanced absorption in the visible light region. By calculating using the Kubelka–Munk equations and extrapolating the [F(R∞)hν]1/2–hν curves (Fig. 4b), the estimated bandgap energies of the CeO2 and MnCeOx-10 composites were found to be 2.96 and 2.85 eV, respectively.47 Mott Schottky tests showed that the conduction bands of pure CeO2 and MnCeOx-10 were −0.39 eV and −0.51 eV (Fig. S2, ESI†), indicating that oxygen can be oxidized to superoxide radicals to participate in the reaction. The band gap of the MnCeOx-10 composite decreased slightly, indicating that MnCeOx-10 photocatalysts can be excited by light to produce more e−/h+ pairs under solar irradiation, thereby achieving higher photocatalytic activity.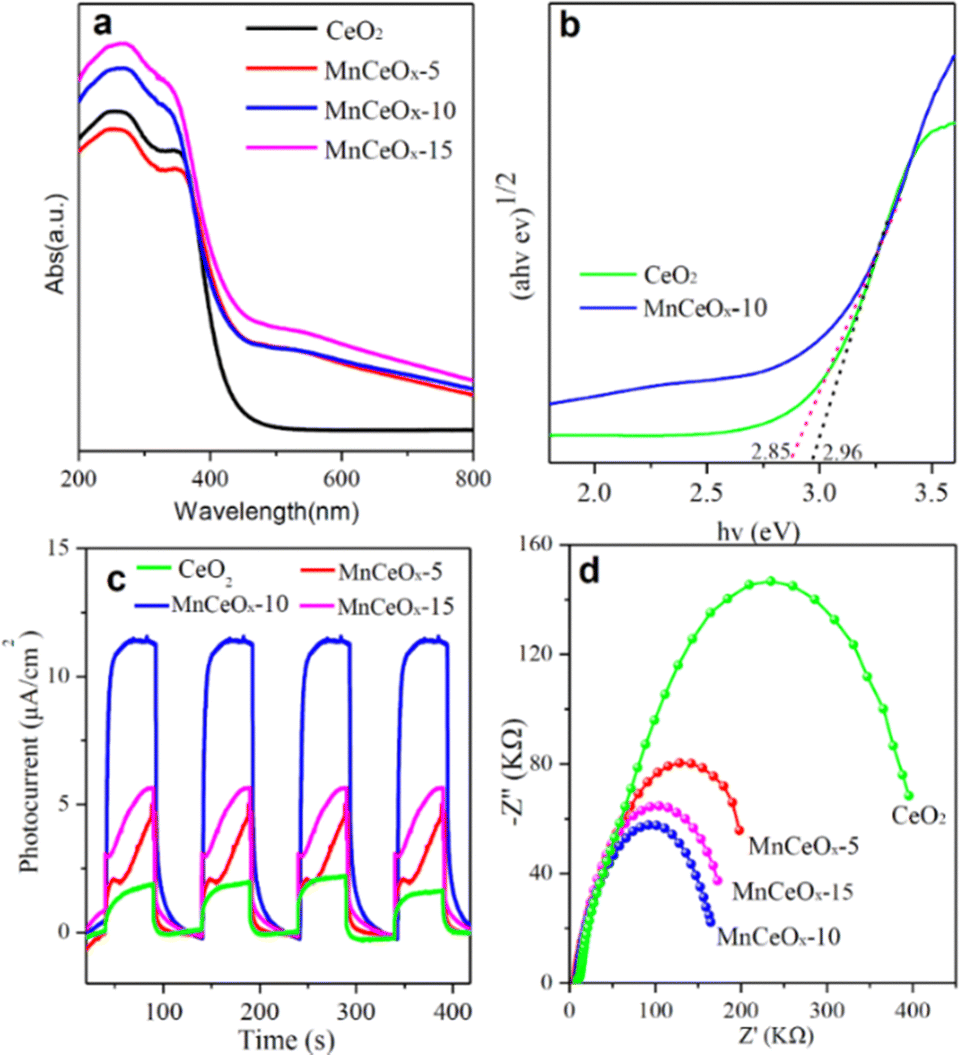 | ||
| Fig. 4 UV-vis absorption spectra (a) with the band gap (b), transient photocurrent spectra (c), and EIS Nyquist plots (d) of CeO2 and MnCeOx composites. | ||
Fig. 4c shows the photocurrent time curve of the CeO2 and MnCeOx composites. MnCeOx composites exhibited enhanced photocurrent density in multiple switching cycles, and MnCeOx-10 exhibited the highest photocurrent density, indicating that MnCeOx-10 can effectively promote the separation and transfer of photo-induced charge carriers.48 In addition, we conducted electrochemical impedance spectroscopy (EIS) measurements to examine the effects of surface properties and interface charge carrier dynamics on the photo-generated holes, which can be captured by surface states and recombined with electrons (Fig. 4d).49 Generally, each arc represents a resistance during the charge-transfer process, and a smaller radius is associated with a lower charge-transfer resistance. The MnCeOx-10 composite gave the smallest diameter and exhibited the fastest charge separation and transfer. These results indicated that the manganese dopants in MnCeOx photocatalysts can effectively improve the separation and transfer efficiency of photoinduced e−/h+ pairs.
Photo-degradation
The photocatalytic activity of the synthesized catalyst, under visible light, was demonstrated through TC photodegradation. The TC concentration at different time intervals was detected by detecting the absorption of the UV visible spectrum at 357 nm. The effects of different mass ratios of MnCeOx composites, CeO2, and MnOx/CeO2 composites on photocatalytic activity were studied, as shown in Fig. 5a. A sharp decrease of the TC concentration was observed at 10 min, which is mainly attributed to the adsorption of TC on these ceria-based composites. Compared with CeO2 (20.9%) and MnOx/CeO2 composites (45%), the TC degradation rate over these composite materials was significantly improved after 90 minutes of simulated solar light irradiation. And, MnCeOx-10 showed the optimal degradation rate, reaching up to 65.3%. When the TC concentration is low, photocatalytic degradation follows the first-order kinetics model: −ln(c0/c) = kt, where c0 is the TC concentration at the beginning of lamp on, k is the apparent rate constant, and c is the TC concentration after irradiation. According to this model for linear fitting, Fig. 5b and c, the fitting curve shows that the apparent rate constants of CeO2, MnCeOx-5, MnCeOx-10, and MnCeOx-15 are 0.00133 min−1, 0.00178 min−1, 0.00683 min−1, and 0.00585 min−1, respectively. The MnCeOx-10 sample has the highest apparent rate constant, which is more than four times that of CeO2. Fig. 5d shows that the catalytic activity of the CeO2 and MnCeOx composites has a direct relationship with the concentration of the surface OV. Among all the catalysts, the MnCeOx-10 composite gives the highest OV concentration and shows the best rate constant. The apparent reaction rate of these MnCeOx catalysts increases proportionally to the relative content of Oγ, following the order of MnCeOx-10 > MnCeOx-15 > MnOx/CeO2 > MnCeOx-5 > CeO2, which indicated that the oxygen defects played an important role in the TC photodegradation. Fig. 5e shows the reusability of the MnCeOx-10 composite with the four-cycle tests, and the degradation rate remained stable, which indicated its good stability during photocatalysis. MnCeOx exhibited high stability and robust nature during photocatalysis, evidenced by XRD results (Fig. S3, ESI†). Based on the above analysis, it can be seen that after doping with manganese ions, the photocatalytic degradation rate and degradation rate of CeO2 have been greatly improved. This is mainly because the introduction of manganese not only enhances its light absorption ability and surface oxygen vacancies but also promotes the separation of electrons and holes, decreasing the recombination rate of photo-generated carriers, which can provide more active centers for photocatalytic reactions.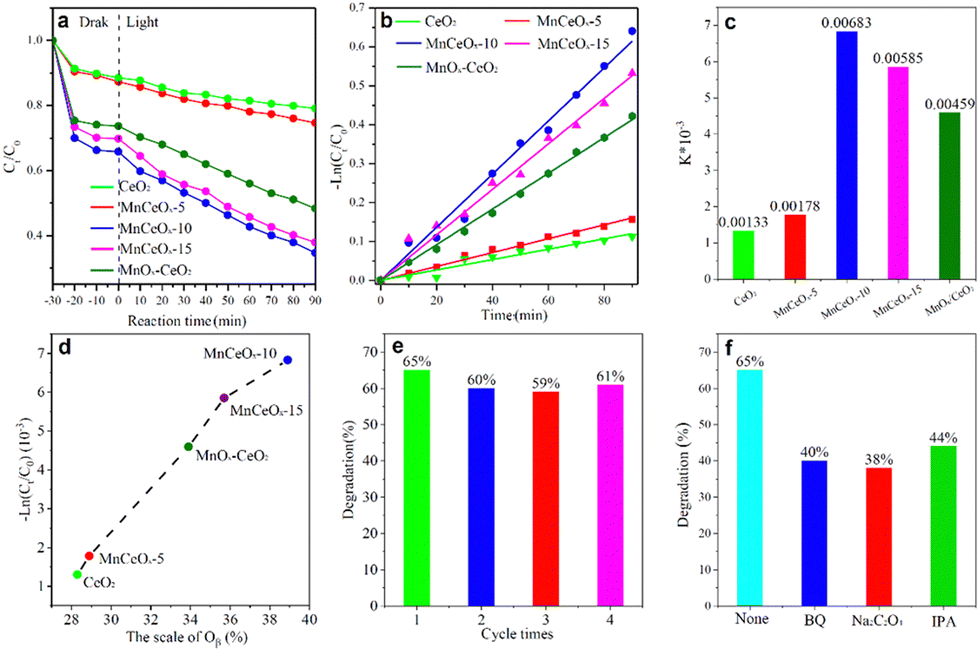 | ||
| Fig. 5 Photodegradation efficiency (a), first-order kinetics curve (b), and apparent reaction rate diagram (c) of the MnCeOx complex and pure CeO2. The relationship between the conversion rate of TC and the concentration of oxygen vacancies determined by XPSR (d), recyclability test (e), and active species trapping experiments (f) of CeO2 and MnCeOx-10 composites. | ||
To gain more insight into the roles of photo-generated active species, radical trapping experiments with a series of scavengers were conducted over MnCeOx-10 composites. Fig. 5f shows that photodegradation efficiency was significantly decreased with the addition of trapping agents: 40% (BQ), 38% (Na2C2O4), and 44% (IPA), which suggested that reactive species (h+, ˙O2−, and ˙OH) play a key role in the reaction process.
Finally, a tentative reaction mechanism for the photodegradation of TC via MnCeOx solid solution is proposed (Fig. 6). When the solution containing the catalyst is irradiated under visible light, electrons are excited from the valence band to the conduction band. The excited photoelectrons are scavenged by dissolved oxygen in the water to form superoxide anions (˙O2−) and holes are scavenged by water molecules from the TC solution to form hydroxyl radicals (˙OH), which are highly oxidative species responsible for the TC degradation. It is worth noting that TC eventually breaks down into water and carbon dioxide.
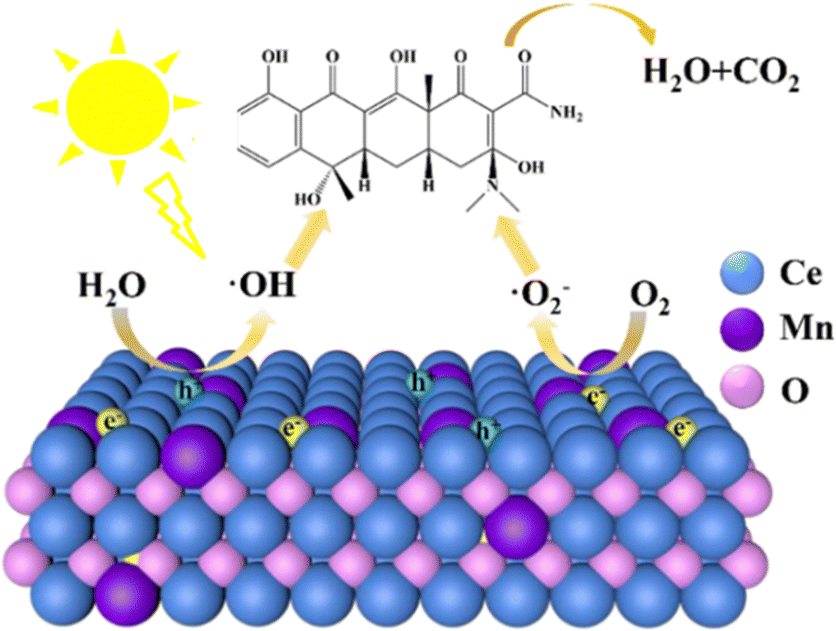 | ||
| Fig. 6 Schematic diagram of the photoelectron–hole pair separation mechanism of MnCeOx under simulated solar illumination. | ||
Conclusions
In conclusion, we have designed and constructed a type of MnCeOx solid solution composite by a hydrothermal method. The successful preparation of the Mn-doped CeO2 composite was demonstrated by a series of characterization techniques. Metallic manganese doping generates abundant oxygen vacancies on the surface of CeO2. This greatly enhances the separation and transfer of photogenerated charges. Compared with bare ceria, the MnCeOx composite exhibited higher efficiency in the separation and transfer of photogenerated charges and higher catalytic performance, enabling it to be an effective candidate for the photocatalytic degradation of tetracycline.Conflicts of interest
The authors declare that they have no known competing financial interests or personal relationships that could have appeared to influence the work reported in this paper.Acknowledgements
We appreciate the financial support from the funding of the National Natural Science Foundation of China (No. 22065029 and No. 22172167), the Natural Science Foundation of Inner Mongolia Autonomous Region (No. 2022MS02002), the central guidance for local scientific and technological development funds (No. 2022ZY0081), and the Program of Scientific Research of Inner Mongolia Autonomous Region (No. NJZY19046).Notes and references
- S. Wu, H. Hu, Y. Lin, J. Zhang and Y. H. Hu, Chem. Eng. J., 2020, 382, 122842 CrossRef CAS.
- H. Jiang, Q. Wang, P. Chen, H. Zheng, J. Shi, H. Shu and Y. Liu, J. Cleaner Prod., 2022, 339, 130771 CrossRef CAS.
- J. Z. Hassan, A. Raza, U. Qumar and G. Li, Sustainable Mater. Technol., 2022, 33, e00478 CrossRef CAS.
- S. Das and Y. H. Ahn, Chemosphere, 2022, 291, 132870 CrossRef CAS PubMed.
- X. He, T. Kai and P. Ding, Environ. Chem. Lett., 2021, 19, 4563 CrossRef CAS PubMed.
- D. Wang, F. Jia, H. Wang, F. Chen, Y. Fang, W. Dong, G. Zeng, X. Li, Q. Yang and X. Yuan, J. Colloid Interface Sci., 2018, 519, 273 CrossRef CAS PubMed.
- Y. Wang, Y. Gong, N. Lin, L. Yu, B. Du and X. Zhang, J. Colloid Interface Sci., 2022, 606, 941 CrossRef CAS PubMed.
- H. Lin, B. Jie, J. Ye, Y. Zhai, Z. Luo, G. Shao, R. Chen, X. Zhang and Y. Yang, Surf. Interfaces, 2023, 36, 102564 CrossRef CAS.
- J. Yu, H. Li, N. Lin, Y. Gong, H. Jiang, J. Chen, Y. Wang and X. Zhang, Catalysts, 2023, 13, 148 CrossRef CAS.
- T. Lu, Y. Gao, Y. Yang, H. Ming, Z. Huang, G. Liu, D. Zheng, J. Zhang and Y. Hou, Chemosphere, 2021, 283, 131256 CrossRef CAS PubMed.
- H. Li, J. Yu, Y. Gong, N. Lin, Q. Yang, X. Zhang and Y. Wang, Sep. Purif. Technol., 2023, 307, 122716 CrossRef CAS.
- Y. Wang, N. Lin, J. Xu, H. Jiang, R. Chen, X. Zhang and N. Liu, Appl. Surf. Sci., 2023, 639, 158263 CrossRef CAS.
- Q. Shi, G. Ping, X. Wang, H. Xu, J. Li, J. Cui, H. Abroshan, H. Ding and G. Li, J. Mater. Chem. A, 2019, 7, 2253 RSC.
- Q. Shi, Z. Qin, C. Yu, A. Waheed, H. Xu, Y. Gao, H. Abroshan and G. Li, Nano Res., 2020, 13, 939 CrossRef CAS.
- F. Huang, D. Ye, X. Guo, W. Zhan, Y. Guo, L. Wang, Y. Wang and Y. Guo, Catal. Sci. Technol., 2020, 10, 2473 RSC.
- X. Gong, Q. Shi, X. Zhang, J. Li, G. Ping, H. Xu, H. Ding and G. Li, J. Rare Earths, 2023, 41, 233 CrossRef CAS.
- Q. Shi, Y. Zhang, Z. Li, Z. Han, L. Xu, A. Baiker and G. Li, Nano Res., 2023, 16, 6951 CrossRef CAS.
- S. Yuán, B. Xu, Q. Zhang, S. Liu, J. Xie, M. Zhang and T. Ohno, ChemCatChem, 2018, 10, 1267 CrossRef.
- Q. Zhang, Z. Zhou, T. Fang, H. Gu, Y. Guo, W. Zhan, Y. Guo and L. Wang, J. Rare Earths, 2022, 40, 1462 CrossRef CAS.
- P. K. Sharma and O. P. Pandey, Solid State Sci., 2022, 126, 106846 CrossRef CAS.
- M. Wang, M. Shen, X. Jin, J. Tian, Y. Shao, L. Zhang, Y. Li and J. Shi, Chem. Eng. J., 2022, 427, 130987 CrossRef CAS.
- M. Wang, M. Shen, X. Jin, J. Tian, M. Li, Y. Zhou, L. Zhang, Y. Li and J. Shi, ACS Catal., 2019, 9, 4573 CrossRef CAS.
- I. Y. Habib, J. Burhan, F. Jaladi, C. M. Lim, A. Usman, N. T. R. N. Kumara, S. C. E. Tsang and A. H. Mahadi, Catal. Today, 2021, 375, 506 CrossRef CAS.
- Y. Wang, Q. Jiang, L. Xu, Z.-K. Han, S. Guo, G. Li and A. Baiker, J. Mater. Chem. A, 2021, 13, 61078 CAS.
- Y. Wang, Y. Zhang, Q. Jiang, S. Guo, A. Baiker and G. Li, ChemCatChem, 2022, 14, e202200203 CrossRef CAS.
- Z. Yan, G. Huang, G. Wang, M. Xiang, X. Han and Z. Xu, J. Rare Earths, 2022, 40, 906 CrossRef CAS.
- K. Yang, D.-F. Li, W.-Q. Huang, L. Xu, G.-F. Huang and S. Wen, Appl. Phys. A: Mater. Sci. Process., 2017, 123(1), 96, DOI:10.1007/S00339.
- S. M. Chaudhari, O. S. Gonsalves and P. R. Nemade, Mater. Res. Bull., 2021, 143, 111463 CrossRef CAS.
- Y. Chen, Y. Li, W. Chen, W. W. Xu, Z.-K. Han, A. Waheed, Z. Ye, G. Li and A. Baiker, Nano Res., 2021, 15, 1366 CrossRef.
- L. Zhang, L. Zhang, G. Xu, C. Zhang, X. Li, Z. Sun and D. Jia, New J. Chem., 2017, 41, 13418 RSC.
- X. Zhang, S. Ma, B. Gao, F. Bi, Q. Liu, Q. Zhao, J. Xu, G. Lu, Y. Yang and M. Wu, J. Colloid Interface Sci., 2023, 651, 424 CrossRef CAS PubMed.
- Q. Shen, Z. Lu, F. Bi, D. Zhang, L. Li, X. Zhang, Y. Yang and M. Wu, Sep. Purif. Technol., 2023, 325, 124707 CrossRef CAS.
- L. Zhang, Y. Yang, Y. Li, J. Wu, S. Wu, X. Tan and Q. Hu, Chin. J. Catal., 2022, 43, 379 CrossRef CAS.
- D. Ma, L. Yang, B. Huang, L. Wang, X. Wang, Z. Sheng and F. Dong, New J. Chem., 2019, 43, 15161 RSC.
- X. Gong, B. Liu, G. Zhang, G. Xu, T. Zhao, D. Shi, Q. Wang and J. Zhang, CrystEngComm, 2016, 18, 5110 RSC.
- X. Gao, Z. Jin, R. Hu, J. N. Hu, Y. Bai, P. Wang, J. Zhang and C. Zhao, J. Rare Earths, 2021, 39, 398 CrossRef CAS.
- M. H. Basha, C. Ramu, N. O. Gopal and M. V. B. Reddy, J. Mol. Struct., 2021, 1231, 129892 CrossRef CAS.
- X. Zhang, F. Bi, Z. Zhu, Y. Yang, S. Zhao, J. Chen, X. Lv, Y. Wang, J. Xu and N. Liu, Appl. Catal., B, 2021, 297, 120393 CrossRef CAS.
- S. Chang, G. Harle, J. Ma and J. Yi, Appl. Catal., A, 2020, 604, 117775 CrossRef CAS.
- X. Wei, X. Rang, W. Zhu, M. Xiang, Y. Deng, F. Jiang, R. Mao, Z. Zhang, X. Kong and F. Wang, J. Chem. Phys., 2021, 542, 111079 CAS.
- W. Zou, B. Deng, X. Hu, Y. Zhou, Y. Pu, S. Yu, K. Ma, J. Sun, H. Wan and L. Dong, Appl. Catal., B, 2018, 238, 111 CrossRef CAS.
- J. Wang, X. Shi, L. Chen, H. Li, M. Mao, G. Zhang, H. Yi, M. Fu, D. Ye and J. Wu, Appl. Catal., A, 2021, 625, 118342 CrossRef CAS.
- Q. Shi, X. Zhang, Z. Li, A. Raza and G. Li, ACS Appl. Mater. Interfaces, 2023, 15, 30161 CrossRef CAS PubMed.
- B. M. Reddy, P. Bharali, G. Thrimurthulu, P. Saikia, L. Katta and S.-E. Park, Catal. Lett., 2008, 123, 327 CrossRef CAS.
- Y. Dong, J. Zhao, J.-Y. Zhang, Y. Chen, X. Yang, W. Song, L. Wei and W. Li, Chem. Eng. J., 2020, 388, 124244 CrossRef CAS.
- X. Zhang, Z. Zhao, S. Zhao, S. Xiang, W. Gao, L. Wang, J. Xu and Y. Wang, J. Catal., 2022, 415, 218 CrossRef CAS.
- S. Agarwal, X. Zhu, E. J. M. Hensen, B. Louise Mojet and L. Lefferts, J. Phys. Chem., 2015, 119, 12423 CAS.
- C.-L. Tan, M.-Y. Qi, Z.-R. Tang and Y.-J. Xu, Appl. Catal., B, 2021, 298, 120541 CrossRef CAS.
- P. Li, X. Yan, S. Gao and R. Cao, Chem. Eng. J., 2021, 421, 129870 CrossRef CAS.
Footnote |
| † Electronic supplementary information (ESI) available. See DOI: https://doi.org/10.1039/d3nj04299e |
| This journal is © The Royal Society of Chemistry and the Centre National de la Recherche Scientifique 2023 |